 Duplex
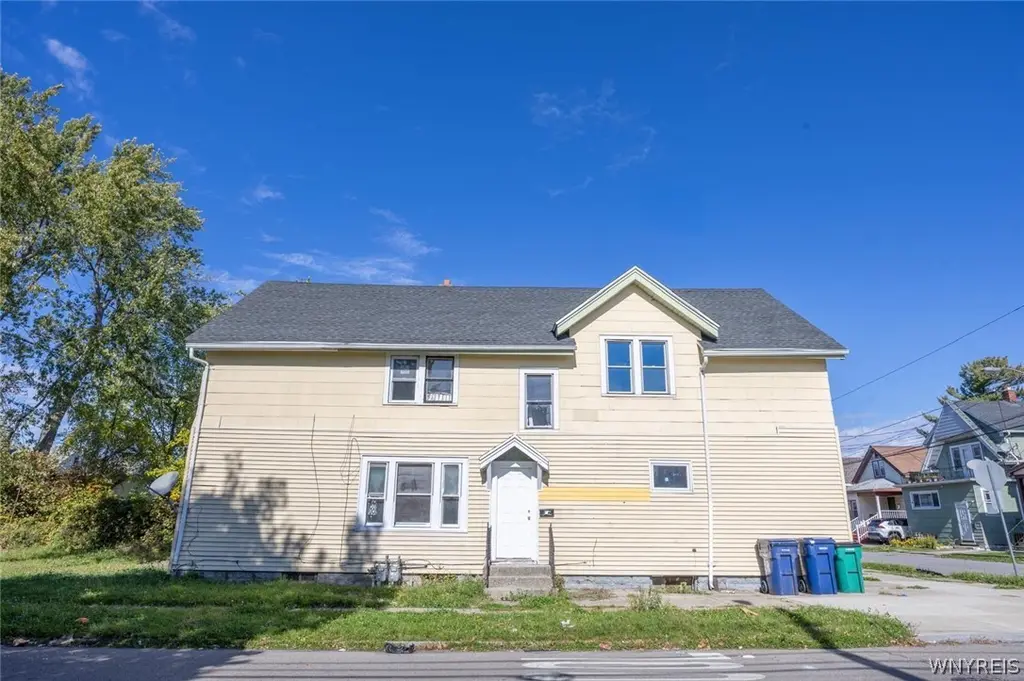
154 Hagen St · Buffalo, NY
Flood risk 7/10 · Major
- FEMA flood zone
- X (unshaded)
- Chance of flooding over 30 yrs
- 0.76%
- Est. flood insurance / yr
- $473 – $860
Fire risk 1/10 · Minimal
- Est. fire insurance / yr
- $691 – $1,283
Heat risk 3/10 · Minor
- Hot days now (above 93°F)
- 7 days/yr
- Hot days in 30 yrs
- 15 days/yr
Wind risk 1/10 · Minimal
- Chance of severe wind over 30 yrs
- —
Air-quality risk 3/10 · Minor
- Unhealthy air days now
- 2 days/yr
- Unhealthy air days in 30 yrs
- 3 days/yr
Risk factors via First Street. Map © Google.
Why this score? — see what drove the B+ grade
The composite is a weighted blend of 9 inputs, each scored 0–100. Each bar is that input's sub-score; the figure is the points it added to the 100-point composite (weight × sub-score).
- Cash flow +30.0/30.0
- ARV discount +15.0/15.0
- 1% rule +10.0/10.0
- DSCR +10.0/10.0
- Livability +3.9/5.0
- Schools +3.3/10.0
- Rent growth +2.7/5.0
- Condition / age +2.5/5.0
- Appreciation +0.0/10.0
$129,900
🖨 Deal sheet 📄 Offer letter ✓ Due diligence
Multi-family units
County records classify this as Multi-Family (2-4 Unit). Listing-text estimate: 2 units. confirmed
Listing remarks
Welcome to this spacious 2-family home offering great investment potential in the heart of Buffalo! The lower unit features 4 bedrooms, a bright living room, full kitchen, and full bathroom. The upper unit offers 3 bedrooms, a comfortable living area, kitchen, and full bathroom. A full basement provides additional storage and utility space. Conveniently located near schools, shopping, restaurants, and public transportation. With some updates and improvements, this property presents an excellent opportunity for investors or owner-occupants looking to build equity and generate rental income.
Key facts
- Near schools
- Near shopping
- Near restaurants
Tags
Property features AI
Finance
- Financial info: Property contains 2 total units; Owner pays water; water is included in rent; Operating expenses include water/sewer
Exterior
- Parking: Concrete parking
- Utilities: Public water connected; Sewer connected
- Home design: Two-story multiunit property; Resale condition; Vinyl siding
- Construction: Vinyl siding exterior; Existing construction (built previously)
- Exterior features: Corner lot on a city street; Near public transit; Rectangular residential lot; dimensions approx. 32 x 102
Interior
- Kitchen: Gas water heater
- Bedrooms: One unit with 3 bedrooms; One unit with 4 bedrooms
- Flooring: Hardwood; Vinyl; Varies
- Bathrooms: Two full bathrooms total (one full bath in each unit)
- Heating & cooling: Gas forced-air heating
- Interior features: Hardwood and vinyl flooring; some areas vary
- Laundry & utility: Separate gas meters for each unit; Separate electric meters for each unit
Neighborhood map
What this means for you Summary
Snapshot
- This is a 1×4bd/1.0ba + 1×3bd/1.0ba units multifamily listed at $130k.
Deal economics
- At list price, monthly cash flow is $1k ($15k/yr) — positive. Per door: $621/mo.
- The deal already cash-flows at list — no discount required.
- Meets the 1% rule at list price ($3k rent vs $130k).
- Recommended offer: $128k (1.5% below list) — sets the bar for market timing.
- Cap rate 18.3% vs local median 8.0% in Buffalo — top-decile yield for the area; either an underpriced asset or a hidden risk that comps aren't pricing in. Stress-test before assuming the spread holds.
Location & tenants
- Location reads 77/100 on livability (#195 in NY, #3,011 nationally) — a middle-class / working-renter tenant base. Strengths: commute A+, housing A+, health & safety A+; Watch: crime F, employment D-.
- Buffalo City School District (urban): math 41% / reading 40% proficiency, ranked #535 of 590 in NY (top 91%) — families likely to look elsewhere, expect single-tenant / working-renter base with shorter leases; 75% free/reduced lunch — lower-income household profile, screen leases tightly.
- Market conditions: Rents flat; 237 active listings in the ZIP; 1 comparable units currently listed for rent nearby; lower-income renter base — watch delinquency; 1,244 units permitted in Erie County in 2024 (563 in 5+ unit buildings).
- At $2,778/mo this rent would consume 74% of the median local household income ($45k/yr) (locally 2873% of renters already pay >50% of income on rent) — very limited rent-growth headroom before tenants either downsize or default.
Forward outlook
- Local home prices are declining (-3.0%/yr); year-one equity from $898 of loan paydown is wiped out by about $4k of value loss. Plan a longer hold.
- At projected returns (-3.0% appreciation + 0.7% rent growth), your $36k cash investment doubles in ~3 years — after that, you're playing with house money.
Negotiation context
- It's been on market 30 days — a 2% lower offer ($128k) is reasonable based on typical stale-listing flexibility.
- 6 sale attempts since 13y ago with the ask held roughly flat each time — persistent listings suggest the price (not the market) is what's stuck; bring a comps-based counter.
- Current owner paid $63k; list at $130k implies a 106% gain — meaningful room to come down on a strong offer.
Risks & watch-outs
- Watch-outs: flood insurance adds $56/mo; built in 1925 — expect roof / HVAC / electrical / plumbing capex.
- Climate carrying-cost: major flood risk — expect insurance premiums to compound above CPI over the hold.
Questions for the listing agent
- Can we see the unit-by-unit rent roll, current vacancy, and any below-market leases? What's the average tenancy length?
- What capital expenditures (roof, boiler, parking lot, exteriors) have been made in the last 5 years, and what's planned in the next 2?
- Built in 1925 — when were the roof, HVAC, electrical panel, plumbing, and water heater last replaced?
- What's the actual annual flood-insurance premium (NFIP or private), and is the property in a SFHA with mandatory coverage?
- Is there a deadline driving the sale (1031 exchange, divorce, estate, relocation)? That informs how much negotiation room exists.
- Crime grade is F in this area — have there been break-ins, vandalism, or insurance claims at this property in the last 3 years? What carrier currently insures it and at what premium?
- What's the average days-on-market for RENTAL listings here right now (not sales)? A rising rental-DOM trend means longer vacancies and softer asking-rent achievability than the comps imply.
- What's the recent tenant-quality profile in this submarket — average credit score on applications, eviction rate, late-payment / NSF rate, and stable-employment percentage? A property-management company in the area should have these aggregated.
- How much new apartment / multifamily construction is in the pipeline within 1–3 miles? Heavy new supply (>2% of stock underway) typically softens rents 12–24 months out; light construction supports rent growth.
Investment metrics
- 1% rule
- 2.14% ✓
- Cap rate
- 18.27%
- Cash-on-cash
- 42.79%
- DSCR
- 2.90
- GRM
- 3.9
CMA / ARV
- ARV (on-the-fly)
- $195,000
- Comps found
- 12
Show comp detail 12 sales within ~0.75 mi
| Address | Dist | Beds/Ba | Sqft | Sold | Price | $/sf | Match |
|---|---|---|---|---|---|---|---|
| 1402 E Delavan Ave Unit N | 0.30mi | 6/2.0 (+1) | 2,523 (-3%) | 6mo | $225,000 | $89 | 71 |
| 116 Fisher St | 0.35mi | 6/2.0 (+1) | 2,268 (-13%) | 1mo | $45,000 | $20 | 56 |
| 183 Freund St | 0.37mi | 6/2.0 (+1) | 2,332 (-10%) | 7mo | $140,000 | $60 | 55 |
| 229 Sprenger Ave | 0.32mi | 6/2.0 (+1) | 2,236 (-14%) | 3mo | $142,000 | $64 | 55 |
| 1372 E Delavan Ave | 0.27mi | 5/3.0 | 2,296 (-12%) | 14mo | $145,000 | $63 | 52 |
| 225 Sprenger Ave | 0.32mi | 6/2.0 (+1) | 2,236 (-14%) | 17mo | $225,000 | $101 | 43 |
| 2105 Bailey Ave | 0.58mi | 6/2.0 (+1) | 2,360 (-9%) | 15mo | $115,000 | $49 | 40 |
| 201 Courtland Ave | 0.45mi | 6/2.0 (+1) | 2,332 (-10%) | 22mo | $261,000 | $112 | 39 |
| 119 Harriet Ave | 0.54mi | 5/2.0 | 2,258 (-13%) | 19mo | $170,000 | $75 | 37 |
| 32 Kermit Ave | 0.50mi | 6/2.0 (+1) | 2,346 (-10%) | 22mo | $112,500 | $48 | 37 |
| 42 Rawlins Ave | 0.70mi | 6/2.0 (+1) | 2,296 (-12%) | 19mo | $185,000 | $81 | 27 |
| 409 Doat St | 0.68mi | 5/2.0 | 2,256 (-13%) | 24mo | $240,000 | $106 | 27 |
Match score weights: distance 35% · size 25% · config 20% · recency 20%. Top-matched comps best support the ARV.
Projected returns pro-forma
-3.0% appreciation · 0.67% rent growth · sell at horizon
- IRR
- 34.7%
- Equity multiple
- 2.42×
- Total profit
- $51,725
- Equity at exit
- $19,369
- IRR
- 40.3%
- Equity multiple
- 4.36×
- Total profit
- $122,231
- Equity at exit
- $11,231
Cash invested: $36,372 (down + closing). Projections, not guarantees.
Landlord ↔ Tenant lean methodology
- Overall (STATE)
- 15 Strongly Tenant-Friendly
- State New York
- 15 Strongly Tenant-Friendly · D+10
- County
- — inherits STATE
- City
- — inherits STATE
ZIP-level market 14215
- Home prices YoY
- -30.0%
- Rents YoY
- 0.7%
- Active inventory
- 237
- Price-to-rent
- 7.5×
Monthly cashflow live
- Estimated rent
- $2,778 high interval (Pro) →
- Mortgage (P&I)
- −$681
- Tax est. 1.5%
- −$162 /mo · $1,948/yr
- Insurance
- −$54
- Flood insurance flood zone
- −$56 /mo · $666/yr
- HOA
- −$0
- Vacancy / Maint / Mgmt
- −$583
- Net cashflow
- $1,241
Break-even live
2-unit breakdown (identical units grouped — click to expand)
| Units | Beds | Baths | Est. rent |
|---|---|---|---|
| 1× unit | 4 | 1 | $1,448 |
| 1× unit | 3 | 1 | $1,330 |
| Total (2 units) | $2,778 | ||
UW: 25.0% down · 7.5% · 30yr · 1.5% tax · 5.0% vac · 8.0% maint · 8.0% mgmt
Financing live
Cash to close
- Down payment
- $32,475
- Closing costs
- $3,897
- Reserves months
- —
- Total cash needed
- —
Loan-product check · same deal, 3 products live
Conventional
25% down · 7.5% · 30yr
- Down + closing
- —
- Monthly P&I
- —
- Monthly cashflow
- —
- DSCR
- —
- Eligible?
- —
Personal DTI + credit; lowest rate.
DSCR
20% down · 8.5% · 30yr
- Down + closing
- —
- Monthly P&I
- —
- Monthly cashflow
- —
- DSCR
- —
- Eligible?
- —
No personal income docs; deal must DSCR.
Hard money
10% down · 12.0% · 12mo
- Down + closing
- —
- Monthly P&I
- —
- Monthly cashflow
- —
- DSCR
- —
- Eligible?
- —
Short-term bridge; refi at stabilization.
Rent comps 1 comps
| Address | Beds | Baths | Sqft | Rent | $/sqft | DOM | Units | Dist |
|---|---|---|---|---|---|---|---|---|
| 979 Walden Ave Buffalo, NY | 4.0 | 3.0 | 1793 | $2,000 | $1.12 | 1d | 1 | 0.96mi |
Listing history 31 events
-
2026-06-18days on market $129,900 Active 30 DOM
-
2026-06-17days on market $129,900 Active 29 DOM
-
2026-06-16days on market $129,900 Active 28 DOM
-
2026-06-15days on market $129,900 Active 27 DOM
-
2026-06-13days on market $129,900 Active 25 DOM
-
2026-06-13days on market $129,900 Active 24 DOM
-
2026-06-10days on market $129,900 Active 22 DOM
-
2026-06-09days on market $129,900 Active 21 DOM
-
2026-06-08days on market $129,900 Active 20 DOM
-
2026-06-07days on market $129,900 Active 19 DOM
-
2026-06-03days on market $129,900 Active 15 DOM
-
2026-06-02days on market $129,900 Active 14 DOM
-
2026-06-01days on market $129,900 Active 13 DOM
-
2026-05-31days on market $129,900 Active 12 DOM
-
2026-05-19$129,900 Active
-
2026-01-22historical
-
2025-11-04status Active
-
2025-11-02price $150,000
-
2025-10-22$99,000 Active
-
2018-02-26soldstatus $63,000
-
2017-07-19status Pending Sale
-
2017-07-15historical
-
2017-06-30$69,900 Active
-
2016-08-11historical
-
2016-06-27price $58,900
-
2016-05-06$64,900 Active
-
2014-04-10soldstatus $37,000
-
2014-04-10soldstatus $37,000
-
2013-11-01$39,900
-
2009-01-30soldstatus $47,000
-
2004-11-22soldstatus $25,000
ⓘ Source: listings_history table (triggers on properties + properties_extension) + one-shot
backfill from property_details.listing_events for pre-trigger history.
Climate risk First Street
- Flood 7/10 Severe FEMA zone X (unshaded) · 76% chance over 30 yrs
- Wildfire 1/10 Low
- Heat 3/10 Moderate 7 d/yr ≥93°F today · 15 d/yr by 30 yrs out
- Wind 1/10 Low
- Air quality 3/10 Moderate 2 unhealthy d/yr today · 3 by 30 yrs out
Nearby sold comps map
Loading sold comps map…
Walkable amenities ~0.75 mi
Loading nearby amenities…
Taxation est. · year 1
- Rental income
- $33,336
- − Mortgage interest
- −$7,276
- − Property taxes
- −$1,948
- − Insurance
- −$1,316
- − Repairs & maintenance
- −$2,667
- − Management
- −$2,667
- − Depreciation
- −$3,779
- Taxable income
- $13,682
- Est. tax owed @ 24.0%
- −$3,284
- After-tax cash flow
- $11,613/yr
For passive investors: Depreciation is non-cash, so a rental often shows a tax loss while cash-flowing — sheltering income. Rental losses are passive: they offset passive income freely, and up to $25,000/yr can offset ordinary (W-2) income if you actively participate and your MAGI is under $100k (phasing out to $0 by $150k); unused losses carry forward. On sale, claimed depreciation is recaptured at up to 25%, and gains may owe capital-gains tax (a 1031 exchange can defer both). Figures are a year-1 estimate at your 24.0% rate — not tax advice; consult a CPA.
Schools (NCES district)
- District
- Buffalo City School District
- NCES district ID
- 3605850
- Math proficiency
- 41% ▲ 11.00%
- Reading proficiency
- 40% ▲ 7.00%
- Median HH income
- $31,665
- Composite
- 33.17/100
- National rank
- #5544
- State rank
- #535 of 590 in NY
Livability — Buffalo
- Score
- 77/100
- State rank
- #195
- US rank
- #3011
Category grades
Schools grade is shown separately in the Schools card above.
Census & demographics
- Census place
- Buffalo, NY
- County
- Erie County · 714,559 people
- City population
- 440,021
- Metro
- Buffalo-Cheektowaga, NY
- Population (ZIP)
- 42,524
- Household income
- $44,955
- Rent vs Own
- Severe rent burden
- 2873.0
Population outlook (Erie County) Hauer SSP2
- Today (2025)
- 933,037 people
- By 2030
- 935,181 · +0.2%
- By 2040
- 928,531 · -0.5%
- By 2050
- 905,725 · -2.9%
- By 2075
- 834,037 · -10.6%
- By 2100
- 708,033 · -24.1%
Race, ethnicity, and origin ACS 2023
- Neighborhood character
- Predominantly Black (67%)
- Race & ethnicity
- Black 67% White 15% Asian 7% Hispanic / Latino 6% Two or more races 6%
- Hispanic origin (detail)
- Puerto Rican 4%
- Common ancestry
- Romanian 4% Lithuanian 1% Italian 1%
- Foreign-born
- 9% · Canada, China
- Languages at home
- 88% English-only · Other Indo-European 4% Spanish 4% Chinese 1%
Political lean MEDSL · Erie
- 2024 margin
- Lean D (+9.7) · D 54.8% · R 45.2%
- 2008→2024 swing
- -7.9pp toward R · 2008: 17.5pp · 2024: 9.7pp
- All cycles
- 2024: D+9.7 2020: D+14.7 2016: D+4.8 2012: D+15.6 2008: D+17.5
Not yet ingested
- Civics
- —
Market trends
- HPI YoY
- ▼ -126.29%
- Current HPI
- 295.2966
- Rent YoY
- ▲ 0.67%
- Metro
- Buffalo-Cheektowaga, NY
- State GDP YoY
- ▲ 2.60%
- F500 in state
- 92
Industry mix (Fortune 500 HQ in NY)
| Industry | F500 HQs | Revenue |
|---|---|---|
| Financial Services | 10 | $950B |
|
||
| Consumer Goods | 9 | $162B |
|
||
| Insurance | 4 | $225B |
|
||
| Telecommunications | 2 | $144B |
|
||
| Pharmaceuticals | 2 | $112B |
|
||
| Media / Entertainment | 2 | $69B |
|
||
Price history
+419.6% since first listed17 events — show timeline
- 2026-05-19 Listed $129,900 WNYREIS
- 2026-01-22 Listing Removed — WNYREIS
- 2025-11-04 Relisted — WNYREIS
- 2025-11-02 Price Changed $150,000 WNYREIS
- 2025-10-22 Listed $99,000 WNYREIS
- 2018-02-26 Sold (Public Records) $63,000 Public Records
- 2017-07-19 Pending — WNYREIS
- 2017-07-15 Listing Removed — WNYREIS
- 2017-06-30 Listed $69,900 WNYREIS
- 2016-08-11 Listing Removed — WNYREIS
- 2016-06-27 Price Changed $58,900 WNYREIS
- 2016-05-06 Listed $64,900 WNYREIS
- 2014-04-10 Sold (Public Records) $37,000 Public Records
- 2014-04-10 Sold (MLS) $37,000 WNYREIS
- 2013-11-01 Listed $39,900 WNYREIS
- 2009-01-30 Sold (Public Records) $47,000 Public Records
- 2004-11-22 Sold (Public Records) $25,000 Public Records
Property tax history
-0.0%/yrLatest (2025): $219 · +0.0% YoY. Source: county tax records.
Cash-flow waterfall
monthlySold comps — $/sqft
last 12 mo · ≤1 miLoading sold comps…