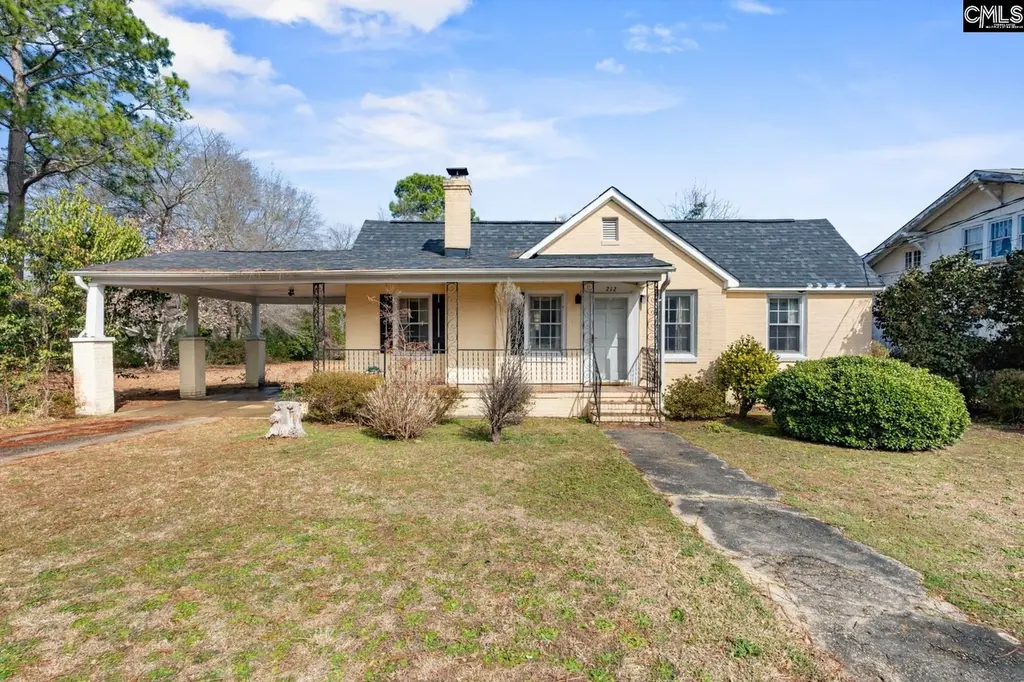
212 Ridge St · Bishopville, SC
Flood risk 1/10 · Minimal
- FEMA flood zone
- X (unshaded)
- Chance of flooding over 30 yrs
- 0.0%
- Est. flood insurance / yr
- $507 – $1,088
Fire risk 3/10 · Minor
- Est. fire insurance / yr
- $783 – $1,453
Heat risk 7/10 · Major
- Hot days now (above 108°F)
- 7 days/yr
- Hot days in 30 yrs
- 16 days/yr
Wind risk 7/10 · Major
- Chance of severe wind over 30 yrs
- 78.0%
Air-quality risk 1/10 · Minimal
- Unhealthy air days now
- 0 days/yr
- Unhealthy air days in 30 yrs
- 0 days/yr
Risk factors via First Street. Map © Google.
Why this score? — see what drove the C grade
The composite is a weighted blend of 9 inputs, each scored 0–100. Each bar is that input's sub-score; the figure is the points it added to the 100-point composite (weight × sub-score).
- Cash flow +20.4/30.0
- ARV discount +15.0/15.0
- DSCR +6.5/10.0
- Appreciation +4.9/10.0
- 1% rule +4.0/10.0
- Livability +2.8/5.0
- Rent growth +2.5/5.0
- Condition / age +2.5/5.0
- Schools +1.3/10.0
$126,900
🖨 Deal sheet 📄 Offer letter ✓ Due diligence
Listing remarks
Welcome to this charming 3 bedroom, 2 bath home located in the heart of downtown Bishopville. Perfectly situated just minutes from local schools, shopping, and dining, this property ??ffers both convenience and comfort. Step inside to find a spacious living area filled with natural light, creating a warm and inviting atmosphere for family gatherings or entertaining guests. The kitchen provides ample cabinet and counter space, making meal preparation a breeze. The primary suite features a private bath for added relaxation, while two additional bedrooms ??ffer flexibility for family, guests, or a home office. Outside, enjoy a generous yard with plenty of room for outdoor activities, gardening
Key facts
- Generous yard
- Private bath
- 0.59 acre lot
Tags
Property features AI
Exterior
- Parking: Attached carport; Two parking spaces
- Utilities: Public water; Public sewer
- Home design: Single-story home
- Construction: Crawlspace foundation
- Exterior features: Covered front porch; Shed on property; Brick exterior on all sides above foundation; Paved road access; Approximately 0.59 acre lot
Interior
- Kitchen: Formica countertops; Painted cabinets; Bar area; Tile floor; Dishwasher; Refrigerator; Stove exhaust vented to exterior; Gas range
- Bedrooms: Master bedroom on main level with private bath, ceiling fan, and private closet; Second bedroom on main level with private bath and private closet; Third bedroom on main level with shared bath, ceiling fan, and private closet
- Flooring: Carpet; Hardwood; Tile
- Bathrooms: Two full bathrooms
- Heating & cooling: Central heating; Central cooling
- Interior features: Ceiling fans in living room and bedrooms; Carpet in living room, formal dining, master bedroom, bedroom 2; Hardwood floors in bedroom 3; Gas fireplace with natural gas logs; One fireplace
- Laundry & utility: Laundry closet on main level
Neighborhood map
What this means for you Summary
Snapshot
- This is a 3-bed/2.0-bath single-family listed at $127k.
Deal economics
- At list price, monthly cash flow is $165 ($2k/yr) — positive.
- The deal already cash-flows at list — no discount required.
- To meet the 1% rule (rent ≥ 1% of price), the offer needs to be $115k (9.5% below list).
- Recommended offer: $115k (9.5% below list) — sets the bar for 1% rule.
Location & tenants
- Location reads 55/100 on livability (#307 in SC) — a working-class tenant base; expect higher turnover. Strengths: cost of living A+, housing A+; Watch: schools F, crime F, amenities F.
- Lee 01 (rural): math 10% / reading 23% proficiency, ranked #78 of 80 in SC (top 98%) — low school quality limits family demand, transient renter base, plan for 1-2y turnover; 84% free/reduced lunch — lower-income household profile, screen leases tightly.
- Market conditions: 28 active listings in the ZIP; 18 units permitted in Lee County in 2024 (0 in 5+ unit buildings).
Forward outlook
- In year one you build about $649 of equity ($877 loan paydown + $-228 appreciation (-0.2% local appreciation)).
- Lee County population projected at -33% by 2050 — secular population decline; favor cash flow + early exit over multi-decade hold.
- At projected returns (-0.2% appreciation + 3.0% rent growth), your $36k cash investment doubles in ~9 years — after that, you're playing with house money.
Negotiation context
- It's been on market 23 days — a 2% lower offer ($125k) is reasonable based on typical stale-listing flexibility.
- 4 sale attempts with the ask held roughly flat each time — persistent listings suggest the price (not the market) is what's stuck; bring a comps-based counter.
- Current owner paid $79k; list at $127k implies a 61% gain — meaningful room to come down on a strong offer.
Risks & watch-outs
- Watch-outs: built in 1938 — expect roof / HVAC / electrical / plumbing capex.
- Climate carrying-cost: major wind risk, 78% chance of damaging wind over 30y; extreme-heat days projected 7→16/yr by 2055 (HVAC capex compounding) — expect insurance premiums to compound above CPI over the hold.
Questions for the listing agent
- Built in 1938 — when were the roof, HVAC, electrical panel, plumbing, and water heater last replaced?
- Is there a deadline driving the sale (1031 exchange, divorce, estate, relocation)? That informs how much negotiation room exists.
- Schools are F-rated, which usually means shorter tenancies and higher turnover. Who's the typical renter profile here, and what's been the actual vacancy rate?
- Crime grade is F in this area — have there been break-ins, vandalism, or insurance claims at this property in the last 3 years? What carrier currently insures it and at what premium?
- What's the average days-on-market for RENTAL listings here right now (not sales)? A rising rental-DOM trend means longer vacancies and softer asking-rent achievability than the comps imply.
- What's the recent tenant-quality profile in this submarket — average credit score on applications, eviction rate, late-payment / NSF rate, and stable-employment percentage? A property-management company in the area should have these aggregated.
- How much new for-sale + rental construction is in the pipeline within 1–3 miles? Heavy new supply typically softens prices + rents 12–24 months out; constrained supply supports both.
Investment metrics
- 1% rule
- 0.90% ✗
- Cap rate
- 7.85%
- Cash-on-cash
- 5.57%
- DSCR
- 1.25
- GRM
- 9.2
CMA / ARV
- ARV (on-the-fly)
- $189,532
- Comps found
- 6
Show comp detail 6 sales within ~0.75 mi
| Address | Dist | Beds/Ba | Sqft | Sold | Price | $/sf | Match |
|---|---|---|---|---|---|---|---|
| 217 Roundup Dr | 0.25mi | 4/2.0 (+1) | 2,000 (+3%) | 13mo | $188,000 | $94 | 67 |
| 312 Elk St | 0.42mi | 4/2.5 (+1) | 2,000 (+3%) | 7mo | $127,000 | $64 | 62 |
| 301 Harris St | 0.47mi | 3/2.0 | 1,971 (+2%) | 17mo | $215,500 | $109 | 61 |
| 113 Saint Charles Rd | 0.57mi | 2/2.0 (-1) | 1,883 (-3%) | 5mo | $200,000 | $106 | 60 |
| 304 W Church St | 0.37mi | 3/3.0 | 1,974 (+2%) | 24mo | $127,000 | $64 | 56 |
| 411 N Main St | 0.72mi | 2/1.5 (-1) | 1,729 (-11%) | 10mo | $170,000 | $98 | 33 |
Match score weights: distance 35% · size 25% · config 20% · recency 20%. Top-matched comps best support the ARV.
Projected returns pro-forma
-0.18% appreciation · 3.0% rent growth · sell at horizon
- IRR
- 3.4%
- Equity multiple
- 1.16×
- Total profit
- $5,651
- Equity at exit
- $35,712
- IRR
- 8.9%
- Equity multiple
- 1.95×
- Total profit
- $33,623
- Equity at exit
- $42,031
Cash invested: $35,532 (down + closing). Projections, not guarantees.
Landlord ↔ Tenant lean methodology
- Overall (STATE)
- 90 Strongly Landlord-Friendly
- State South Carolina
- 90 Strongly Landlord-Friendly · R+6
- County
- — inherits STATE
- City
- — inherits STATE
ZIP-level market 29010
- Home prices YoY
- -0.1%
- Active inventory
- 28
- Price-to-rent
- 9.2×
Monthly cashflow live
- Estimated rent
- $1,148 medium interval (Pro) →
- Mortgage (P&I)
- −$665
- Tax from tax record
- −$24 /mo · $286/yr
- Insurance
- −$53
- HOA
- −$0
- Vacancy / Maint / Mgmt
- −$241
- Net cashflow
- $165
Break-even live
UW: 25.0% down · 7.5% · 30yr · 1.5% tax · 5.0% vac · 8.0% maint · 8.0% mgmt
Financing live
Cash to close
- Down payment
- $31,725
- Closing costs
- $3,807
- Reserves months
- —
- Total cash needed
- —
Loan-product check · same deal, 3 products live
Conventional
25% down · 7.5% · 30yr
- Down + closing
- —
- Monthly P&I
- —
- Monthly cashflow
- —
- DSCR
- —
- Eligible?
- —
Personal DTI + credit; lowest rate.
DSCR
20% down · 8.5% · 30yr
- Down + closing
- —
- Monthly P&I
- —
- Monthly cashflow
- —
- DSCR
- —
- Eligible?
- —
No personal income docs; deal must DSCR.
Hard money
10% down · 12.0% · 12mo
- Down + closing
- —
- Monthly P&I
- —
- Monthly cashflow
- —
- DSCR
- —
- Eligible?
- —
Short-term bridge; refi at stabilization.
Listing history 23 events
-
2026-06-19days on market $126,900 Active 23 DOM
-
2026-06-18days on market $126,900 Active 22 DOM
-
2026-06-17days on market $126,900 Active 21 DOM
-
2026-06-16days on market $126,900 Active 20 DOM
-
2026-06-15days on market $126,900 Active 19 DOM
-
2026-06-14days on market $126,900 Active 17 DOM
-
2026-06-13days on market $126,900 Active 16 DOM
-
2026-06-10days on market $126,900 Active 14 DOM
-
2026-06-09days on market $126,900 Active 13 DOM
-
2026-06-08days on market $126,900 Active 12 DOM
-
2026-06-07days on market $126,900 Active 11 DOM
-
2026-06-05days on market $126,900 Active 8 DOM
-
2026-06-02days on market $126,900 Active 6 DOM
-
2026-06-01days on market $126,900 Active 5 DOM
-
2026-05-31days on market $126,900 Active 4 DOM
-
2026-05-30days on market $126,900 Active 3 DOM
-
2026-05-27$126,900 Active
-
2026-03-18price $134,900
-
2026-03-11price $144,900
-
2026-02-23$149,000 Active
-
2026-01-16status Active
-
2026-01-03$150,000 Active
-
2002-07-19soldstatus $79,000
ⓘ Source: listings_history table (triggers on properties + properties_extension) + one-shot
backfill from property_details.listing_events for pre-trigger history.
Tax reassessment forecast SC · Resets to sale price
- Current annual tax
- $286 · $24/mo
- Projected year-2 tax
- $723 · $60/mo
- Expected delta
- +$437/yr (+$36/mo · 153.0%)
ⓘ Screening estimate from a state-policy table — verify with the county assessor before closing.
Climate risk First Street
- Flood 1/10 Low FEMA zone X (unshaded) · 0% chance over 30 yrs
- Wildfire 3/10 Moderate
- Heat 7/10 Severe 7 d/yr ≥108°F today · 16 d/yr by 30 yrs out
- Wind 7/10 Severe 78% chance of damaging wind over 30 yrs
- Air quality 1/10 Low 0 unhealthy d/yr today · 0 by 30 yrs out
Nearby sold comps map
Loading sold comps map…
Walkable amenities ~0.75 mi
Loading nearby amenities…
Taxation est. · year 1
- Rental income
- $13,777
- − Mortgage interest
- −$7,108
- − Property taxes
- −$286
- − Insurance
- −$634
- − Repairs & maintenance
- −$1,102
- − Management
- −$1,102
- − Depreciation
- −$3,692
- Taxable loss
- −$148
- Est. tax savings @ 24.0%
- +$35
- After-tax cash flow
- $2,013/yr
For passive investors: Depreciation is non-cash, so a rental often shows a tax loss while cash-flowing — sheltering income. Rental losses are passive: they offset passive income freely, and up to $25,000/yr can offset ordinary (W-2) income if you actively participate and your MAGI is under $100k (phasing out to $0 by $150k); unused losses carry forward. On sale, claimed depreciation is recaptured at up to 25%, and gains may owe capital-gains tax (a 1031 exchange can defer both). Figures are a year-1 estimate at your 24.0% rate — not tax advice; consult a CPA.
Schools (NCES district)
- District
- Lee 01
- NCES district ID
- 4502670
- Math proficiency
- 10% ▼ -8.00%
- Reading proficiency
- 23% ▼ -1.00%
- Median HH income
- $28,700
- Composite
- 12.93/100
- National rank
- #9583
- State rank
- #78 of 80 in SC
Livability — Bishopville
- Score
- 55/100
- State rank
- #307
- US rank
- #23408
Category grades
Schools grade is shown separately in the Schools card above.
Census & demographics
- Census place
- Bishopville, SC
- Population (ZIP)
- 11,564
Population outlook (Lee County) Hauer SSP2
- Today (2025)
- 15,822 people
- By 2030
- 14,703 · -7.1%
- By 2040
- 12,434 · -21.4%
- By 2050
- 10,603 · -33.0%
- By 2075
- 8,103 · -48.8%
- By 2100
- 6,932 · -56.2%
Race, ethnicity, and origin ACS 2023
- Neighborhood character
- Majority Black (61%)
- Race & ethnicity
- Black 61% White 35% Two or more races 3% Hispanic / Latino 1%
- Common ancestry
- Serbian 2% Slovak 1%
- Foreign-born
- 2% · Canada
- Languages at home
- 96% English-only · Spanish 2%
Political lean MEDSL · Lee
- 2024 margin
- D (+17.7) · D 55.8% · R 38.1% · Other 6.1%
- 2008→2024 swing
- -13.9pp toward R · 2008: 31.5pp · 2024: 17.7pp
- All cycles
- 2024: D+17.7 2020: D+27.5 2016: D+29.4 2012: D+35.3 2008: D+31.5
Not yet ingested
- Civics
- —
Market trends
- HPI YoY
- ▼ -0.18%
- Current HPI
- 120.6432
- Rent YoY
- —
- Metro
- —
- State GDP YoY
- ▲ 4.51%
- F500 in state
- 2
Industry mix (Fortune 500 HQ in SC)
| Industry | F500 HQs | Revenue |
|---|---|---|
| Packaging | 1 | $7B |
|
||
Price history
+60.6% since first listed7 events — show timeline
- 2026-05-27 Listed $126,900 Consolidated MLS
- 2026-03-18 Price Changed $134,900 Consolidated MLS
- 2026-03-11 Price Changed $144,900 Consolidated MLS
- 2026-02-23 Listed $149,000 Consolidated MLS
- 2026-01-16 Relisted — Consolidated MLS
- 2026-01-03 Listed $150,000 Consolidated MLS
- 2002-07-19 Sold (Public Records) $79,000 Public Records
Property tax history
+2.5%/yrLatest (2025): $286 · +0.8% YoY. Source: county tax records.
Cash-flow waterfall
monthlySold comps — $/sqft
last 12 mo · ≤1 miLoading sold comps…