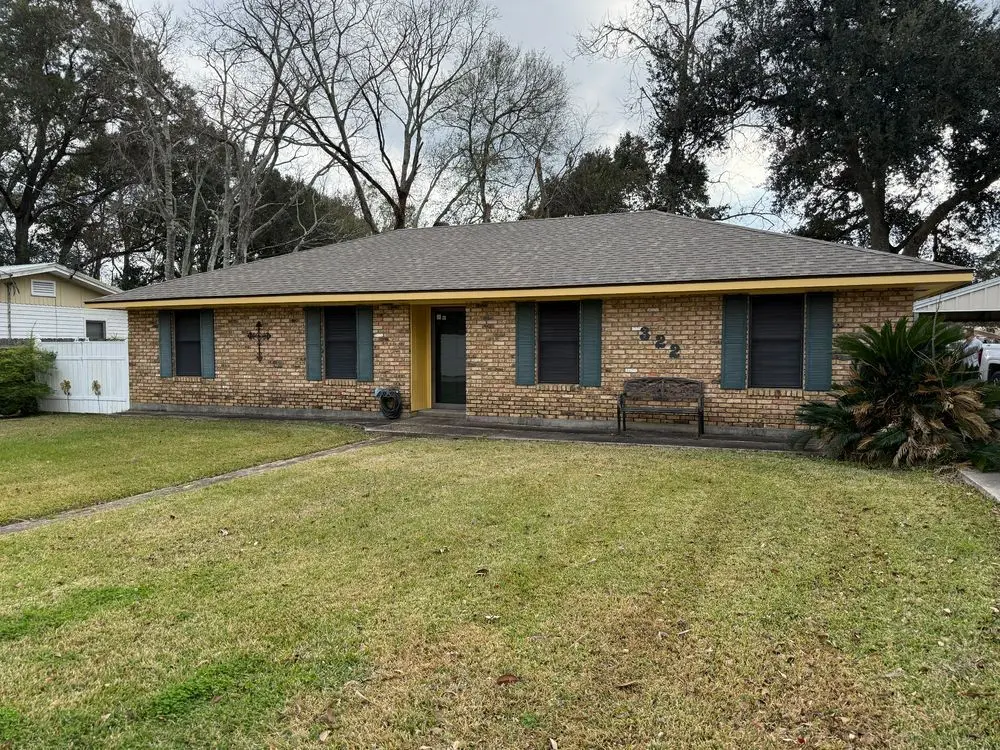
322 Crestlawn Dr · Lafayette, LA
Flood risk 1/10 · Minimal
- FEMA flood zone
- X (shaded)
- Chance of flooding over 30 yrs
- 0.0%
- Est. flood insurance / yr
- $507 – $1,088
Fire risk 3/10 · Minor
- Est. fire insurance / yr
- $1,269 – $2,357
Heat risk 8/10 · Major
- Hot days now (above 109°F)
- 7 days/yr
- Hot days in 30 yrs
- 20 days/yr
Wind risk 9/10 · Severe
- Chance of severe wind over 30 yrs
- 99.0%
Air-quality risk 1/10 · Minimal
- Unhealthy air days now
- 0 days/yr
- Unhealthy air days in 30 yrs
- 0 days/yr
Risk factors via First Street. Map © Google.
Why this score? — see what drove the B- grade
The composite is a weighted blend of 9 inputs, each scored 0–100. Each bar is that input's sub-score; the figure is the points it added to the 100-point composite (weight × sub-score).
- Cash flow +25.3/30.0
- ARV discount +15.0/15.0
- DSCR +8.4/10.0
- 1% rule +5.7/10.0
- Schools +3.6/10.0
- Livability +3.5/5.0
- Rent growth +2.6/5.0
- Condition / age +2.5/5.0
- Appreciation +0.0/10.0
$170,000
🖨 Deal sheet (PDF) 📄 Offer letter ✓ Due diligence
Listing remarks MLS
You will love this home that was built in the late 70s still has everything original! Could move in asap. Huge living room. Open floor plan. New floor throughout the house was put in 2018 Roof was replaced in 2020. Being right off of Johnston Street it is Very close to everything in Lafayette!
Key facts
- Open floor plan
- Close to everything
- New floor
Tags
Neighborhood map
What this means for you Summary
Snapshot
- This is a 3-bed/2.0-bath single-family listed at $170k.
Deal economics
- At list price, monthly cash flow is $389 ($5k/yr) — positive.
- The deal already cash-flows at list — no discount required.
- Meets the 1% rule at list price ($2k rent vs $170k).
- Recommended offer: $150k (12.0% below list) — sets the bar for market timing.
- Cap rate 9.0% vs local median 4.7% in Lafayette — top-decile yield for the area; either an underpriced asset or a hidden risk that comps aren't pricing in. Stress-test before assuming the spread holds.
Location & tenants
- Location reads 70/100 on livability (#63 in LA) — a middle-class / working-renter tenant base. Strengths: cost of living A+, housing A+, health & safety A+; Watch: amenities C-, employment C-, crime F.
- Lafayette Parish (urban): math 38% / reading 46% proficiency, ranked #19 of 98 in LA (top 19%) — families likely to look elsewhere, expect single-tenant / working-renter base with shorter leases.
- Zoned schools: J. Wallace James Elementary School (math 46% / reading 49%, grade D, #147 of 646 statewide, top 23%, 939 students, 64% FRL); Edgar Martin Middle School (math 40% / reading 53%, grade D+, #41 of 218 statewide, top 19%, 490 students, 59% FRL); Lafayette High School (math 57% / reading 51%, grade C-, #28 of 265 statewide, top 11%, 1,852 students, 52% FRL) — zoned schools at 58% FRL track the district average.
- Market conditions: Rents flat; 237 active listings in the ZIP; 23 comparable units currently listed for rent nearby; rentals at typical pace (median 23d on market — plan ~3-4 weeks tenant-placement turnaround); solid renter incomes; 1,585 units permitted in Lafayette Parish in 2024 (10 in 5+ unit buildings).
Forward outlook
- Local home prices are declining (-3.0%/yr); year-one equity from $1k of loan paydown is wiped out by about $5k of value loss. Plan a longer hold.
- Lafayette County population projected at +34% by 2050 — long-run rental-demand tailwind backs the buy-and-hold thesis.
Negotiation context
- It's been on market 164 days — a 12% lower offer ($150k) is reasonable based on typical stale-listing flexibility.
Risks & watch-outs
- Climate carrying-cost: severe wind risk, 99% chance of damaging wind over 30y; extreme-heat days projected 7→20/yr by 2055 (HVAC capex compounding) — expect insurance premiums to compound above CPI over the hold.
Questions for the listing agent
- It's been on market 164 days. Have you received any prior offers? Is the seller open to a 12% concession, seller financing, or rate buy-down credit?
- Built in 1977 — when were the roof, HVAC, electrical panel, plumbing, and water heater last replaced?
- Why hasn't it sold? Are there any deal-killer items the seller is aware of (foundation, flood, title, zoning, code violations)?
- Is there a deadline driving the sale (1031 exchange, divorce, estate, relocation)? That informs how much negotiation room exists.
- Schools are B-rated — typically a magnet for longer-tenancy family renters. What's the average tenant stay here, and is there a school-zone premium baked into asking?
- Crime grade is F in this area — have there been break-ins, vandalism, or insurance claims at this property in the last 3 years? What carrier currently insures it and at what premium?
- What's the average days-on-market for RENTAL listings here right now (not sales)? A rising rental-DOM trend means longer vacancies and softer asking-rent achievability than the comps imply.
- What's the recent tenant-quality profile in this submarket — average credit score on applications, eviction rate, late-payment / NSF rate, and stable-employment percentage? A property-management company in the area should have these aggregated.
- How much new for-sale + rental construction is in the pipeline within 1–3 miles? Heavy new supply typically softens prices + rents 12–24 months out; constrained supply supports both.
Investment metrics
- 1% rule
- 1.07% ✓
- Cap rate
- 9.04%
- Cash-on-cash
- 9.80%
- DSCR
- 1.44
- GRM
- 7.8
CMA / ARV
- ARV (median comp)
- $234,623
- List price
- $170,000
- Delta
- -27.54%
- Verdict
- UNDERPRICED
- Comps
- 20 within 1.0 mi
Show comp detail 12 sales within ~0.75 mi
| Address | Dist | Beds/Ba | Sqft | Sold | Price | $/sf | Match |
|---|---|---|---|---|---|---|---|
| 619 Canberra Rd | 0.19mi | 3/2.0 | 1,568 (+2%) | 1mo | $219,900 | $140 | 87 |
| 800 Canberra Rd | 0.38mi | 3/2.0 | 1,500 (-2%) | 1mo | $227,500 | $152 | 78 |
| 707 Canberra Rd | 0.25mi | 3/2.0 | 1,611 (+5%) | 9mo | $237,500 | $147 | 73 |
| 115 Pleasant View Dr | 0.31mi | 3/2.0 | 1,464 (-5%) | 6mo | $225,000 | $154 | 73 |
| 201 B Camino Real Rd | 0.45mi | 3/2.0 | 1,616 (+5%) | 4mo | $190,000 | $118 | 67 |
| 914 Rosedown Ln | 0.46mi | 3/2.0 | 1,651 (+8%) | 5mo | $235,000 | $142 | 62 |
| 135 Pleasant View Dr | 0.43mi | 3/2.0 | 1,686 (+10%) | 4mo | $230,000 | $136 | 60 |
| 408 Guidry Rd | 0.53mi | 3/2.0 | 1,361 (-11%) | 0mo | $167,500 | $123 | 56 |
| 209 Driftwood Dr | 0.50mi | 3/2.0 | 1,335 (-13%) | 2mo | $190,000 | $142 | 53 |
| 939 Rosedown Ln | 0.60mi | 3/2.0 | 1,697 (+11%) | 2mo | $250,000 | $147 | 53 |
| 910 Canberra Rd | 0.70mi | 2/1.5 (-1) | 1,430 (-7%) | 3mo | $200,000 | $140 | 47 |
| 903 Canberra Rd | 0.64mi | 3/2.0 | 1,752 (+14%) | 3mo | $219,000 | $125 | 44 |
Match score weights: distance 35% · size 25% · config 20% · recency 20%. Top-matched comps best support the ARV.
Projected returns pro-forma
-3.0% appreciation · 0.36% rent growth · sell at horizon
- IRR
- -4.4%
- Equity multiple
- 0.84×
- Total profit
- $-7,549
- Equity at exit
- $25,348
- IRR
- 2.2%
- Equity multiple
- 1.14×
- Total profit
- $6,789
- Equity at exit
- $14,698
Cash invested: $47,600 (down + closing). Projections, not guarantees.
Landlord ↔ Tenant lean methodology
- Overall (STATE)
- 90 Strongly Landlord-Friendly
- State Louisiana
- 90 Strongly Landlord-Friendly · R+12
- County
- — inherits STATE
- City
- — inherits STATE
ZIP-level market 70503
- Home prices YoY
- -34.0%
- Rents YoY
- 0.4%
- Active inventory
- 237
- Price-to-rent
- 7.8×
Monthly cashflow live
- Estimated rent
- $1,817 high interval (Pro) →
- Mortgage (P&I)
- −$891
- Tax from tax record
- −$84 /mo · $1,013/yr
- Insurance
- −$71
- HOA
- −$0
- Vacancy / Maint / Mgmt
- −$382
- Net cashflow
- $389
Break-even live
Sensitivity live
| Price | -10% $485 | -5% $437 | +0% $389 | +5% $341 | +10% $292 |
|---|---|---|---|---|---|
| Rent | -10% $245 | -5% $317 | +0% $389 | +5% $460 | +10% $532 |
| Rate | -1.0pp $474 | -0.5pp $432 | base $389 | +0.5pp $345 | +1.0pp $300 |
UW: 25.0% down · 7.5% · 30yr · 1.5% tax · 5.0% vac · 8.0% maint · 8.0% mgmt
Financing live
Cash to close
- Down payment
- $42,500
- Closing costs
- $5,100
- Reserves months
- —
- Total cash needed
- —
Loan-product check · same deal, 3 products live
Conventional
25% down · 7.5% · 30yr
- Down + closing
- —
- Monthly P&I
- —
- Monthly cashflow
- —
- DSCR
- —
- Eligible?
- —
Personal DTI + credit; lowest rate.
DSCR
20% down · 8.5% · 30yr
- Down + closing
- —
- Monthly P&I
- —
- Monthly cashflow
- —
- DSCR
- —
- Eligible?
- —
No personal income docs; deal must DSCR.
Hard money
10% down · 12.0% · 12mo
- Down + closing
- —
- Monthly P&I
- —
- Monthly cashflow
- —
- DSCR
- —
- Eligible?
- —
Short-term bridge; refi at stabilization.
Rent comps 23 comps
| Address | Beds | Baths | Sqft | Rent | $/sqft | DOM | Units | Dist |
|---|---|---|---|---|---|---|---|---|
| 709 Rosedown Ln Lafayette, LA | 3.0 | 2.0 | 1800 | $1,700 | $0.94 | 45d | 1 | 0.18mi |
| 110 Pilsbury Ln Lafayette, LA | 2.0 | 2.0 | 1150 | $1,595 | $1.39 | 23d | 1 | 0.60mi |
| 327 Guidry Rd Lafayette, LA | 2.0 | 2.0 | 1060 | $1,350 | $1.27 | 23d | 1 | 0.61mi |
| 1200 Robley Dr Lafayette, LA | 1.0–3.0 | 1.0–2.0 | 965 | $1,674 | $1.73 | 15d | 18 | 0.62mi |
| 330 Dunvegan Ct Lafayette, LA | 3.0 | 2.5 | 1848 | $2,400 | $1.30 | 45d | 1 | 0.64mi |
| 903 Canberra Rd Lafayette, LA | 3.0 | 2.0 | 1752 | $1,975 | $1.13 | 23d | 1 | 0.66mi |
| 104 Marblehead Ave Lafayette, LA | 2.0–3.0 | 2.0–2.5 | 1448 | $2,668 | $1.84 | 15d | 126 | 0.72mi |
| 1100 Robley Dr Lafayette, LA | 1.0–3.0 | 1.0–2.0 | 1057 | $1,802 | $1.70 | 15d | 17 | 0.73mi |
| 6000 Johnston St Lafayette, LA | 1.0–3.0 | 1.0–2.0 | 1093 | $1,740 | $1.59 | 15d | 20 | 0.76mi |
| 106 Shadow Springs Dr Lafayette, LA | 3.0 | 2.0 | 1850 | $2,295 | $1.24 | 45d | 1 | 1.14mi |
| 201 Finsbury Ln Lafayette, LA | 3.0 | 2.0 | 1730 | $2,575 | $1.49 | 23d | 1 | 1.19mi |
| 221 Wakely CT Lafayette, LA | 3.0 | 2.0 | 1659 | $1,975 | $1.19 | 15d | 1 | 1.23mi |
| 1630 Rue du Belier Lafayette, LA | 1.0–3.0 | 1.0–2.0 | 1060 | $1,600 | $1.51 | 15d | 25 | 1.26mi |
| 106 Braddish Ct Lafayette, LA | 3.0 | 2.0 | 1659 | $1,900 | $1.15 | 23d | 1 | 1.26mi |
| 130 Brightwood Dr Lafayette, LA | 3.0 | 2.0 | 1250 | $1,800 | $1.44 | 23d | 1 | 1.35mi |
| 303 Belle Grove Blvd Lafayette, LA | 3.0 | 2.0 | 1700 | $1,700 | $1.00 | 23d | 1 | 1.37mi |
| 343 Ridge Rd Lafayette, LA | 2.0–3.0 | 2.0 | 1113 | $1,995 | $1.79 | 15d | 34 | 1.40mi |
| 225 Shadowbrush Bnd Lafayette, LA | 3.0 | 2.0 | 1585 | $1,700 | $1.07 | 45d | 1 | 1.43mi |
| 115 Hermitage Ave Lafayette, LA | 3.0 | 2.0 | 2190 | $2,000 | $0.91 | 15d | 1 | 1.43mi |
| 102 Perth PL Lafayette, LA | 2.0 | 2.0 | 1150 | $1,595 | $1.39 | 23d | 1 | 1.45mi |
| 600 Glade Blvd Lafayette, LA | 3.0 | 2.0 | 1617 | $1,695 | $1.05 | 15d | 1 | 1.48mi |
| 107 Papwood Cir Lafayette, LA | 3.0 | 2.0 | 1805 | $2,000 | $1.11 | 23d | 1 | 1.48mi |
| 2339 Robley Dr Lafayette, LA | 3.0 | 2.0 | 1428 | $1,395 | $0.98 | 15d | 1 | 1.49mi |
Listing history 19 events
-
2026-06-21days on market $170,000 Active 164 DOM
-
2026-06-18days on market $170,000 Active 161 DOM
-
2026-06-17days on market $170,000 Active 160 DOM
-
2026-06-16days on market $170,000 Active 159 DOM
-
2026-06-15days on market $170,000 Active 158 DOM
-
2026-06-14days on market $170,000 Active 156 DOM
-
2026-06-13days on market $170,000 Active 155 DOM
-
2026-06-10days on market $170,000 Active 153 DOM
-
2026-06-09days on market $170,000 Active 152 DOM
-
2026-06-08days on market $170,000 Active 151 DOM
-
2026-06-07days on market $170,000 Active 150 DOM
-
2026-06-05days on market $170,000 Active 147 DOM
-
2026-06-03days on market $170,000 Active 146 DOM
-
2026-06-02days on market $170,000 Active 145 DOM
-
2026-06-01days on market $170,000 Active 144 DOM
-
2026-05-31days on market $170,000 Active 143 DOM
-
2026-05-30days on market $170,000 Active 142 DOM
-
2026-01-14price $170,000 294-char remark
Show marketing remark (294 chars)
You will love this home that was built in the late 70s still has everything original! Could move in asap. Huge living room. Open floor plan. New floor throughout the house was put in 2018 Roof was replaced in 2020. Being right off of Johnston Street it is Very close to everything in Lafayette!
-
2026-01-08$245,000 Active 294-char remark
Show marketing remark (294 chars)
You will love this home that was built in the late 70s still has everything original! Could move in asap. Huge living room. Open floor plan. New floor throughout the house was put in 2018 Roof was replaced in 2020. Being right off of Johnston Street it is Very close to everything in Lafayette!
ⓘ Source: listings_history table (triggers on properties + properties_extension) + one-shot
backfill from property_details.listing_events for pre-trigger history.
Tax reassessment forecast LA · Resets to sale price
- Current annual tax
- $1,013 · $84/mo
- Projected year-2 tax
- $1,013 · $84/mo
- Expected delta
- $0/yr ($0/mo · 0.0%)
ⓘ Screening estimate from a state-policy table — verify with the county assessor before closing.
Climate risk First Street
- Flood 1/10 Low FEMA zone X (shaded) · 0% chance over 30 yrs
- Wildfire 3/10 Moderate
- Heat 8/10 Severe 7 d/yr ≥109°F today · 20 d/yr by 30 yrs out
- Wind 9/10 Extreme 99% chance of damaging wind over 30 yrs
- Air quality 1/10 Low 0 unhealthy d/yr today · 0 by 30 yrs out
Nearby sold comps map
Loading sold comps map…
Walkable amenities ~0.75 mi
Loading nearby amenities…
Taxation est. · year 1
- Rental income
- $21,803
- − Mortgage interest
- −$9,523
- − Property taxes
- −$1,013
- − Insurance
- −$850
- − Repairs & maintenance
- −$1,744
- − Management
- −$1,744
- − Depreciation
- −$4,945
- Taxable income
- $1,984
- Est. tax owed @ 24.0%
- −$476
- After-tax cash flow
- $4,188/yr
For passive investors: Depreciation is non-cash, so a rental often shows a tax loss while cash-flowing — sheltering income. Rental losses are passive: they offset passive income freely, and up to $25,000/yr can offset ordinary (W-2) income if you actively participate and your MAGI is under $100k (phasing out to $0 by $150k); unused losses carry forward. On sale, claimed depreciation is recaptured at up to 25%, and gains may owe capital-gains tax (a 1031 exchange can defer both). Figures are a year-1 estimate at your 24.0% rate — not tax advice; consult a CPA.
Schools (NCES district)
- District
- Lafayette Parish
- NCES district ID
- 2200870
- Math proficiency
- 38% ▼ -32.00%
- Reading proficiency
- 46% ▼ -24.00%
- Median HH income
- $50,238
- Composite
- 36.15/100
- National rank
- #4741
- State rank
- #19 of 98 in LA
Livability — Lafayette
- Score
- 70/100
- State rank
- #63
- US rank
- #8133
Category grades
Schools grade is shown separately in the Schools card above.
Census & demographics
- Census place
- Lafayette, LA
- County
- Lafayette Parish · 207,544 people
- City population
- 158,114
- Metro
- Lafayette, LA
- Population (ZIP)
- 28,643
- Household income
- $94,688
- Rent vs Own
- Severe rent burden
- 769.0
Population outlook (Lafayette County) Hauer SSP2
- Today (2025)
- 280,930 people
- By 2030
- 301,092 · +7.2%
- By 2040
- 339,456 · +20.8%
- By 2050
- 375,156 · +33.5%
- By 2075
- 451,672 · +60.8%
- By 2100
- 497,203 · +77.0%
Race, ethnicity, and origin ACS 2023
- Neighborhood character
- Predominantly White (74%)
- Race & ethnicity
- White 74% Black 10% Hispanic / Latino 8% Two or more races 6% Asian 3%
- Hispanic origin (detail)
- Mexican 3%
- Common ancestry
- Lithuanian 23% Slovak 2% Italian 2%
- Foreign-born
- 6% · Canada, Vietnam, China
- Languages at home
- 88% English-only · Spanish 5% French/Haitian/Cajun 3% Other Indo-European 1%
Political lean MEDSL · Lafayette
- 2024 margin
- Solid R (+31.4) · D 33.5% · R 64.8% · Other 1.7%
- 2008→2024 swing
- -0.1pp no change · 2008: -31.3pp · 2024: -31.4pp
- All cycles
- 2024: R+31.4 2020: R+28.7 2016: R+33.6 2012: R+33.7 2008: R+31.3
Not yet ingested
- Civics
- —
Market trends
- HPI YoY
- ▼ -81.65%
- Current HPI
- 158.7094
- Rent YoY
- ▲ 0.36%
- Metro
- Lafayette, LA
- State GDP YoY
- ▲ 3.29%
- F500 in state
- 10
Industry mix (Fortune 500 HQ in LA)
| Industry | F500 HQs | Revenue |
|---|---|---|
| Telecommunications | 2 | $23B |
|
||
| Utilities | 1 | $12B |
|
||
| Wholesale / Distribution | 1 | $5B |
|
||
| Advertising | 1 | $2B |
|
||
Price history
-30.6% since first listed2 events — show timeline
- 2026-01-14 Price Changed $170,000 ForSaleByOwner.com
- 2026-01-08 Listed $245,000 ForSaleByOwner.com
Property tax history
+30.4%/yrLatest (2025): $1,013 · -1.1% YoY. Source: county tax records.
Cash-flow waterfall
monthlySold comps — $/sqft
last 12 mo · ≤1 miLoading sold comps…