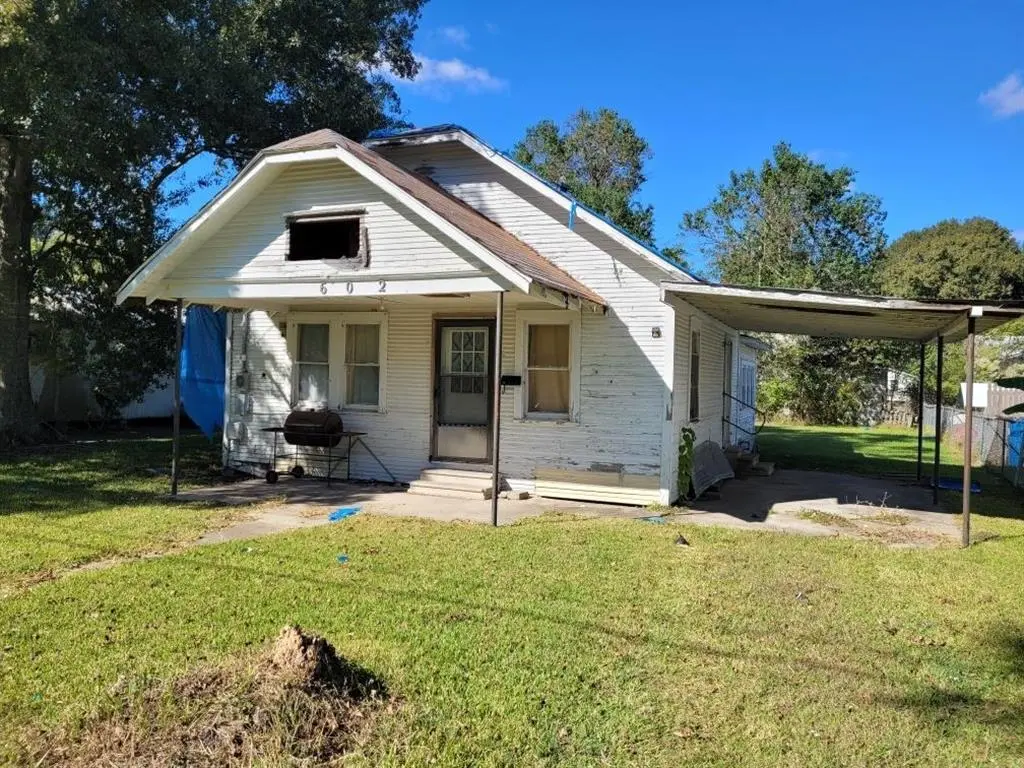
602 Mckinley · Jennings, LA
Flood risk 1/10 · Minimal
- FEMA flood zone
- X (unshaded)
- Chance of flooding over 30 yrs
- 0.0%
- Est. flood insurance / yr
- $507 – $1,088
Fire risk 1/10 · Minimal
- Est. fire insurance / yr
- $1,269 – $2,357
Heat risk 9/10 · Severe
- Hot days now (above 110°F)
- 7 days/yr
- Hot days in 30 yrs
- 21 days/yr
Wind risk 9/10 · Severe
- Chance of severe wind over 30 yrs
- 99.0%
Air-quality risk 1/10 · Minimal
- Unhealthy air days now
- 0 days/yr
- Unhealthy air days in 30 yrs
- 0 days/yr
Risk factors via First Street. Map © Google.
Why this score? — see what drove the B- grade
The composite is a weighted blend of 9 inputs, each scored 0–100. Each bar is that input's sub-score; the figure is the points it added to the 100-point composite (weight × sub-score).
- Cash flow +30.0/30.0
- 1% rule +10.0/10.0
- DSCR +10.0/10.0
- ARV discount +7.5/15.0
- Livability +3.1/5.0
- Schools +3.0/10.0
- Rent growth +2.5/5.0
- Condition / age +2.5/5.0
- Appreciation +0.0/10.0
$28,900
🖨 Deal sheet 📄 Offer letter ✓ Due diligence
Listing remarks
This home offers solid bones and tons of potential, this property is ready for your personal touch and updates to make it truly your own. The large yard provides privacy and space for additional structures or recreational use. This could be a great flip, rental, or forever home project.
Key facts
- Recreational use
- Large yard
- 1 acre lot
Tags
Neighborhood map
What this means for you Summary
Snapshot
- This is a 3-bed/1.0-bath single-family listed at $29k.
Deal economics
- At list price, monthly cash flow is $656 ($8k/yr) — positive.
- The deal already cash-flows at list — no discount required.
- Meets the 1% rule at list price ($1k rent vs $29k).
- Recommended offer: $28k (1.5% below list) — sets the bar for market timing.
- Cap rate 33.5% vs local median 6.2% in Jennings — top-decile yield for the area; either an underpriced asset or a hidden risk that comps aren't pricing in. Stress-test before assuming the spread holds.
Location & tenants
- Location reads 61/100 on livability (#228 in LA) — a middle-class / working-renter tenant base. Strengths: cost of living A+, health & safety A+, housing B; Watch: crime F, amenities F, commute F.
- Jefferson Davis Parish (town): math 30% / reading 42% proficiency, ranked #33 of 98 in LA (top 34%) — families likely to look elsewhere, expect single-tenant / working-renter base with shorter leases.
- Market conditions: 119 active listings in the ZIP; 69 units permitted in Jefferson Davis Parish in 2024 (0 in 5+ unit buildings).
Forward outlook
- Local home prices are declining (-3.0%/yr); year-one equity from $200 of loan paydown is wiped out by about $867 of value loss. Plan a longer hold.
- Jefferson Davis County population projected to shrink 8% by 2050 — rents likely to lag national; underwrite the cash flow, not the appreciation.
- At projected returns (-3.0% appreciation + 3.0% rent growth), your $8k cash investment doubles in ~2 years — after that, you're playing with house money.
Negotiation context
- It's been on market 28 days — a 2% lower offer ($28k) is reasonable based on typical stale-listing flexibility.
Risks & watch-outs
- Climate carrying-cost: severe wind risk, 99% chance of damaging wind over 30y; extreme-heat days projected 7→21/yr by 2055 (HVAC capex compounding) — expect insurance premiums to compound above CPI over the hold.
Questions for the listing agent
- Is there a deadline driving the sale (1031 exchange, divorce, estate, relocation)? That informs how much negotiation room exists.
- Crime grade is F in this area — have there been break-ins, vandalism, or insurance claims at this property in the last 3 years? What carrier currently insures it and at what premium?
- What's the average days-on-market for RENTAL listings here right now (not sales)? A rising rental-DOM trend means longer vacancies and softer asking-rent achievability than the comps imply.
- What's the recent tenant-quality profile in this submarket — average credit score on applications, eviction rate, late-payment / NSF rate, and stable-employment percentage? A property-management company in the area should have these aggregated.
- How much new for-sale + rental construction is in the pipeline within 1–3 miles? Heavy new supply typically softens prices + rents 12–24 months out; constrained supply supports both.
Investment metrics
- 1% rule
- 3.78% ✓
- Cap rate
- 33.51%
- Cash-on-cash
- 97.21%
- DSCR
- 5.33
- GRM
- 2.2
CMA / ARV
- ARV (median comp)
- $95,845
- List price
- $28,900
- Delta
- -66.72%
- Verdict
- UNDERPRICED
- Comps
- 15 within 1.0 mi
Show comp detail 3 sales within ~0.75 mi
| Address | Dist | Beds/Ba | Sqft | Sold | Price | $/sf | Match |
|---|---|---|---|---|---|---|---|
| 302 Clara St | 0.63mi | 2/1.0 (-1) | 1,000 (0%) | 7mo | $115,000 | $115 | 60 |
| 519 Zigler St | 0.68mi | 3/1.0 | 1,025 (+2%) | 10mo | $67,500 | $66 | 56 |
| 423 Davis St | 0.70mi | 2/1.0 (-1) | 1,000 (0%) | 23mo | $75,000 | $75 | 43 |
Match score weights: distance 35% · size 25% · config 20% · recency 20%. Top-matched comps best support the ARV.
Projected returns pro-forma
-3.0% appreciation · 3.0% rent growth · sell at horizon
- IRR
- 98.2%
- Equity multiple
- 5.58×
- Total profit
- $37,090
- Equity at exit
- $4,309
- IRR
- —
- Equity multiple
- 11.65×
- Total profit
- $86,146
- Equity at exit
- $2,499
Cash invested: $8,092 (down + closing). Projections, not guarantees.
Landlord ↔ Tenant lean methodology
- Overall (STATE)
- 90 Strongly Landlord-Friendly
- State Louisiana
- 90 Strongly Landlord-Friendly · R+12
- County
- — inherits STATE
- City
- — inherits STATE
ZIP-level market 70546
- Home prices YoY
- -31.7%
- Active inventory
- 119
- Price-to-rent
- 2.2×
Monthly cashflow live
- Estimated rent
- $1,093 medium interval (Pro) →
- Mortgage (P&I)
- −$152
- Tax from tax record
- −$44 /mo · $531/yr
- Insurance
- −$12
- HOA
- −$0
- Vacancy / Maint / Mgmt
- −$230
- Net cashflow
- $656
Break-even live
UW: 25.0% down · 7.5% · 30yr · 1.5% tax · 5.0% vac · 8.0% maint · 8.0% mgmt
Financing live
Cash to close
- Down payment
- $7,225
- Closing costs
- $867
- Reserves months
- —
- Total cash needed
- —
Loan-product check · same deal, 3 products live
Conventional
25% down · 7.5% · 30yr
- Down + closing
- —
- Monthly P&I
- —
- Monthly cashflow
- —
- DSCR
- —
- Eligible?
- —
Personal DTI + credit; lowest rate.
DSCR
20% down · 8.5% · 30yr
- Down + closing
- —
- Monthly P&I
- —
- Monthly cashflow
- —
- DSCR
- —
- Eligible?
- —
No personal income docs; deal must DSCR.
Hard money
10% down · 12.0% · 12mo
- Down + closing
- —
- Monthly P&I
- —
- Monthly cashflow
- —
- DSCR
- —
- Eligible?
- —
Short-term bridge; refi at stabilization.
Listing history 15 events
-
2026-06-19days on market $28,900 Active 28 DOM
-
2026-06-18days on market $28,900 Active 27 DOM
-
2026-06-17days on market $28,900 Active 26 DOM
-
2026-06-16days on market $28,900 Active 25 DOM
-
2026-06-15days on market $28,900 Active 24 DOM
-
2026-06-14days on market $28,900 Active 22 DOM
-
2026-06-13days on market $28,900 Active 21 DOM
-
2026-06-10days on market $28,900 Active 19 DOM
-
2026-06-09days on market $28,900 Active 18 DOM
-
2026-06-08days on market $28,900 Active 17 DOM
-
2026-06-07days on market $28,900 Active 16 DOM
-
2026-06-02days on market $28,900 Active 11 DOM
-
2026-06-01days on market $28,900 Active 10 DOM
-
2026-05-31days on market $28,900 Active 9 DOM
-
2026-05-30days on market $28,900 Active 8 DOM
ⓘ Source: listings_history table (triggers on properties + properties_extension) + one-shot
backfill from property_details.listing_events for pre-trigger history.
Tax reassessment forecast LA · Resets to sale price
- Current annual tax
- $531 · $44/mo
- Projected year-2 tax
- $531 · $44/mo
- Expected delta
- $0/yr ($0/mo · 0.0%)
ⓘ Screening estimate from a state-policy table — verify with the county assessor before closing.
Climate risk First Street
- Flood 1/10 Low FEMA zone X (unshaded) · 0% chance over 30 yrs
- Wildfire 1/10 Low
- Heat 9/10 Extreme 7 d/yr ≥110°F today · 21 d/yr by 30 yrs out
- Wind 9/10 Extreme 99% chance of damaging wind over 30 yrs
- Air quality 1/10 Low 0 unhealthy d/yr today · 0 by 30 yrs out
Nearby sold comps map
Loading sold comps map…
Walkable amenities ~0.75 mi
Loading nearby amenities…
Taxation est. · year 1
- Rental income
- $13,115
- − Mortgage interest
- −$1,619
- − Property taxes
- −$531
- − Insurance
- −$144
- − Repairs & maintenance
- −$1,049
- − Management
- −$1,049
- − Depreciation
- −$841
- Taxable income
- $7,881
- Est. tax owed @ 24.0%
- −$1,892
- After-tax cash flow
- $5,975/yr
For passive investors: Depreciation is non-cash, so a rental often shows a tax loss while cash-flowing — sheltering income. Rental losses are passive: they offset passive income freely, and up to $25,000/yr can offset ordinary (W-2) income if you actively participate and your MAGI is under $100k (phasing out to $0 by $150k); unused losses carry forward. On sale, claimed depreciation is recaptured at up to 25%, and gains may owe capital-gains tax (a 1031 exchange can defer both). Figures are a year-1 estimate at your 24.0% rate — not tax advice; consult a CPA.
Schools (NCES district)
- District
- Jefferson Davis Parish
- NCES district ID
- 2200810
- Math proficiency
- 30% ▼ -39.00%
- Reading proficiency
- 42% ▼ -33.00%
- Median HH income
- $40,322
- Composite
- 30.21/100
- National rank
- #6302
- State rank
- #33 of 98 in LA
Livability — Jennings
- Score
- 61/100
- State rank
- #228
- US rank
- #17390
Category grades
Schools grade is shown separately in the Schools card above.
Census & demographics
- Census place
- Jennings, LA
- Population (ZIP)
- 15,821
Population outlook (Jefferson Davis County) Hauer SSP2
- Today (2025)
- 31,015 people
- By 2030
- 30,563 · -1.5%
- By 2040
- 29,639 · -4.4%
- By 2050
- 28,456 · -8.3%
- By 2075
- 25,521 · -17.7%
- By 2100
- 21,787 · -29.8%
Race, ethnicity, and origin ACS 2023
- Neighborhood character
- Predominantly White (76%)
- Race & ethnicity
- White 76% Black 15% Two or more races 8% Hispanic / Latino 3%
- Common ancestry
- Lithuanian 14% Italian 1% Slovak 1%
- Foreign-born
- 1% · Canada, Vietnam
- Languages at home
- 92% English-only · French/Haitian/Cajun 6% Spanish 2%
Political lean MEDSL · Jefferson Davis
- 2024 margin
- Solid R (+61.1) · D 18.8% · R 79.9% · Other 1.3%
- 2008→2024 swing
- -21.5pp toward R · 2008: -39.7pp · 2024: -61.1pp
- All cycles
- 2024: R+61.1 2020: R+55.4 2016: R+53.9 2012: R+47.6 2008: R+39.7
Not yet ingested
- Civics
- —
Market trends
- HPI YoY
- ▼ -68.56%
- Current HPI
- 147.6391
- Rent YoY
- —
- Metro
- —
- State GDP YoY
- ▲ 3.29%
- F500 in state
- 10
Industry mix (Fortune 500 HQ in LA)
| Industry | F500 HQs | Revenue |
|---|---|---|
| Telecommunications | 2 | $23B |
|
||
| Utilities | 1 | $12B |
|
||
| Wholesale / Distribution | 1 | $5B |
|
||
| Advertising | 1 | $2B |
|
||
Property tax history
+4.1%/yrLatest (2025): $531 · +0.3% YoY. Source: county tax records.
Cash-flow waterfall
monthlySold comps — $/sqft
last 12 mo · ≤1 miLoading sold comps…