 🏷️ Likely Rental
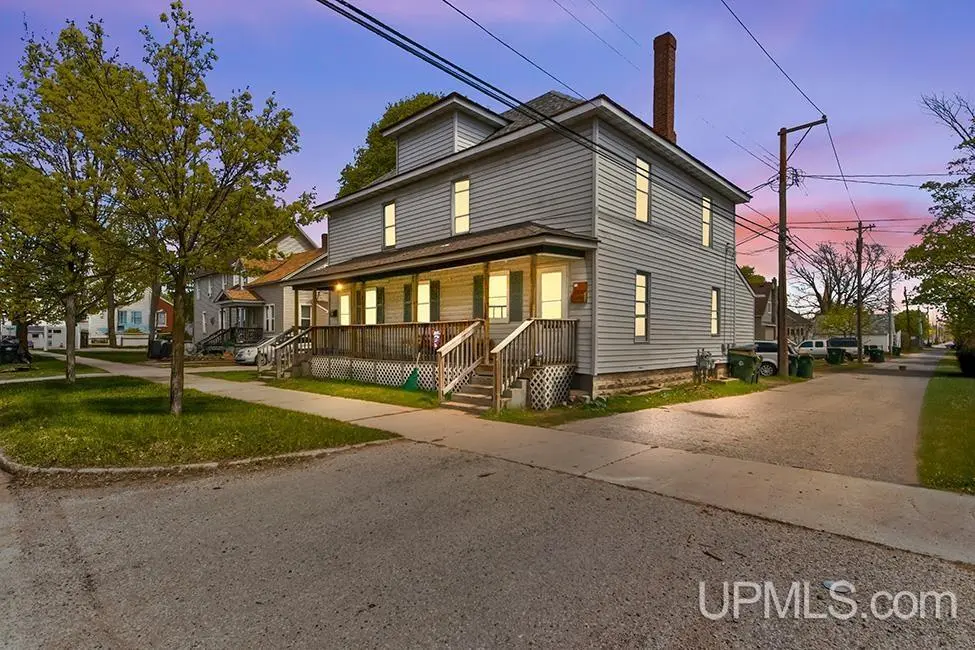
211 S 14th St · Escanaba, MI
Flood risk No data
- FEMA flood zone
- —
- Chance of flooding over 30 yrs
- —
- Est. flood insurance / yr
- —
Fire risk No data
- Est. fire insurance / yr
- —
Heat risk No data
- Hot days now (above threshold)
- —
- Hot days in 30 yrs
- —
Wind risk No data
- Chance of severe wind over 30 yrs
- —
Air-quality risk No data
- Unhealthy air days now
- —
- Unhealthy air days in 30 yrs
- —
Risk factors via First Street. Map © Google.
Why this score? — see what drove the B grade
The composite is a weighted blend of 9 inputs, each scored 0–100. Each bar is that input's sub-score; the figure is the points it added to the 100-point composite (weight × sub-score).
- Cash flow +25.9/30.0
- ARV discount +15.0/15.0
- DSCR +8.7/10.0
- 1% rule +6.2/10.0
- Appreciation +5.0/10.0
- Livability +3.8/5.0
- Schools +3.2/10.0
- Rent growth +2.5/5.0
- Condition / age +2.5/5.0
$120,000
🖨 Deal sheet 📄 Offer letter ✓ Due diligence
Listing remarks MLS
Excellent investment opportunity in the heart of Escanaba! This spacious side-by-side duplex offers approximately 2,296 square feet with mirrored layouts designed for comfortable living and strong rental appeal. Each unit features three bedrooms and one full bathroom upstairs, while the main level hosts a welcoming living room, dining area, and kitchen. Separate private front and rear entrances provide added convenience and privacy for tenants. Each unit also includes access to its own half of the basement with dedicated laundry and storage space. Utilities are separately metered for ease of ownership and management. One unit is currently rented for $1,000 per month, while the second unit has recently received a facelift and is vacant, offering an excellent opportunity for owner occupancy or immediate rental income potential. A fantastic opportunity to expand your portfolio or live in one unit while the other helps offset your mortgage!
Key facts
- Side by side duplex
- Mirrored layouts
- 4,356 sq ft lot
Tags
Property features AI
Finance
- Financial info: Two-unit building with both units generating rent ($1,000 each); Month-to-month leases; pets allowed
- HOA & community: Association/landlord pays taxes
Exterior
- Parking: On-street parking
- Utilities: Public water; Public sanitary sewer; Natural gas connected; Electricity connected; Cable available; Separate heat/electric/water/gas for units
- Home design: Multi-family property (1 to 4 units), investment opportunity; Conventional frame construction; 2-story
- Construction: Vinyl siding; Basement foundation; Built in 1900; Shingle roof not specified
- Exterior features: Porch; Sidewalks
Interior
- Kitchen: Range/oven; Refrigerator
- Bedrooms: Multiple bedrooms located on the second floor; Primary/other bedroom(s) with concrete floor covering
- Flooring: Concrete flooring in at least one bedroom
- Bathrooms: 2 full bathrooms
- Heating & cooling: Forced air heating; No central cooling
- Interior features: Living room; Formal dining room; Basement present (full, stone)
- Laundry & utility: Basement utility space; Gas water heater
Neighborhood map
What this means for you Summary
Snapshot
- This is a 4-bed/2.0-bath single-family listed at $120k.
Deal economics
- At list price, monthly cash flow is $297 ($4k/yr) — positive.
- The deal already cash-flows at list — no discount required.
- Meets the 1% rule at list price ($1k rent vs $120k).
- Cap rate 9.3% vs local median 4.9% in Escanaba — top-decile yield for the area; either an underpriced asset or a hidden risk that comps aren't pricing in. Stress-test before assuming the spread holds.
Location & tenants
- Location reads 75/100 on livability (#161 in MI, #4,089 nationally) — a middle-class / working-renter tenant base. Strengths: amenities A+, cost of living A+, housing A+; Watch: crime D+, commute F, employment F.
- Escanaba Area Public Schools (town): math 31% / reading 46% proficiency, ranked #243 of 540 in MI (top 45%) — families likely to look elsewhere, expect single-tenant / working-renter base with shorter leases.
- Market conditions: 1 active listings in the ZIP; 38 units permitted in Delta County in 2024 (0 in 5+ unit buildings).
Forward outlook
- In year one you build about $4k of equity ($830 loan paydown + $4k appreciation (3.0% local appreciation)).
- Delta County population projected at -22% by 2050 — secular population decline; favor cash flow + early exit over multi-decade hold.
- At projected returns (3.0% appreciation + 3.0% rent growth), your $34k cash investment doubles in ~4 years — after that, you're playing with house money.
- By year 8, paydown + projected appreciation supports a ~$33k cash-out refi (75% LTV) — recoverable capital for the next deal without selling this one.
Negotiation context
- Only 10 days on market — expect competitive offers; lowballing is unlikely to land.
- 2 sale attempts with the ask held roughly flat each time — persistent listings suggest the price (not the market) is what's stuck; bring a comps-based counter.
- Current owner paid $30k; list at $120k implies a 300% gain — meaningful room to come down on a strong offer.
Risks & watch-outs
- Watch-outs: built in 1900 — expect roof / HVAC / electrical / plumbing capex.
Questions for the listing agent
- Built in 1900 — when were the roof, HVAC, electrical panel, plumbing, and water heater last replaced?
- Is there a deadline driving the sale (1031 exchange, divorce, estate, relocation)? That informs how much negotiation room exists.
- Schools are B-rated — typically a magnet for longer-tenancy family renters. What's the average tenant stay here, and is there a school-zone premium baked into asking?
- Crime grade is D in this area — have there been break-ins, vandalism, or insurance claims at this property in the last 3 years? What carrier currently insures it and at what premium?
- What's the average days-on-market for RENTAL listings here right now (not sales)? A rising rental-DOM trend means longer vacancies and softer asking-rent achievability than the comps imply.
- What's the recent tenant-quality profile in this submarket — average credit score on applications, eviction rate, late-payment / NSF rate, and stable-employment percentage? A property-management company in the area should have these aggregated.
- How much new for-sale + rental construction is in the pipeline within 1–3 miles? Heavy new supply typically softens prices + rents 12–24 months out; constrained supply supports both.
Investment metrics
- 1% rule
- 1.12% ✓
- Cap rate
- 9.26%
- Cash-on-cash
- 10.59%
- DSCR
- 1.47
- GRM
- 7.5
CMA / ARV
- ARV (on-the-fly)
- $188,272
- Comps found
- 11
Show comp detail 11 sales within ~0.75 mi
| Address | Dist | Beds/Ba | Sqft | Sold | Price | $/sf | Match |
|---|---|---|---|---|---|---|---|
| 408 S 14th St | 0.34mi | 4/2.0 | 2,056 (-10%) | 6mo | $225,000 | $109 | 62 |
| 330 S 12th St | 0.30mi | 4/1.5 | 1,995 (-13%) | 1mo | $155,000 | $78 | 62 |
| 1620 S 1st Ave | 0.23mi | 5/2.5 (+1) | 2,460 (+7%) | 17mo | $62,000 | $25 | 56 |
| 705 S 10th St | 0.69mi | 4/2.5 | 2,455 (+7%) | 0mo | $208,000 | $85 | 54 |
| 307 S 17th St | 0.30mi | 4/1.5 | 2,015 (-12%) | 15mo | $165,000 | $82 | 51 |
| 518 S 11th St | 0.52mi | 4/2.0 | 2,154 (-6%) | 20mo | $171,500 | $80 | 49 |
| 1725 S 1st Ave | 0.27mi | 4/1.0 | 1,999 (-13%) | 18mo | $168,000 | $84 | 47 |
| 325 S 17th St | 0.35mi | 5/2.0 (+1) | 2,107 (-8%) | 24mo | $162,500 | $77 | 45 |
| 328 S 7th St | 0.59mi | 4/1.5 | 1,990 (-13%) | 7mo | $325,000 | $163 | 43 |
| 624 S 16th St | 0.55mi | 3/2.5 (-1) | 2,004 (-13%) | 5mo | $180,000 | $90 | 42 |
| 626 S 12th St | 0.55mi | 5/1.0 (+1) | 2,224 (-3%) | 22mo | $47,000 | $21 | 42 |
Match score weights: distance 35% · size 25% · config 20% · recency 20%. Top-matched comps best support the ARV.
Projected returns pro-forma
3.0% appreciation · 3.0% rent growth · sell at horizon
- IRR
- 17.4%
- Equity multiple
- 1.99×
- Total profit
- $33,324
- Equity at exit
- $53,957
- IRR
- 18.8%
- Equity multiple
- 3.74×
- Total profit
- $92,147
- Equity at exit
- $83,154
Cash invested: $33,600 (down + closing). Projections, not guarantees.
Landlord ↔ Tenant lean methodology
- Overall (STATE)
- 62 Landlord-Friendly
- State Michigan
- 62 Landlord-Friendly · EVEN
- County
- — inherits STATE
- City
- — inherits STATE
ZIP-level market 49289
- Active inventory
- 1
- Price-to-rent
- 7.5×
Monthly cashflow live
- Estimated rent
- $1,339 medium interval (Pro) →
- Mortgage (P&I)
- −$629
- Tax from tax record
- −$82 /mo · $988/yr
- Insurance
- −$50
- HOA
- −$0
- Vacancy / Maint / Mgmt
- −$281
- Net cashflow
- $297
Break-even live
UW: 25.0% down · 7.5% · 30yr · 1.5% tax · 5.0% vac · 8.0% maint · 8.0% mgmt
Financing live
Cash to close
- Down payment
- $30,000
- Closing costs
- $3,600
- Reserves months
- —
- Total cash needed
- —
Loan-product check · same deal, 3 products live
Conventional
25% down · 7.5% · 30yr
- Down + closing
- —
- Monthly P&I
- —
- Monthly cashflow
- —
- DSCR
- —
- Eligible?
- —
Personal DTI + credit; lowest rate.
DSCR
20% down · 8.5% · 30yr
- Down + closing
- —
- Monthly P&I
- —
- Monthly cashflow
- —
- DSCR
- —
- Eligible?
- —
No personal income docs; deal must DSCR.
Hard money
10% down · 12.0% · 12mo
- Down + closing
- —
- Monthly P&I
- —
- Monthly cashflow
- —
- DSCR
- —
- Eligible?
- —
Short-term bridge; refi at stabilization.
Listing history 10 events
-
2026-06-07statusdays on market $120,000 Pending 10 DOM
-
2026-06-04days on market $120,000 Active 7 DOM
-
2026-06-02days on market $120,000 Active 6 DOM
-
2026-06-01days on market $120,000 Active 5 DOM
-
2026-05-31days on market $120,000 Active 4 DOM
-
2026-05-31days on market $120,000 Active 3 DOM
-
2026-05-28$120,000 Active 950-char remark
Show marketing remark (950 chars)
Excellent investment opportunity in the heart of Escanaba! This spacious side-by-side duplex offers approximately 2,296 square feet with mirrored layouts designed for comfortable living and strong rental appeal. Each unit features three bedrooms and one full bathroom upstairs, while the main level hosts a welcoming living room, dining area, and kitchen. Separate private front and rear entrances provide added convenience and privacy for tenants. Each unit also includes access to its own half of the basement with dedicated laundry and storage space. Utilities are separately metered for ease of ownership and management. One unit is currently rented for $1,000 per month, while the second unit has recently received a facelift and is vacant, offering an excellent opportunity for owner occupancy or immediate rental income potential. A fantastic opportunity to expand your portfolio or live in one unit while the other helps offset your mortgage!
-
2026-05-26$120,000 Active 950-char remark
Show marketing remark (950 chars)
Excellent investment opportunity in the heart of Escanaba! This spacious side-by-side duplex offers approximately 2,296 square feet with mirrored layouts designed for comfortable living and strong rental appeal. Each unit features three bedrooms and one full bathroom upstairs, while the main level hosts a welcoming living room, dining area, and kitchen. Separate private front and rear entrances provide added convenience and privacy for tenants. Each unit also includes access to its own half of the basement with dedicated laundry and storage space. Utilities are separately metered for ease of ownership and management. One unit is currently rented for $1,000 per month, while the second unit has recently received a facelift and is vacant, offering an excellent opportunity for owner occupancy or immediate rental income potential. A fantastic opportunity to expand your portfolio or live in one unit while the other helps offset your mortgage!
-
2018-02-01soldstatus $30,000
-
2004-03-31soldstatus $48,000
ⓘ Source: listings_history table (triggers on properties + properties_extension) + one-shot
backfill from property_details.listing_events for pre-trigger history.
Tax reassessment forecast MI · Partial reset (capped growth)
- Current annual tax
- $988 · $82/mo
- Projected year-2 tax
- $1,418 · $118/mo
- Expected delta
- +$430/yr (+$36/mo · 43.6%)
ⓘ Screening estimate from a state-policy table — verify with the county assessor before closing.
Nearby sold comps map
Loading sold comps map…
Walkable amenities ~0.75 mi
Loading nearby amenities…
Taxation est. · year 1
- Rental income
- $16,074
- − Mortgage interest
- −$6,722
- − Property taxes
- −$988
- − Insurance
- −$600
- − Repairs & maintenance
- −$1,286
- − Management
- −$1,286
- − Depreciation
- −$3,491
- Taxable income
- $1,701
- Est. tax owed @ 24.0%
- −$408
- After-tax cash flow
- $3,151/yr
For passive investors: Depreciation is non-cash, so a rental often shows a tax loss while cash-flowing — sheltering income. Rental losses are passive: they offset passive income freely, and up to $25,000/yr can offset ordinary (W-2) income if you actively participate and your MAGI is under $100k (phasing out to $0 by $150k); unused losses carry forward. On sale, claimed depreciation is recaptured at up to 25%, and gains may owe capital-gains tax (a 1031 exchange can defer both). Figures are a year-1 estimate at your 24.0% rate — not tax advice; consult a CPA.
Schools (NCES district)
- District
- Escanaba Area Public Schools
- NCES district ID
- 2613500
- Math proficiency
- 31% ▼ -8.00%
- Reading proficiency
- 46% ▼ -1.00%
- Median HH income
- $37,187
- Composite
- 31.97/100
- National rank
- #5841
- State rank
- #243 of 540 in MI
Livability — Escanaba
- Score
- 75/100
- State rank
- #161
- US rank
- #4089
Category grades
Schools grade is shown separately in the Schools card above.
Census & demographics
- Census place
- Escanaba, MI
- Population (ZIP)
- 68
Population outlook (Delta County) Hauer SSP2
- Today (2025)
- 34,431 people
- By 2030
- 33,003 · -4.1%
- By 2040
- 29,748 · -13.6%
- By 2050
- 26,753 · -22.3%
- By 2075
- 20,962 · -39.1%
- By 2100
- 15,616 · -54.6%
Race, ethnicity, and origin ACS 2023
- Neighborhood character
- Majority White (65%)
- Race & ethnicity
- White 65% Hispanic / Latino 24% Two or more races 7% Black 4%
- Hispanic origin (detail)
- Mexican 24%
- Common ancestry
- Slovak 6%
- Foreign-born
- 6% · Canada
- Languages at home
- 88% English-only · Spanish 12%
Political lean MEDSL · Delta
- 2024 margin
- Solid R (+30.4) · D 34.1% · R 64.5% · Other 1.4%
- 2008→2024 swing
- -36.7pp toward R · 2008: 6.3pp · 2024: -30.4pp
- All cycles
- 2024: R+30.4 2020: R+26.5 2016: R+25.4 2012: R+6.7 2008: D+6.3
Not yet ingested
- Civics
- —
Market trends
- HPI YoY
- —
- Current HPI
- —
- Rent YoY
- —
- Metro
- —
- State GDP YoY
- ▲ 1.37%
- F500 in state
- 28
Industry mix (Fortune 500 HQ in MI)
| Industry | F500 HQs | Revenue |
|---|---|---|
| Automotive Parts | 3 | $48B |
|
||
| Automotive | 2 | $372B |
|
||
| Chemicals | 1 | $45B |
|
||
| Automotive Retail | 1 | $29B |
|
||
| Healthcare / Medical Devices | 1 | $23B |
|
||
| Automotive Technology | 1 | $20B |
|
||
Price history
+150.0% since first listed4 events — show timeline
- 2026-05-28 Listed $120,000 UPAR
- 2026-05-26 Listed $120,000 MiRealSource-MiMLS
- 2018-02-01 Sold (Public Records) $30,000 Public Records
- 2004-03-31 Sold (Public Records) $48,000 Public Records
Property tax history
-2.6%/yrLatest (2025): $988 · -45.8% YoY. Source: county tax records.
Cash-flow waterfall
monthlySold comps — $/sqft
last 12 mo · ≤1 miLoading sold comps…