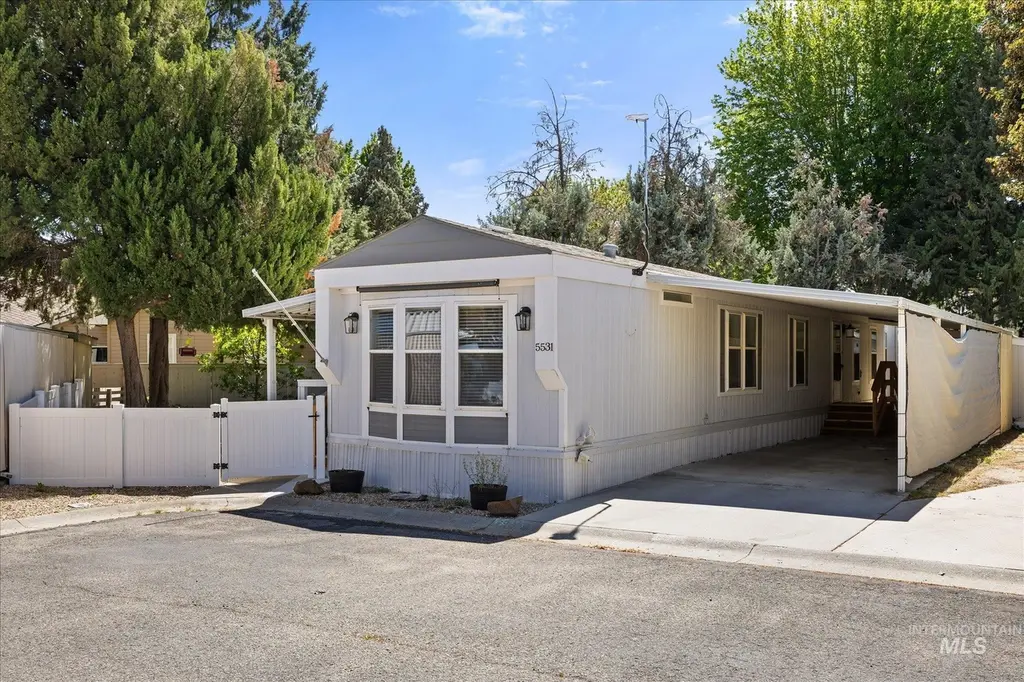
5531 N Sudley Ln · Garden City, ID
Flood risk No data
- FEMA flood zone
- —
- Chance of flooding over 30 yrs
- —
- Est. flood insurance / yr
- —
Fire risk No data
- Est. fire insurance / yr
- —
Heat risk No data
- Hot days now (above threshold)
- —
- Hot days in 30 yrs
- —
Wind risk No data
- Chance of severe wind over 30 yrs
- —
Air-quality risk No data
- Unhealthy air days now
- —
- Unhealthy air days in 30 yrs
- —
Risk factors via First Street. Map © Google.
Why this score? — see what drove the B grade
The composite is a weighted blend of 9 inputs, each scored 0–100. Each bar is that input's sub-score; the figure is the points it added to the 100-point composite (weight × sub-score).
- Cash flow +30.0/30.0
- DSCR +10.0/10.0
- 1% rule +9.3/10.0
- ARV discount +7.5/15.0
- Schools +4.2/10.0
- Livability +4.1/5.0
- Condition / age +4.0/5.0
- Rent growth +3.7/5.0
- Appreciation +0.0/10.0
$115,000
🖨 Deal sheet 📄 Offer letter ✓ Due diligence
Listing remarks
Tastefully remodeled home located in the quiet, and well maintained Shenandoah Estates 55+ gated community. This home features a stunning kitchen, fully updated with stainless steel appliances, granite countertops, deep pantry cupboard, elegant tile backsplash, and a custom artistic metal accent behind the oven. The never ending island includes bar seating and a secondary prep sink, perfect for entertaining. The spacious primary suite offers a dual vanity, solid surface walk-in shower, and convenient stackable washer and dryer. Luxury plank flooring flows throughout for easy living & a fresh contemporary look. Enjoy outdoor living with a covered porch, fully fenced and landscaped yard
Key facts
- Deep pantry cupboard
- Stunning kitchen
- Granite countertops
Tags
Property features AI
Finance
- HOA & community: Gated community; Located in a mobile home park with rented lots; Senior (55+) community
Exterior
- Parking: Carport (covered) with 2 spaces
- Security: Gated community
- Utilities: City water service; Sewer connected
- Home design: Mobile/manufactured home on a rented lot; Located in an over-55 community; Gated community; Built in 1994
- Construction: Architectural-style roof; Year built 1994
- Exterior features: Full vinyl and wood fencing; Covered patio/deck; Garden; Automatic sprinkler system with full coverage; Private paved road frontage; Community in-ground pool
Interior
- Kitchen: Kitchen island; Granite counters; Breakfast bar; Dishwasher; Disposal; Microwave; Freestanding oven/range
- Bedrooms: 2 bedrooms, both on the main level
- Bathrooms: 2 bathrooms
- Heating & cooling: Electric forced-air heating; Central air conditioning
- Interior features: Bath in the master bedroom; Master bedroom on main level; Split bedroom layout; Great room; Double vanity; Breakfast bar; Kitchen island; Granite counters
- Laundry & utility: Washer; Dryer; Utility room on main level; Tank water heater
Neighborhood map
What this means for you Summary
Snapshot
- This is a 2-bed/2.0-bath manufactured listed at $115k. Condition is rated good.
Deal economics
- At list price, monthly cash flow is $505 ($6k/yr) — positive.
- The deal already cash-flows at list — no discount required.
- Meets the 1% rule at list price ($2k rent vs $115k).
- Recommended offer: $112k (3.0% below list) — sets the bar for market timing.
- Cap rate 11.6% vs local median 2.5% in Garden City — top-decile yield for the area; either an underpriced asset or a hidden risk that comps aren't pricing in. Stress-test before assuming the spread holds.
Location & tenants
- Location reads 82/100 on livability (#11 in ID, #1,264 nationally) — a professional / high-income tenant draw. Strengths: commute A+, health & safety A+, housing A; Watch: crime F.
- Boise Independent District (urban): math 42% / reading 56% proficiency, ranked #36 of 92 in ID (top 39%) — families likely to look elsewhere, expect single-tenant / working-renter base with shorter leases.
- Zoned schools: Shadow Hills Elementary (math 33% / reading 46%, grade F, #234 of 357 statewide, top 69%, 445 students, 24% FRL); Capital Senior High School (math 34% / reading 57%, grade D-, #59 of 169 statewide, top 35%, 1,220 students, 28% FRL).
- Market conditions: Rents rising fast (+4.9%/yr); 445 active listings in the ZIP; 13 comparable units currently listed for rent nearby; rentals at typical pace (median 15d on market — plan ~3-4 weeks tenant-placement turnaround); solid renter incomes; 5,129 units permitted in Ada County in 2024 (414 in 5+ unit buildings).
Forward outlook
- Local home prices are declining (-3.0%/yr); year-one equity from $795 of loan paydown is wiped out by about $3k of value loss. Plan a longer hold.
- Ada County population projected at +45% by 2050 — long-run rental-demand tailwind backs the buy-and-hold thesis.
- At projected returns (-3.0% appreciation + 4.9% rent growth), your $32k cash investment doubles in ~6 years — after that, you're playing with house money.
Negotiation context
- It's been on market 33 days — a 3% lower offer ($112k) is reasonable based on typical stale-listing flexibility.
Questions for the listing agent
- It's been on market 33 days. Have you received any prior offers? Is the seller open to a 3% concession, seller financing, or rate buy-down credit?
- Is there a deadline driving the sale (1031 exchange, divorce, estate, relocation)? That informs how much negotiation room exists.
- Crime grade is F in this area — have there been break-ins, vandalism, or insurance claims at this property in the last 3 years? What carrier currently insures it and at what premium?
- What's the average days-on-market for RENTAL listings here right now (not sales)? A rising rental-DOM trend means longer vacancies and softer asking-rent achievability than the comps imply.
- What's the recent tenant-quality profile in this submarket — average credit score on applications, eviction rate, late-payment / NSF rate, and stable-employment percentage? A property-management company in the area should have these aggregated.
- How much new for-sale + rental construction is in the pipeline within 1–3 miles? Heavy new supply typically softens prices + rents 12–24 months out; constrained supply supports both.
Investment metrics
- 1% rule
- 1.43% ✓
- Cap rate
- 11.56%
- Cash-on-cash
- 18.81%
- DSCR
- 1.84
- GRM
- 5.8
CMA / ARV
- ARV (on-the-fly)
- $62,846
- Comps found
- 12
Show comp detail 12 sales within ~0.75 mi
| Address | Dist | Beds/Ba | Sqft | Sold | Price | $/sf | Match |
|---|---|---|---|---|---|---|---|
| 5637 Fairfax Ln | 0.03mi | 2/1.0 | 924 (-2%) | 1mo | $124,900 | $135 | 91 |
| 7837 W Manassas | 0.14mi | 2/2.0 | 924 (-2%) | 10mo | $50,000 | $54 | 83 |
| 7973 Manassas | 0.08mi | 2/1.0 | 924 (-2%) | 9mo | $134,900 | $146 | 82 |
| 5262 N North Glen Ln #43 | 0.70mi | 2/1.0 | 938 (0%) | 0mo | $75,000 | $80 | 63 |
| 7015 W Royal Glen Ln | 0.60mi | 2/1.5 | 972 (+4%) | 1mo | $15,000 | $15 | 63 |
| 6955 Royal Glen Ln | 0.64mi | 3/2.0 (+1) | 924 (-2%) | 9mo | $67,500 | $73 | 56 |
| 6990 W Royal Glen Ln | 0.61mi | 2/1.0 | 938 (0%) | 15mo | $44,900 | $48 | 55 |
| 5432 N Glencrest Ln | 0.68mi | 2/1.0 | 938 (0%) | 21mo | $30,000 | $32 | 47 |
| 5285 N Glen | 0.70mi | 2/1.0 | 840 (-10%) | 2mo | $49,900 | $59 | 44 |
| 7008 Royal Glen Ln | 0.60mi | 2/2.0 | 840 (-10%) | 20mo | $89,500 | $107 | 38 |
| 6971 Garden Glen Ln | 0.62mi | 2/2.0 | 1,056 (+13%) | 18mo | $69,500 | $66 | 35 |
| 5504 Glencrest Ln | 0.67mi | 2/2.0 | 1,044 (+11%) | 18mo | $69,900 | $67 | 35 |
Match score weights: distance 35% · size 25% · config 20% · recency 20%. Top-matched comps best support the ARV.
Projected returns pro-forma
-3.0% appreciation · 4.87% rent growth · sell at horizon
- IRR
- 12.7%
- Equity multiple
- 1.52×
- Total profit
- $16,691
- Equity at exit
- $17,147
- IRR
- 23.1%
- Equity multiple
- 3.16×
- Total profit
- $69,471
- Equity at exit
- $9,943
Cash invested: $32,200 (down + closing). Projections, not guarantees.
Landlord ↔ Tenant lean methodology
- Overall (STATE)
- 91 Strongly Landlord-Friendly
- State Idaho
- 91 Strongly Landlord-Friendly · R+18
- County
- — inherits STATE
- City
- — inherits STATE
ZIP-level market 83714
- Home prices YoY
- -31.5%
- Rents YoY
- 4.9%
- Active inventory
- 445
- Price-to-rent
- 5.8×
Monthly cashflow live
- Estimated rent
- $1,645 high interval (Pro) →
- Mortgage (P&I)
- −$603
- Tax est. 1.5%
- −$144 /mo · $1,725/yr
- Insurance
- −$48
- HOA
- −$0
- Vacancy / Maint / Mgmt
- −$345
- Net cashflow
- $505
Break-even live
UW: 25.0% down · 7.5% · 30yr · 1.5% tax · 5.0% vac · 8.0% maint · 8.0% mgmt
Financing live
Cash to close
- Down payment
- $28,750
- Closing costs
- $3,450
- Reserves months
- —
- Total cash needed
- —
Loan-product check · same deal, 3 products live
Conventional
25% down · 7.5% · 30yr
- Down + closing
- —
- Monthly P&I
- —
- Monthly cashflow
- —
- DSCR
- —
- Eligible?
- —
Personal DTI + credit; lowest rate.
DSCR
20% down · 8.5% · 30yr
- Down + closing
- —
- Monthly P&I
- —
- Monthly cashflow
- —
- DSCR
- —
- Eligible?
- —
No personal income docs; deal must DSCR.
Hard money
10% down · 12.0% · 12mo
- Down + closing
- —
- Monthly P&I
- —
- Monthly cashflow
- —
- DSCR
- —
- Eligible?
- —
Short-term bridge; refi at stabilization.
Rent comps 13 comps
| Address | Beds | Baths | Sqft | Rent | $/sqft | DOM | Units | Dist |
|---|---|---|---|---|---|---|---|---|
| 7570 W State St Boise, ID | 1.0–4.0 | 1.0–2.5 | 1236 | $1,817 | $1.47 | 2d | 21 | 0.31mi |
| 8255 W Limelight St Boise, ID | 1.0 | 1.0 | 724 | $1,545 | $2.13 | 2d | 3 | 0.32mi |
| 6200 N River Pointe Ln Garden City, ID | 1.0–3.0 | 1.0–2.0 | 1000 | $2,416 | $2.42 | 2d | 8 | 0.70mi |
| 5497 N Pierce Park Ln Boise, ID | 2.0 | 1.5 | 880 | $1,445 | $1.64 | 2d | 3 | 0.89mi |
| 5497 N Pierce Park Ln Unit 79-202 Boise, ID | 2.0 | 1.5 | 880 | $1,395 | $1.59 | 14d | 1 | 0.89mi |
| 5497 N Pierce Park Ln Unit 53-101 Boise, ID | 2.0 | 1.5 | 880 | $1,495 | $1.70 | 14d | 1 | 0.89mi |
| 6589 W Lucky Ln Boise, ID | 2.0 | 2.0 | 1025 | $1,450 | $1.41 | 19d | 1 | 0.96mi |
| 59515953 N Pierce Park Ln Unit 5951 Boise, ID | 2.0 | 1.0 | 850 | $1,450 | $1.71 | 3d | 1 | 0.99mi |
| 6474 W Lucky Ln Unit 12202 Boise, ID | 2.0 | 2.0 | 1100 | $1,500 | $1.36 | 23d | 1 | 1.05mi |
| 4807 N Fortune Ln Unit 201 Boise, ID | 2.0 | 2.0 | 925 | $1,245 | $1.35 | 14d | 1 | 1.06mi |
| 6103 W State St Unit 6103-10 Garden City, ID | 1.0 | 1.0 | 580 | $1,150 | $1.98 | 23d | 1 | 1.42mi |
| 6103 W State St Unit 6103-12 Boise, ID | 2.0 | 1.0 | 825 | $1,350 | $1.64 | 23d | 1 | 1.42mi |
| 6043 W Port Pl Unit 104 Boise, ID | 2.0 | 2.0 | 950 | $1,345 | $1.42 | 3d | 1 | 1.45mi |
Listing history 14 events
-
2026-06-17days on market $115,000 Active 33 DOM
-
2026-06-16days on market $115,000 Active 32 DOM
-
2026-06-15days on market $115,000 Active 31 DOM
-
2026-06-13days on market $115,000 Active 29 DOM
-
2026-06-10days on market $115,000 Active 26 DOM
-
2026-06-09days on market $115,000 Active 25 DOM
-
2026-06-08days on market $115,000 Active 24 DOM
-
2026-06-07days on market $115,000 Active 23 DOM
-
2026-06-05days on market $115,000 Active 20 DOM
-
2026-06-03days on market $115,000 Active 19 DOM
-
2026-06-03status $115,000 Active 18 DOM
-
2026-06-01status $115,000 Pending 18 DOM
-
2026-05-31days on market $115,000 Active 18 DOM
-
2026-05-13$115,000 Active
ⓘ Source: listings_history table (triggers on properties + properties_extension) + one-shot
backfill from property_details.listing_events for pre-trigger history.
Nearby sold comps map
Loading sold comps map…
Walkable amenities ~0.75 mi
Loading nearby amenities…
Taxation est. · year 1
- Rental income
- $19,739
- − Mortgage interest
- −$6,442
- − Property taxes
- −$1,725
- − Insurance
- −$575
- − Repairs & maintenance
- −$1,579
- − Management
- −$1,579
- − Depreciation
- −$3,345
- Taxable income
- $4,494
- Est. tax owed @ 24.0%
- −$1,078
- After-tax cash flow
- $4,979/yr
For passive investors: Depreciation is non-cash, so a rental often shows a tax loss while cash-flowing — sheltering income. Rental losses are passive: they offset passive income freely, and up to $25,000/yr can offset ordinary (W-2) income if you actively participate and your MAGI is under $100k (phasing out to $0 by $150k); unused losses carry forward. On sale, claimed depreciation is recaptured at up to 25%, and gains may owe capital-gains tax (a 1031 exchange can defer both). Figures are a year-1 estimate at your 24.0% rate — not tax advice; consult a CPA.
Condition & rehab AI · 30 photos
This tastefully remodeled home in Shenandoah Estates offers a good condition with updated kitchens and bathrooms, and a well-maintained exterior. It is ready for a new owner and can be further enhanced with minor updates.
Value-add opportunities
- Both Painting the exterior and interior walls — Fresh paint can enhance curb appeal and interior aesthetics
- Both Landscaping improvements — Enhances curb appeal and adds value
- Resale Upgrading the kitchen appliances — Modern appliances can attract more buyers
- Resale Upgrading the bathroom fixtures — Modern fixtures can attract more buyers
Renovation cost estimate screening
Value-add ROI direction
- Both Painting the exterior and interior walls — Fresh paint can enhance curb appeal and interior aesthetics ↑
- Both Landscaping improvements — Enhances curb appeal and adds value ↑
- Resale Upgrading the kitchen appliances — Modern appliances can attract more buyers ↑
- Resale Upgrading the bathroom fixtures — Modern fixtures can attract more buyers ↑
ⓘ Cost ranges are severity-bucket heuristics (US national rule-of-thumb). Get contractor quotes + a written scope before underwriting a rehab budget.
Schools (NCES district)
- District
- Boise Independent District
- NCES district ID
- 1600360
- Math proficiency
- 42% ▼ -5.00%
- Reading proficiency
- 56% ▼ -1.00%
- Median HH income
- $49,135
- Composite
- 41.82/100
- National rank
- #3388
- State rank
- #36 of 92 in ID
Livability — Garden City
- Score
- 82/100
- State rank
- #11
- US rank
- #1264
Category grades
Schools grade is shown separately in the Schools card above.
Census & demographics
- Census place
- Garden City, ID
- County
- Ada County · 522,161 people
- Metro
- Boise City, ID
- Population (ZIP)
- 27,564
- Household income
- $87,651
- Rent vs Own
- Severe rent burden
- 557.0
Population outlook (Ada County) Hauer SSP2
- Today (2025)
- 535,818 people
- By 2030
- 585,751 · +9.3%
- By 2040
- 682,435 · +27.4%
- By 2050
- 775,818 · +44.8%
- By 2075
- 994,458 · +85.6%
- By 2100
- 1,148,884 · +114.4%
Race, ethnicity, and origin ACS 2023
- Neighborhood character
- Predominantly White (86%)
- Race & ethnicity
- White 86% Hispanic / Latino 9% Two or more races 7%
- Hispanic origin (detail)
- Mexican 7%
- Common ancestry
- Italian 4% Slovak 4% Portuguese 4%
- Foreign-born
- 5% · Canada
- Languages at home
- 92% English-only · Spanish 5% Russian/Polish/Slavic 2% Other Indo-European 1%
Political lean MEDSL · Ada
- 2024 margin
- R (+10.3) · D 43.4% · R 53.8% · Other 2.8%
- 2008→2024 swing
- -4.2pp toward R · 2008: -6.2pp · 2024: -10.3pp
- All cycles
- 2024: R+10.3 2020: R+3.9 2016: R+9.2 2012: R+11.3 2008: R+6.2
Not yet ingested
- Civics
- —
Market trends
- HPI YoY
- ▼ -155.87%
- Current HPI
- 339.0701
- Rent YoY
- ▲ 4.87%
- Metro
- Boise City, ID
- State GDP YoY
- ▲ 4.51%
- F500 in state
- 6
Industry mix (Fortune 500 HQ in ID)
| Industry | F500 HQs | Revenue |
|---|---|---|
| Retail | 1 | $79B |
|
||
| Technology | 1 | $25B |
|
||
| Food / Agriculture | 1 | $6B |
|
||
Price history
1 event — show timeline
- 2026-05-13 Listed $115,000 IMLS
Cash-flow waterfall
monthlySold comps — $/sqft
last 12 mo · ≤1 miLoading sold comps…