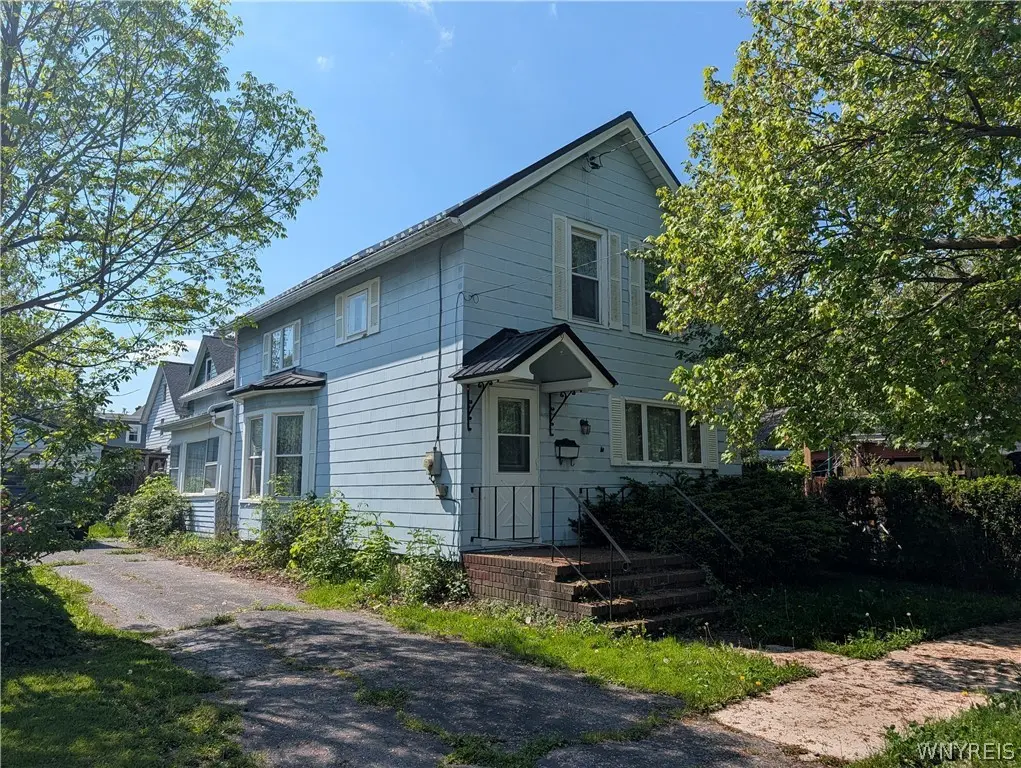
9 E Pine St · Dunkirk, NY
Flood risk 1/10 · Minimal
- FEMA flood zone
- X
- Chance of flooding over 30 yrs
- 0.0%
- Est. flood insurance / yr
- $473 – $860
Fire risk 1/10 · Minimal
- Est. fire insurance / yr
- $691 – $1,283
Heat risk 2/10 · Minimal
- Hot days now (above 94°F)
- 7 days/yr
- Hot days in 30 yrs
- 16 days/yr
Wind risk 1/10 · Minimal
- Chance of severe wind over 30 yrs
- —
Air-quality risk 2/10 · Minimal
- Unhealthy air days now
- 2 days/yr
- Unhealthy air days in 30 yrs
- 2 days/yr
Risk factors via First Street. Map © Google.
Why this score? — see what drove the B+ grade
The composite is a weighted blend of 9 inputs, each scored 0–100. Each bar is that input's sub-score; the figure is the points it added to the 100-point composite (weight × sub-score).
- Cash flow +30.0/30.0
- 1% rule +10.0/10.0
- DSCR +10.0/10.0
- ARV discount +7.5/15.0
- Appreciation +7.5/10.0
- Livability +3.5/5.0
- Schools +2.7/10.0
- Rent growth +2.5/5.0
- Condition / age +2.5/5.0
$45,000
🖨 Deal sheet 📄 Offer letter ✓ Due diligence
Listing remarks
This opportunity filled property in Dunkirk is ready for its next chapter! Featuring a metal roof on both the house and garage, this home offers a great starting point for investors, rehab loan buyers, or anyone looking to bring their vision to life. Spacious layout with plenty of potential throughout. Property is being sold as is and contents currently in the home will remain. Whether you are looking for your next project, rental property, or value add opportunity, this one is worth a look. Showings begin immediately and offers will be reviewed as they come in.
Key facts
- Metal roof
- Spacious layout
- 3,920 sq ft lot
Tags
Property features AI
Exterior
- Parking: Detached 2-car garage
- Utilities: Electricity connected; Public water connected; Sewer connected
- Home design: 2-story home; Existing property condition
- Construction: Aluminum siding; Metal roof; Stone foundation
- Exterior features: Blacktop driveway; Rectangular residential lot; City street frontage; Lot dimensions approximately 42 x 99
Interior
- Kitchen: Built-in refrigerator; Gas oven; Gas range
- Bedrooms: One bedroom on the main level
- Flooring: Carpet; Varies
- Bathrooms: Two full bathrooms; One main-level bathroom
- Heating & cooling: Gas forced-air heating
- Interior features: Entrance foyer; Eat-in kitchen; Separate/formal living room
- Laundry & utility: Washer; Dryer; Gas water heater
Neighborhood map
What this means for you Summary
Snapshot
- This is a 3-bed/2.0-bath single-family listed at $45k.
Deal economics
- At list price, monthly cash flow is $532 ($6k/yr) — positive.
- The deal already cash-flows at list — no discount required.
- Meets the 1% rule at list price ($1k rent vs $45k).
- Cap rate 20.5% vs local median 7.4% in Dunkirk — top-decile yield for the area; either an underpriced asset or a hidden risk that comps aren't pricing in. Stress-test before assuming the spread holds.
Location & tenants
- Location reads 70/100 on livability (#426 in NY) — a middle-class / working-renter tenant base. Strengths: cost of living A+, housing A+, health & safety A+; Watch: schools C-, amenities F, commute F.
- Dunkirk City School District (town): math 30% / reading 34% proficiency, ranked #575 of 590 in NY (top 98%) — families likely to look elsewhere, expect single-tenant / working-renter base with shorter leases; 65% free/reduced lunch — lower-income household profile, screen leases tightly.
- Market conditions: 70 active listings in the ZIP; 127 units permitted in Chautauqua County in 2024 (0 in 5+ unit buildings).
Forward outlook
- In year one you build about $3k of equity ($311 loan paydown + $2k appreciation (4.9% local appreciation)).
- Chautauqua County population projected at -22% by 2050 — secular population decline; favor cash flow + early exit over multi-decade hold.
- At projected returns (4.9% appreciation + 3.0% rent growth), your $13k cash investment doubles in ~2 years — after that, you're playing with house money.
Negotiation context
- Only 4 days on market — expect competitive offers; lowballing is unlikely to land.
Risks & watch-outs
- Watch-outs: property tax is 4.3% of price; built in 1932 — expect roof / HVAC / electrical / plumbing capex.
Questions for the listing agent
- Built in 1932 — when were the roof, HVAC, electrical panel, plumbing, and water heater last replaced?
- Property tax is high relative to price — has the assessment been appealed recently, and will the sale trigger a re-assessment?
- Is there a deadline driving the sale (1031 exchange, divorce, estate, relocation)? That informs how much negotiation room exists.
- What's the average days-on-market for RENTAL listings here right now (not sales)? A rising rental-DOM trend means longer vacancies and softer asking-rent achievability than the comps imply.
- What's the recent tenant-quality profile in this submarket — average credit score on applications, eviction rate, late-payment / NSF rate, and stable-employment percentage? A property-management company in the area should have these aggregated.
- How much new for-sale + rental construction is in the pipeline within 1–3 miles? Heavy new supply typically softens prices + rents 12–24 months out; constrained supply supports both.
Investment metrics
- 1% rule
- 2.66% ✓
- Cap rate
- 20.47%
- Cash-on-cash
- 50.64%
- DSCR
- 3.25
- GRM
- 3.1
CMA / ARV
- ARV (on-the-fly)
- $147,844
- Comps found
- 7
Show comp detail 7 sales within ~0.75 mi
| Address | Dist | Beds/Ba | Sqft | Sold | Price | $/sf | Match |
|---|---|---|---|---|---|---|---|
| 13 N Gazelle St | 0.08mi | 4/1.0 (+1) | 1,601 (-0%) | 14mo | $56,000 | $35 | 75 |
| 14 N Beagle St | 0.08mi | 4/1.0 (+1) | 1,731 (+8%) | 6mo | $37,500 | $22 | 69 |
| 140 S Martin St | 0.45mi | 3/1.5 | 1,468 (-9%) | 2mo | $135,000 | $92 | 61 |
| 79 N Ocelot St | 0.47mi | 4/1.5 (+1) | 1,678 (+4%) | 4mo | $270,000 | $161 | 60 |
| 309 Lake Shore Dr E | 0.42mi | 4/1.5 (+1) | 1,593 (-1%) | 23mo | $125,000 | $78 | 53 |
| 120 S Ocelot St | 0.49mi | 2/2.0 (-1) | 1,377 (-14%) | 3mo | $164,900 | $120 | 46 |
| 130 S Pangolin St | 0.35mi | 4/2.0 (+1) | 1,379 (-14%) | 23mo | $182,500 | $132 | 36 |
Match score weights: distance 35% · size 25% · config 20% · recency 20%. Top-matched comps best support the ARV.
Projected returns pro-forma
4.93% appreciation · 3.0% rent growth · sell at horizon
- IRR
- 58.2%
- Equity multiple
- 4.50×
- Total profit
- $44,141
- Equity at exit
- $25,312
- IRR
- 56.0%
- Equity multiple
- 9.29×
- Total profit
- $104,409
- Equity at exit
- $43,529
Cash invested: $12,600 (down + closing). Projections, not guarantees.
Landlord ↔ Tenant lean methodology
- Overall (STATE)
- 15 Strongly Tenant-Friendly
- State New York
- 15 Strongly Tenant-Friendly · D+10
- County
- — inherits STATE
- City
- — inherits STATE
ZIP-level market 14048
- Home prices YoY
- 1.5%
- Active inventory
- 70
- Price-to-rent
- 3.1×
Monthly cashflow live
- Estimated rent
- $1,197 medium interval (Pro) →
- Mortgage (P&I)
- −$236
- Tax from tax record
- −$159 /mo · $1,913/yr
- Insurance
- −$19
- HOA
- −$0
- Vacancy / Maint / Mgmt
- −$251
- Net cashflow
- $532
Break-even live
UW: 25.0% down · 7.5% · 30yr · 1.5% tax · 5.0% vac · 8.0% maint · 8.0% mgmt
Financing live
Cash to close
- Down payment
- $11,250
- Closing costs
- $1,350
- Reserves months
- —
- Total cash needed
- —
Loan-product check · same deal, 3 products live
Conventional
25% down · 7.5% · 30yr
- Down + closing
- —
- Monthly P&I
- —
- Monthly cashflow
- —
- DSCR
- —
- Eligible?
- —
Personal DTI + credit; lowest rate.
DSCR
20% down · 8.5% · 30yr
- Down + closing
- —
- Monthly P&I
- —
- Monthly cashflow
- —
- DSCR
- —
- Eligible?
- —
No personal income docs; deal must DSCR.
Hard money
10% down · 12.0% · 12mo
- Down + closing
- —
- Monthly P&I
- —
- Monthly cashflow
- —
- DSCR
- —
- Eligible?
- —
Short-term bridge; refi at stabilization.
Listing history 3 events
-
2026-05-31status $45,000 Pending 4 DOM
-
2026-05-31days on market $45,000 Active 4 DOM
-
2026-05-27$45,000 Active
ⓘ Source: listings_history table (triggers on properties + properties_extension) + one-shot
backfill from property_details.listing_events for pre-trigger history.
Tax reassessment forecast NY · Partial reset (capped growth)
- Current annual tax
- $1,913 · $159/mo
- Projected year-2 tax
- $1,913 · $159/mo
- Expected delta
- $0/yr ($0/mo · 0.0%)
ⓘ Screening estimate from a state-policy table — verify with the county assessor before closing.
Climate risk First Street
- Flood 1/10 Low FEMA zone X · 0% chance over 30 yrs
- Wildfire 1/10 Low
- Heat 2/10 Low 7 d/yr ≥94°F today · 16 d/yr by 30 yrs out
- Wind 1/10 Low
- Air quality 2/10 Low 2 unhealthy d/yr today · 2 by 30 yrs out
Nearby sold comps map
Loading sold comps map…
Walkable amenities ~0.75 mi
Loading nearby amenities…
Taxation est. · year 1
- Rental income
- $14,368
- − Mortgage interest
- −$2,521
- − Property taxes
- −$1,913
- − Insurance
- −$225
- − Repairs & maintenance
- −$1,149
- − Management
- −$1,149
- − Depreciation
- −$1,309
- Taxable income
- $6,101
- Est. tax owed @ 24.0%
- −$1,464
- After-tax cash flow
- $4,916/yr
For passive investors: Depreciation is non-cash, so a rental often shows a tax loss while cash-flowing — sheltering income. Rental losses are passive: they offset passive income freely, and up to $25,000/yr can offset ordinary (W-2) income if you actively participate and your MAGI is under $100k (phasing out to $0 by $150k); unused losses carry forward. On sale, claimed depreciation is recaptured at up to 25%, and gains may owe capital-gains tax (a 1031 exchange can defer both). Figures are a year-1 estimate at your 24.0% rate — not tax advice; consult a CPA.
Schools (NCES district)
- District
- Dunkirk City School District
- NCES district ID
- 3609420
- Math proficiency
- 30% ▼ -11.00%
- Reading proficiency
- 34% ▬ 0.00%
- Median HH income
- $36,345
- Composite
- 26.55/100
- National rank
- #7190
- State rank
- #575 of 590 in NY
Livability — Dunkirk
- Score
- 70/100
- State rank
- #426
- US rank
- #7421
Category grades
Schools grade is shown separately in the Schools card above.
Census & demographics
- Census place
- Dunkirk, NY
- City population
- 14,949
- Population (ZIP)
- 14,949
Population outlook (Chautauqua County) Hauer SSP2
- Today (2025)
- 123,454 people
- By 2030
- 118,509 · -4.0%
- By 2040
- 107,311 · -13.1%
- By 2050
- 96,703 · -21.7%
- By 2075
- 76,757 · -37.8%
- By 2100
- 60,984 · -50.6%
Race, ethnicity, and origin ACS 2023
- Neighborhood character
- Majority White (63%)
- Race & ethnicity
- White 63% Hispanic / Latino 30% Two or more races 12% Black 3%
- Hispanic origin (detail)
- Mexican 2% Puerto Rican 25% Dominican 1%
- Common ancestry
- Romanian 20% Lithuanian 3% Iranian 1%
- Foreign-born
- 3% · Canada
- Languages at home
- 80% English-only · Spanish 18% Other Indo-European 1%
Political lean MEDSL · Chautauqua
- 2024 margin
- Strong R (+22.0) · D 39.0% · R 61.0%
- 2008→2024 swing
- -22.9pp toward R · 2008: 0.9pp · 2024: -22.0pp
- All cycles
- 2024: R+22.0 2020: R+19.8 2016: R+24.6 2012: R+8.2 2008: D+0.9
Not yet ingested
- Civics
- —
Market trends
- HPI YoY
- ▲ 4.93%
- Current HPI
- 325.9188
- Rent YoY
- —
- Metro
- —
- State GDP YoY
- ▲ 2.60%
- F500 in state
- 92
Industry mix (Fortune 500 HQ in NY)
| Industry | F500 HQs | Revenue |
|---|---|---|
| Financial Services | 10 | $950B |
|
||
| Consumer Goods | 9 | $162B |
|
||
| Insurance | 4 | $225B |
|
||
| Telecommunications | 2 | $144B |
|
||
| Pharmaceuticals | 2 | $112B |
|
||
| Media / Entertainment | 2 | $69B |
|
||
Price history
1 event — show timeline
- 2026-05-27 Listed $45,000 WNYREIS
Property tax history
+9.7%/yrLatest (2025): $1,913 · +3.3% YoY. Source: county tax records.
Cash-flow waterfall
monthlySold comps — $/sqft
last 12 mo · ≤1 miLoading sold comps…