8831 Highway 70 Unit M · Marysville, CA
Flood risk No data
- FEMA flood zone
- —
- Chance of flooding over 30 yrs
- —
- Est. flood insurance / yr
- —
Fire risk No data
- Est. fire insurance / yr
- —
Heat risk No data
- Hot days now (above threshold)
- —
- Hot days in 30 yrs
- —
Wind risk No data
- Chance of severe wind over 30 yrs
- —
Air-quality risk No data
- Unhealthy air days now
- —
- Unhealthy air days in 30 yrs
- —
Risk factors via First Street. Map © Google.
Why this score? — see what drove the B- grade
The composite is a weighted blend of 9 inputs, each scored 0–100. Each bar is that input's sub-score; the figure is the points it added to the 100-point composite (weight × sub-score).
- Cash flow +30.0/30.0
- 1% rule +10.0/10.0
- DSCR +10.0/10.0
- ARV discount +7.5/15.0
- Livability +3.4/5.0
- Rent growth +3.0/5.0
- Condition / age +2.5/5.0
- Schools +1.8/10.0
- Appreciation +0.0/10.0
$39,995
🖨 Deal sheet (PDF) 📄 Offer letter ✓ Due diligence
Listing remarks
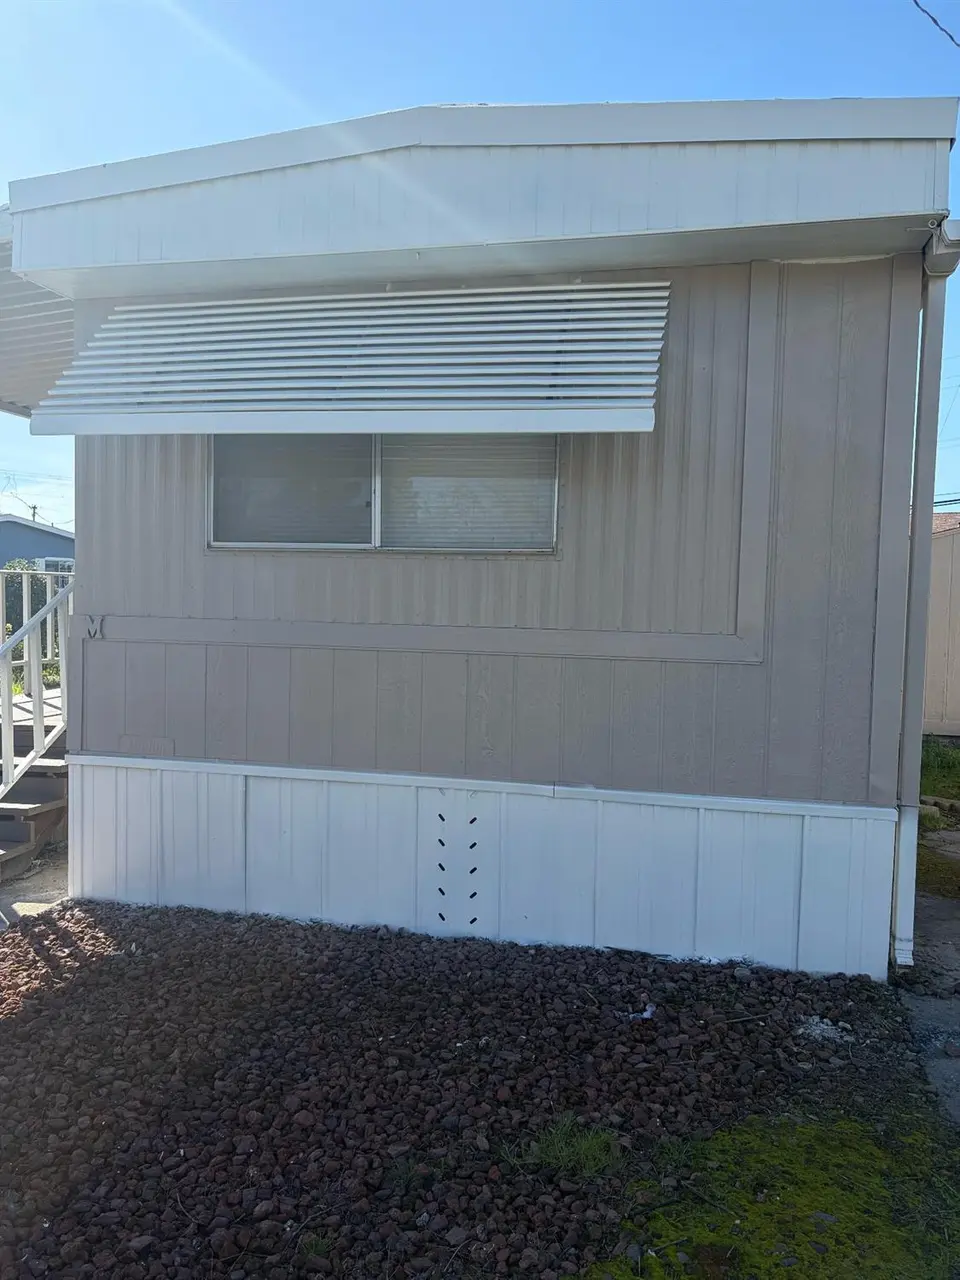
Welcome to Country Village a Senior Community. Home features 2 bedroom and 2 baths. Freshly painted interior and exterior. New luxury vinyl plank flooring throughout the home. Indoor laundry area. Includes storage shed.
Key facts
- Indoor laundry area
- Storage shed
- Built 1980
Tags
Neighborhood map
What this means for you Summary
Snapshot
- This is a 2-bed/2.0-bath land listed at $40k.
Deal economics
- At list price, monthly cash flow is $913 ($11k/yr) — positive.
- The deal already cash-flows at list — no discount required.
- Meets the 1% rule at list price ($2k rent vs $40k).
- Recommended offer: $36k (9.0% below list) — sets the bar for market timing.
- Cap rate 33.7% vs local median 3.7% in Marysville — top-decile yield for the area; either an underpriced asset or a hidden risk that comps aren't pricing in. Stress-test before assuming the spread holds.
Location & tenants
- Location reads 68/100 on livability (#293 in CA) — a middle-class / working-renter tenant base. Strengths: commute A+, housing A+; Watch: crime F, amenities F, employment D-.
- Marysville Joint Unified (suburban): math 14% / reading 28% proficiency, ranked #455 of 517 in CA (top 88%) — low school quality limits family demand, transient renter base, plan for 1-2y turnover; 68% free/reduced lunch — lower-income household profile, screen leases tightly.
- Zoned schools: Covillaud Elementary (math 23% / reading 39%, grade F, #821 of 1,571 statewide, top 53%, 519 students, 70% FRL); Anna Mckenney Intermediate (math 11% / reading 33%, grade F, #388 of 498 statewide, top 80%, 560 students, 76% FRL); Marysville High (math 12% / reading 52%, grade F, #674 of 1,170 statewide, top 59%, 1,028 students, 61% FRL) — zoned schools at 69% FRL track the district average.
- Market conditions: Rents rising (+1.9%/yr); 257 active listings in the ZIP; 750 units permitted in Yuba County in 2024 (41 in 5+ unit buildings).
Forward outlook
- Local home prices are declining (-3.0%/yr); year-one equity from $276 of loan paydown is wiped out by about $1k of value loss. Plan a longer hold.
- Yuba County population projected to shrink 3% by 2050 — rents likely to lag national; underwrite the cash flow, not the appreciation.
- At projected returns (-3.0% appreciation + 1.9% rent growth), your $11k cash investment doubles in ~2 years — after that, you're playing with house money.
Negotiation context
- It's been on market 108 days — a 9% lower offer ($36k) is reasonable based on typical stale-listing flexibility.
Questions for the listing agent
- It's been on market 108 days. Have you received any prior offers? Is the seller open to a 9% concession, seller financing, or rate buy-down credit?
- Why hasn't it sold? Are there any deal-killer items the seller is aware of (foundation, flood, title, zoning, code violations)?
- Is there a deadline driving the sale (1031 exchange, divorce, estate, relocation)? That informs how much negotiation room exists.
- Crime grade is F in this area — have there been break-ins, vandalism, or insurance claims at this property in the last 3 years? What carrier currently insures it and at what premium?
- What's the average days-on-market for RENTAL listings here right now (not sales)? A rising rental-DOM trend means longer vacancies and softer asking-rent achievability than the comps imply.
- What's the recent tenant-quality profile in this submarket — average credit score on applications, eviction rate, late-payment / NSF rate, and stable-employment percentage? A property-management company in the area should have these aggregated.
- How much new for-sale + rental construction is in the pipeline within 1–3 miles? Heavy new supply typically softens prices + rents 12–24 months out; constrained supply supports both.
Investment metrics
- 1% rule
- 3.77% ✓
- Cap rate
- 33.70%
- Cash-on-cash
- 97.87%
- DSCR
- 5.35
- GRM
- 2.2
CMA / ARV
No comps found within radius.
Projected returns pro-forma
-3.0% appreciation · 1.87% rent growth · sell at horizon
- IRR
- 97.6%
- Equity multiple
- 5.47×
- Total profit
- $50,020
- Equity at exit
- $5,963
- IRR
- —
- Equity multiple
- 10.98×
- Total profit
- $111,762
- Equity at exit
- $3,458
Cash invested: $11,199 (down + closing). Projections, not guarantees.
Landlord ↔ Tenant lean methodology
- Overall (STATE)
- 18 Strongly Tenant-Friendly
- State California
- 18 Strongly Tenant-Friendly · D+13
- County
- — inherits STATE
- City
- — inherits STATE
ZIP-level market 95901
- Rents YoY
- 1.9%
- Active inventory
- 257
- Price-to-rent
- 2.2×
Monthly cashflow live
- Estimated rent
- $1,506 medium interval (Pro) →
- Mortgage (P&I)
- −$210
- Tax est. 1.5%
- −$50 /mo · $600/yr
- Insurance
- −$17
- HOA
- −$0
- Vacancy / Maint / Mgmt
- −$316
- Net cashflow
- $913
Break-even live
Sensitivity live
| Price | -10% $941 | -5% $927 | +0% $913 | +5% $900 | +10% $886 |
|---|---|---|---|---|---|
| Rent | -10% $794 | -5% $854 | +0% $913 | +5% $973 | +10% $1,032 |
| Rate | -1.0pp $933 | -0.5pp $924 | base $913 | +0.5pp $903 | +1.0pp $892 |
UW: 25.0% down · 7.5% · 30yr · 1.5% tax · 5.0% vac · 8.0% maint · 8.0% mgmt
Financing live
Cash to close
- Down payment
- $9,999
- Closing costs
- $1,200
- Reserves months
- —
- Total cash needed
- —
Loan-product check · same deal, 3 products live
Conventional
25% down · 7.5% · 30yr
- Down + closing
- —
- Monthly P&I
- —
- Monthly cashflow
- —
- DSCR
- —
- Eligible?
- —
Personal DTI + credit; lowest rate.
DSCR
20% down · 8.5% · 30yr
- Down + closing
- —
- Monthly P&I
- —
- Monthly cashflow
- —
- DSCR
- —
- Eligible?
- —
No personal income docs; deal must DSCR.
Hard money
10% down · 12.0% · 12mo
- Down + closing
- —
- Monthly P&I
- —
- Monthly cashflow
- —
- DSCR
- —
- Eligible?
- —
Short-term bridge; refi at stabilization.
Listing history 18 events
-
2026-06-21days on market $39,995 Active 108 DOM
-
2026-06-19days on market $39,995 Active 106 DOM
-
2026-06-18days on market $39,995 Active 105 DOM
-
2026-06-17days on market $39,995 Active 104 DOM
-
2026-06-16days on market $39,995 Active 103 DOM
-
2026-06-15days on market $39,995 Active 102 DOM
-
2026-06-14days on market $39,995 Active 100 DOM
-
2026-06-13days on market $39,995 Active 99 DOM
-
2026-06-10days on market $39,995 Active 97 DOM
-
2026-06-09days on market $39,995 Active 96 DOM
-
2026-06-08days on market $39,995 Active 95 DOM
-
2026-06-07days on market $39,995 Active 94 DOM
-
2026-06-05days on market $39,995 Active 91 DOM
-
2026-06-03days on market $39,995 Active 90 DOM
-
2026-06-02days on market $39,995 Active 89 DOM
-
2026-06-01days on market $39,995 Active 88 DOM
-
2026-05-31days on market $39,995 Active 87 DOM
-
2026-05-30days on market $39,995 Active 86 DOM
ⓘ Source: listings_history table (triggers on properties + properties_extension) + one-shot
backfill from property_details.listing_events for pre-trigger history.
Nearby sold comps map
Loading sold comps map…
Walkable amenities ~0.75 mi
Loading nearby amenities…
Taxation est. · year 1
- Rental income
- $18,072
- − Mortgage interest
- −$2,240
- − Property taxes
- −$600
- − Insurance
- −$200
- − Repairs & maintenance
- −$1,446
- − Management
- −$1,446
- − Depreciation
- −$1,163
- Taxable income
- $10,977
- Est. tax owed @ 24.0%
- −$2,634
- After-tax cash flow
- $8,326/yr
For passive investors: Depreciation is non-cash, so a rental often shows a tax loss while cash-flowing — sheltering income. Rental losses are passive: they offset passive income freely, and up to $25,000/yr can offset ordinary (W-2) income if you actively participate and your MAGI is under $100k (phasing out to $0 by $150k); unused losses carry forward. On sale, claimed depreciation is recaptured at up to 25%, and gains may owe capital-gains tax (a 1031 exchange can defer both). Figures are a year-1 estimate at your 24.0% rate — not tax advice; consult a CPA.
Schools (NCES district)
- District
- Marysville Joint Unified
- NCES district ID
- 0624090
- Math proficiency
- 14% ▼ -13.00%
- Reading proficiency
- 28% ▼ -10.00%
- Median HH income
- $44,598
- Composite
- 18.18/100
- National rank
- #8961
- State rank
- #455 of 517 in CA
Livability — Marysville
- Score
- 68/100
- State rank
- #293
- US rank
- #9846
Category grades
Schools grade is shown separately in the Schools card above.
Census & demographics
- County
- Yuba County · 71,731 people
- City population
- 37,732
- Metro
- Yuba City, CA
- Population (ZIP)
- 37,732
- Household income
- $69,776
- Rent vs Own
- Severe rent burden
- 1190.0
Population outlook (Yuba County) Hauer SSP2
- Today (2025)
- 75,432 people
- By 2030
- 75,358 · -0.1%
- By 2040
- 74,643 · -1.0%
- By 2050
- 72,937 · -3.3%
- By 2075
- 66,368 · -12.0%
- By 2100
- 54,524 · -27.7%
Race, ethnicity, and origin ACS 2023
- Neighborhood character
- Diverse neighborhood (Simpson 0.65)
- Race & ethnicity
- White 51% Hispanic / Latino 28% Two or more races 17% Asian 9% Black 3% Native American 2%
- Hispanic origin (detail)
- Mexican 25%
- Common ancestry
- Italian 2% Lithuanian 1% Russian 1%
- Foreign-born
- 12% · Canada, China
- Languages at home
- 75% English-only · Spanish 16% Other Asian/Pacific 5% Other Indo-European 1%
Political lean MEDSL · Yuba
- 2024 margin
- Strong R (+25.8) · D 35.7% · R 61.5% · Other 2.8%
- 2008→2024 swing
- -11.2pp toward R · 2008: -14.7pp · 2024: -25.8pp
- All cycles
- 2024: R+25.8 2020: R+21.6 2016: R+24.1 2012: R+19.5 2008: R+14.7
Not yet ingested
- Civics
- —
Market trends
- HPI YoY
- ▼ -268.01%
- Current HPI
- 203.7684
- Rent YoY
- ▲ 1.87%
- Metro
- Yuba City, CA
- State GDP YoY
- ▲ 3.21%
- F500 in state
- 116
Industry mix (Fortune 500 HQ in CA)
| Industry | F500 HQs | Revenue |
|---|---|---|
| Technology | 27 | $1,492B |
|
||
| Financial Services | 3 | $174B |
|
||
| Retail | 3 | $44B |
|
||
| Insurance | 3 | $26B |
|
||
| Media / Entertainment | 2 | $115B |
|
||
| Pharmaceuticals / Biotech | 2 | $62B |
|
||
Property tax history
+1.9%/yrLatest (2025): $22 · +9.4% YoY. Source: county tax records.
Cash-flow waterfall
monthlySold comps — $/sqft
last 12 mo · ≤1 miLoading sold comps…