 Duplex
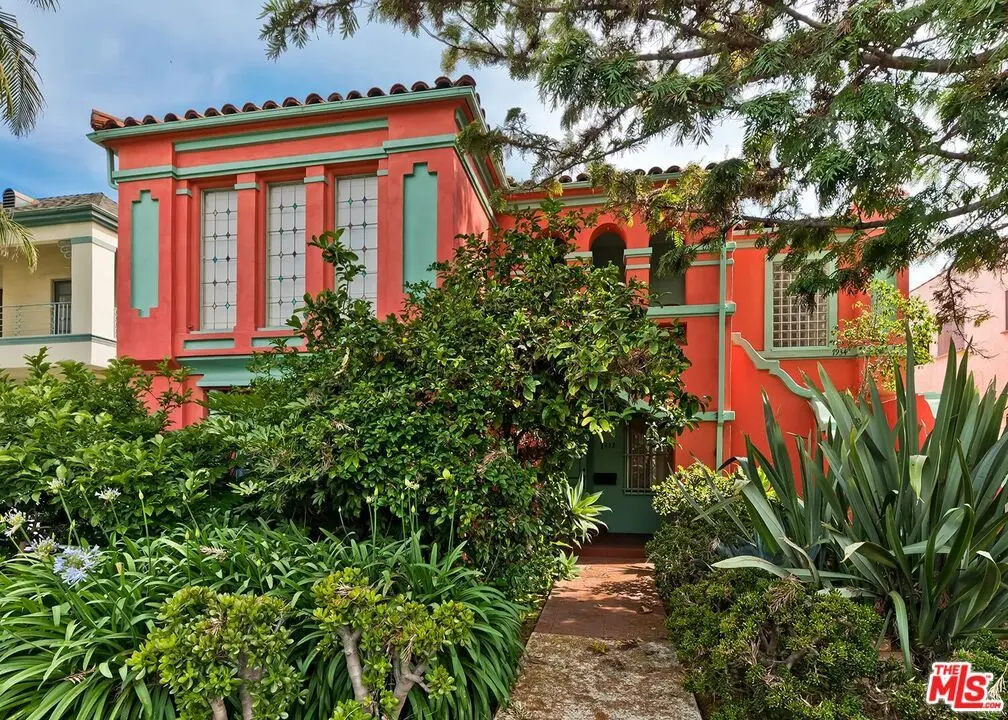
7932 Blackburn Ave · Los Angeles, CA
Flood risk 1/10 · Minimal
- FEMA flood zone
- X (unshaded)
- Chance of flooding over 30 yrs
- 0.0%
- Est. flood insurance / yr
- $507 – $1,088
Fire risk 1/10 · Minimal
- Est. fire insurance / yr
- $659 – $1,223
Heat risk 6/10 · Moderate
- Hot days now (above 88°F)
- 7 days/yr
- Hot days in 30 yrs
- 22 days/yr
Wind risk 1/10 · Minimal
- Chance of severe wind over 30 yrs
- —
Air-quality risk 5/10 · Moderate
- Unhealthy air days now
- 7 days/yr
- Unhealthy air days in 30 yrs
- 7 days/yr
Risk factors via First Street. Map © Google.
Why this score? — see what drove the D grade
The composite is a weighted blend of 9 inputs, each scored 0–100. Each bar is that input's sub-score; the figure is the points it added to the 100-point composite (weight × sub-score).
- ARV discount +11.8/15.0
- Appreciation +8.1/10.0
- Cash flow +6.8/30.0
- Schools +3.6/10.0
- Livability +3.4/5.0
- Rent growth +2.5/5.0
- Condition / age +2.5/5.0
- 1% rule +1.5/10.0
- DSCR +1.0/10.0
$1,795,000
🖨 Deal sheet 📄 Offer letter ✓ Due diligence
Multi-family units
County records classify this as Multi-Family (2-4 Unit). Listing-text estimate: 2 units. confirmed
Listing remarks
A rare duplex with nearly 4,000 SF of existing living space and fully city-approved plans to add a 1,000 SF two-story ADU in the back. The bottom unit will be delivered vacant, giving an owner-user immediate occupancy while generating rental income from the top unit, or allowing an investor to lease both units from day one. Positioned steps from The Grove, the Original Farmer's Market, Whole Foods and Trader Joe's, this is one of the most strategic locations in Los Angeles--walkable, in-demand and anchored by the Beverly Center corridor. Properties like this, combining scale, a turnkey development approval and a premier Westside address, rarely come to market. Ideal for owner-users and inve
Key facts
- City approved plans
- Two story adu
- Immediate occupancy
Tags
Property features AI
Finance
- Other: Zoning: LAR3
- Financial info: Unit 1 projected rent: $6,500; actual rent: $2,750; Unit 2 projected rent: $6,500; Gross income reported as $0; Vacancy rate: 1%; Rental data listed as Scheduled
- HOA & community: 2 units in the complex
Exterior
- Parking: Detached garage with door opener (side-by-side configuration); Total 8 parking spaces; 4 covered parking spaces; 4 open parking spaces
- Utilities: Water, sewer, and power information not provided
- Home design: Residential income duplex; Two levels / multi-levels
- Construction: 1 building
- Exterior features: Other structures on the lot
Interior
- Kitchen: Dishwasher; Range/oven; Refrigerator
- Bedrooms: Unit 1: 3 bedrooms; Unit 2: 3 bedrooms
- Bathrooms: Unit 1: 2 bathrooms; Unit 2: 2 bathrooms
- Heating & cooling: Gravity heat; No cooling
- Interior features: Ceiling fan; Garbage disposal; Hood fan
- Laundry & utility: Washer; Dryer
Neighborhood map
What this means for you Summary
Snapshot
- This is a 2 × 3-bed/2.0-bath units multifamily listed at $1.79M.
Deal economics
- At list price, monthly cash flow is $-3k ($-33k/yr) — negative. Per door: $-1k/mo.
- To cash-flow at today's rent, offer at most $1.30M (27.4% below list).
- To meet the 1% rule (rent ≥ 1% of price), the offer needs to be $1.16M (35.3% below list).
- Recommended offer: $1.16M (35.3% below list) — sets the bar for 1% rule.
- Cap rate 4.4% vs local median 2.1% in Los Angeles — top-decile yield for the area; either an underpriced asset or a hidden risk that comps aren't pricing in. Stress-test before assuming the spread holds.
Location & tenants
- Location reads 68/100 on livability (#273 in CA) — a middle-class / working-renter tenant base. Strengths: amenities A+, commute A+, employment B; Watch: health & safety C-, schools D+, crime F.
- Los Angeles Unified (urban): math 29% / reading 54% proficiency, ranked #223 of 517 in CA (top 43%) — families likely to look elsewhere, expect single-tenant / working-renter base with shorter leases; 67% free/reduced lunch — lower-income household profile, screen leases tightly.
- Market conditions: Rents flat; 122 active listings in the ZIP; 34 comparable units currently listed for rent nearby; rentals at typical pace (median 25d on market — plan ~3-4 weeks tenant-placement turnaround); 47% of comp listings sitting > 30 days — soft ceiling on asking rent; solid renter incomes; 19,697 units permitted in Los Angeles County in 2024 (9,426 in 5+ unit buildings).
- At $11,616/mo this rent would consume 135% of the median local household income ($103k/yr) (locally 2888% of renters already pay >50% of income on rent) — very limited rent-growth headroom before tenants either downsize or default.
Forward outlook
- In year one you build about $125k of equity ($12k loan paydown + $112k appreciation (6.2% local appreciation)).
- Los Angeles County population projected at +9% by 2050 — modest demand growth; plan on rents tracking national, not racing it.
- By year 2, paydown + projected appreciation supports a ~$199k cash-out refi (75% LTV) — recoverable capital for the next deal without selling this one.
Negotiation context
- Only 1 days on market — expect competitive offers; lowballing is unlikely to land.
- 9 sale attempts since 4y ago with the ask held roughly flat each time — persistent listings suggest the price (not the market) is what's stuck; bring a comps-based counter.
Risks & watch-outs
- Watch-outs: built in 1936 — expect roof / HVAC / electrical / plumbing capex.
- Climate carrying-cost: extreme-heat days projected 7→22/yr by 2055 (HVAC capex compounding) — expect insurance premiums to compound above CPI over the hold.
Questions for the listing agent
- What do current leases actually rent for vs. the listed asking? Can we see a recent rent roll and the last 12 months of T-12 income?
- Can we see the unit-by-unit rent roll, current vacancy, and any below-market leases? What's the average tenancy length?
- What capital expenditures (roof, boiler, parking lot, exteriors) have been made in the last 5 years, and what's planned in the next 2?
- Built in 1936 — when were the roof, HVAC, electrical panel, plumbing, and water heater last replaced?
- Is there a deadline driving the sale (1031 exchange, divorce, estate, relocation)? That informs how much negotiation room exists.
- Schools are D-rated, which usually means shorter tenancies and higher turnover. Who's the typical renter profile here, and what's been the actual vacancy rate?
- Crime grade is F in this area — have there been break-ins, vandalism, or insurance claims at this property in the last 3 years? What carrier currently insures it and at what premium?
- The area grade is low — what's the realistic commute time and amenity access for the typical tenant pool here? Any planned neighborhood developments (good or bad) we should know about?
- What's the average days-on-market for RENTAL listings here right now (not sales)? A rising rental-DOM trend means longer vacancies and softer asking-rent achievability than the comps imply.
- What's the recent tenant-quality profile in this submarket — average credit score on applications, eviction rate, late-payment / NSF rate, and stable-employment percentage? A property-management company in the area should have these aggregated.
- How much new apartment / multifamily construction is in the pipeline within 1–3 miles? Heavy new supply (>2% of stock underway) typically softens rents 12–24 months out; light construction supports rent growth.
Investment metrics
- 1% rule
- 0.65% ✗
- Cap rate
- 4.43%
- Cash-on-cash
- -6.64%
- DSCR
- 0.70
- GRM
- 12.9
CMA / ARV
- ARV (median comp)
- $1,986,013
- List price
- $1,795,000
- Delta
- -6.85%
- Verdict
- FAIR
- Comps
- 20 within 1.0 mi
Show comp detail 12 sales within ~0.75 mi
| Address | Dist | Beds/Ba | Sqft | Sold | Price | $/sf | Match |
|---|---|---|---|---|---|---|---|
| 8206 W 4th St | 0.29mi | 6/4.0 | 3,822 (-1%) | 7mo | $2,468,750 | $646 | 79 |
| 6620 W 6th St | 0.63mi | 6/4.0 | 3,866 (+0%) | 1mo | $2,042,500 | $528 | 70 |
| 6152 Orange St | 0.45mi | 6/4.0 | 3,589 (-7%) | 1mo | $1,425,000 | $397 | 66 |
| 6410 W 6th St | 0.49mi | 6/5.0 | 3,909 (+1%) | 9mo | $2,250,000 | $576 | 64 |
| 6347 Orange St | 0.47mi | 6/6.0 | 3,984 (+3%) | 8mo | $1,660,000 | $417 | 59 |
| 8013 W 4th St | 0.11mi | 6/4.0 | 4,331 (+12%) | 21mo | $1,867,000 | $431 | 58 |
| 8256 Blackburn Ave | 0.40mi | 6/5.0 | 3,758 (-3%) | 20mo | $1,625,000 | $432 | 56 |
| 8442 W 4th St | 0.70mi | 6/4.0 | 3,753 (-3%) | 13mo | $1,745,000 | $465 | 52 |
| 6306 W 6th St | 0.42mi | 6/4.0 | 4,319 (+12%) | 14mo | $1,865,000 | $432 | 49 |
| 8218 Blackburn Ave | 0.34mi | 6/4.0 | 4,332 (+12%) | 20mo | $2,282,320 | $527 | 47 |
| 6216 W 6th St | 0.40mi | 6/4.0 | 4,339 (+12%) | 18mo | $2,250,000 | $519 | 46 |
| 440 440-442 N Harper Ave | 0.68mi | 6/4.0 | 4,249 (+10%) | 22mo | $2,280,000 | $537 | 33 |
Match score weights: distance 35% · size 25% · config 20% · recency 20%. Top-matched comps best support the ARV.
Projected returns pro-forma
6.25% appreciation · 0.14% rent growth · sell at horizon
- IRR
- 9.8%
- Equity multiple
- 1.67×
- Total profit
- $334,632
- Equity at exit
- $1,156,228
- IRR
- 10.3%
- Equity multiple
- 3.10×
- Total profit
- $1,057,609
- Equity at exit
- $2,121,202
Cash invested: $502,600 (down + closing). Projections, not guarantees.
Landlord ↔ Tenant lean methodology
- Overall (CITY)
- 0 Strongly Tenant-Friendly
- State California
- 18 Strongly Tenant-Friendly · D+13
- County
- — inherits STATE
- City Los Angeles
- 0 Strongly Tenant-Friendly · D+22
ZIP-level market 90048
- Home prices YoY
- 1.3%
- Rents YoY
- 0.1%
- Active inventory
- 122
- Price-to-rent
- 25.8×
Monthly cashflow live
- Estimated rent
- $11,616 high interval (Pro) →
- Mortgage (P&I)
- −$9,413
- Tax from tax record
- −$1,797 /mo · $21,569/yr
- Insurance
- −$748
- HOA
- −$0
- Vacancy / Maint / Mgmt
- −$2,439
- Net cashflow
- $-2,782
Break-even live
2-unit breakdown (identical units grouped — click to expand)
| Units | Beds | Baths | Est. rent |
|---|---|---|---|
| 2× units | 3 | 2 | $11,616 |
| #1 | 3 | 2 | $5,808 |
| #2 | 3 | 2 | $5,808 |
| Total (2 units) | $11,616 | ||
UW: 25.0% down · 7.5% · 30yr · 1.5% tax · 5.0% vac · 8.0% maint · 8.0% mgmt
Financing live
Cash to close
- Down payment
- $448,750
- Closing costs
- $53,850
- Reserves months
- —
- Total cash needed
- —
Loan-product check · same deal, 3 products live
Conventional
25% down · 7.5% · 30yr
- Down + closing
- —
- Monthly P&I
- —
- Monthly cashflow
- —
- DSCR
- —
- Eligible?
- —
Personal DTI + credit; lowest rate.
DSCR
20% down · 8.5% · 30yr
- Down + closing
- —
- Monthly P&I
- —
- Monthly cashflow
- —
- DSCR
- —
- Eligible?
- —
No personal income docs; deal must DSCR.
Hard money
10% down · 12.0% · 12mo
- Down + closing
- —
- Monthly P&I
- —
- Monthly cashflow
- —
- DSCR
- —
- Eligible?
- —
Short-term bridge; refi at stabilization.
Rent comps 34 comps
| Address | Beds | Baths | Sqft | Rent | $/sqft | DOM | Units | Dist |
|---|---|---|---|---|---|---|---|---|
| 6359 Colgate Ave Los Angeles, CA | 5.0 | 5.5 | 4098 | $18,999 | $4.64 | 43d | 1 | 0.11mi |
| 6379 Colgate Ave Los Angeles, CA | 5.0 | 6.0 | 4647 | $24,950 | $5.37 | 43d | 1 | 0.12mi |
| 356 N La Jolla Ave Los Angeles, CA | 5.0 | 7.0 | 5601 | $30,000 | $5.36 | 43d | 1 | 0.54mi |
| 356 N La Jolla Ave Los Angeles, CA | 5.0 | 5.5 | 5601 | $30,000 | $5.36 | 3d | 1 | 0.54mi |
| 419 N Edinburgh Ave Los Angeles, CA | 5.0 | 5.0 | 5000 | $29,995 | $6.00 | 43d | 1 | 0.54mi |
| 6617 Lindenhurst Ave Los Angeles, CA | 5.0 | 5.5 | 3900 | $22,500 | $5.77 | 1d | 1 | 0.56mi |
| 418 N Sweetzer Ave Los Angeles, CA | 6.0 | 7.0 | 5136 | $25,000 | $4.87 | 43d | 1 | 0.66mi |
| 346 N Kings Rd Los Angeles, CA | 6.0 | 7.0 | 4500 | $22,950 | $5.10 | 43d | 1 | 0.67mi |
| 429 N Sweetzer Ave Los Angeles, CA | 5.0 | 5.5 | 4796 | $17,950 | $3.74 | 24d | 1 | 0.69mi |
| 449 N Sweetzer Ave Los Angeles, CA | 5.0 | 5.5 | 3242 | $9,900 | $3.05 | 24d | 1 | 0.72mi |
| 458 N Flores St Los Angeles, CA | 5.0 | 4.0 | 3621 | $15,000 | $4.14 | 18d | 1 | 0.75mi |
| 523 N Harper Ave Los Angeles, CA | 5.0 | 5.5 | 4189 | $23,000 | $5.49 | 43d | 1 | 0.77mi |
| 333 N Croft Ave Los Angeles, CA | 5.0 | 5.5 | 4800 | $25,000 | $5.21 | 43d | 1 | 0.78mi |
| 120 S Poinsettia Pl Los Angeles, CA | 5.0 | 4.0 | 2704 | $10,750 | $3.98 | 16d | 1 | 0.85mi |
| 454 S Holt Ave Los Angeles, CA | 5.0 | 6.0 | 3545 | $28,000 | $7.90 | 20d | 1 | 0.87mi |
| 160 N Stanley Dr Beverly Hills, CA | 5.0 | 5.5 | 4100 | $28,000 | $6.83 | 1d | 1 | 0.89mi |
| 729 N Ogden Dr Los Angeles, CA | 5.0 | 4.5 | 4600 | $16,995 | $3.69 | 1d | 1 | 0.96mi |
| 721 N Spaulding Ave Los Angeles, CA | 5.0 | 4.5 | 4800 | $19,500 | $4.06 | 4d | 1 | 0.97mi |
| 637 N Gardner St Los Angeles, CA | 5.0 | 5.5 | 4300 | $19,500 | $4.53 | 4d | 1 | 0.99mi |
| 738 N Harper Ave Los Angeles, CA | 5.0 | 5.5 | 5501 | $25,000 | $4.54 | 43d | 1 | 1.01mi |
| 731 N Curson Ave Los Angeles, CA | 6.0 | 5.5 | 5109 | $22,000 | $4.31 | 24d | 1 | 1.03mi |
| 736 N Curson Ave Los Angeles, CA | 5.0 | 5.5 | 4700 | $19,500 | $4.15 | 4d | 1 | 1.06mi |
| 829 N Ogden Dr Los Angeles, CA | 5.0 | 6.0 | 4977 | $25,000 | $5.02 | 10d | 1 | 1.07mi |
| 824 N Curson Ave Los Angeles, CA | 5.0 | 6.5 | 4853 | $27,000 | $5.56 | 24d | 1 | 1.13mi |
| 307 S Sycamore Ave Los Angeles, CA | 5.0 | 5.5 | 4465 | $32,000 | $7.17 | 43d | 1 | 1.14mi |
| 806 N Gardner St Los Angeles, CA | 5.0 | 6.0 | 5053 | $24,950 | $4.94 | 43d | 1 | 1.16mi |
| 726 N Martel Ave Los Angeles, CA | 5.0 | 6.0 | 4855 | $26,000 | $5.36 | 43d | 1 | 1.16mi |
| 1161 Stearns Dr Los Angeles, CA | 6.0 | 5.5 | 3333 | $17,850 | $5.36 | 43d | 1 | 1.19mi |
| 616 N Formosa Ave Los Angeles, CA | 5.0 | 4.0 | 2898 | $10,750 | $3.71 | 22d | 1 | 1.26mi |
| 616 N Formosa Ave Los Angeles, CA | 5.0 | 4.0 | 2898 | $10,750 | $3.71 | 24d | 1 | 1.26mi |
| 5558 Edgewood Pl Los Angeles, CA | 6.0 | 8.0 | 4537 | $19,500 | $4.30 | 43d | 1 | 1.27mi |
| 1420 Stearns Dr Los Angeles, CA | 5.0 | 4.0 | 2701 | $18,500 | $6.85 | 43d | 1 | 1.41mi |
| 748 N Detroit St Los Angeles, CA | 5.0 | 6.0 | 5345 | $18,500 | $3.46 | 43d | 1 | 1.41mi |
| 244 S Almont Dr Beverly Hills, CA | 5.0 | 4.0 | 3119 | $14,500 | $4.65 | 24d | 1 | 1.50mi |
Listing history 27 events
-
2026-06-18pricedays on market $1,795,000 Active 1 DOM
-
2026-06-17days on market $1,850,000 Active 37 DOM
-
2026-06-16days on market $1,850,000 Active 36 DOM
-
2026-06-15days on market $1,850,000 Active 35 DOM
-
2026-06-13days on market $1,850,000 Active 33 DOM
-
2026-06-09days on market $1,850,000 Active 29 DOM
-
2026-06-08days on market $1,850,000 Active 28 DOM
-
2026-06-07days on market $1,850,000 Active 27 DOM
-
2026-06-04days on market $1,850,000 Active 24 DOM
-
2026-06-03days on market $1,850,000 Active 23 DOM
-
2026-06-02days on market $1,850,000 Active 22 DOM
-
2026-06-01days on market $1,850,000 Active 21 DOM
-
2026-05-31days on market $1,850,000 Active 20 DOM
-
2026-05-11$1,850,000 Active 1105-char remark
-
2026-02-18Active
-
2026-01-05Active
-
2025-10-31Active
-
2025-09-04Active
-
2025-05-29Active
-
2023-03-02soldstatus $1,700,000 Sold
-
2023-03-02soldstatus $1,700,000
-
2023-03-02soldstatus $1,700,000
-
2023-01-24status Pending
-
2023-01-13price $1,995,000
-
2022-11-28$2,050,000 Active
-
2022-11-28$1,995,000
-
1986-01-17soldstatus $280,000
ⓘ Source: listings_history table (triggers on properties + properties_extension) + one-shot
backfill from property_details.listing_events for pre-trigger history.
Tax reassessment forecast CA · Resets to sale price
- Current annual tax
- $21,569 · $1,797/mo
- Projected year-2 tax
- $21,569 · $1,797/mo
- Expected delta
- $0/yr ($0/mo · 0.0%)
ⓘ Screening estimate from a state-policy table — verify with the county assessor before closing.
Climate risk First Street
- Flood 1/10 Low FEMA zone X (unshaded) · 0% chance over 30 yrs
- Wildfire 1/10 Low
- Heat 6/10 Major 7 d/yr ≥88°F today · 22 d/yr by 30 yrs out
- Wind 1/10 Low
- Air quality 5/10 Major 7 unhealthy d/yr today · 7 by 30 yrs out
Nearby sold comps map
Loading sold comps map…
Walkable amenities ~0.75 mi
Loading nearby amenities…
Taxation est. · year 1
- Rental income
- $139,392
- − Mortgage interest
- −$100,548
- − Property taxes
- −$21,569
- − Insurance
- −$8,975
- − Repairs & maintenance
- −$11,151
- − Management
- −$11,151
- − Depreciation
- −$52,218
- Taxable loss
- −$66,220
- Est. tax savings @ 24.0%
- +$15,893
- After-tax cash flow
- $-17,489/yr
For passive investors: Depreciation is non-cash, so a rental often shows a tax loss while cash-flowing — sheltering income. Rental losses are passive: they offset passive income freely, and up to $25,000/yr can offset ordinary (W-2) income if you actively participate and your MAGI is under $100k (phasing out to $0 by $150k); unused losses carry forward. On sale, claimed depreciation is recaptured at up to 25%, and gains may owe capital-gains tax (a 1031 exchange can defer both). Figures are a year-1 estimate at your 24.0% rate — not tax advice; consult a CPA.
Schools (NCES district)
- District
- Los Angeles Unified
- NCES district ID
- 0622710
- Math proficiency
- 29% ▼ -4.00%
- Reading proficiency
- 54% ▲ 10.00%
- Median HH income
- $50,403
- Composite
- 35.67/100
- National rank
- #4875
- State rank
- #223 of 517 in CA
Livability — Los Angeles
- Score
- 68/100
- State rank
- #273
- US rank
- #9237
Category grades
Schools grade is shown separately in the Schools card above.
Census & demographics
- Census place
- Los Angeles, CA
- County
- Los Angeles County · 9,444,647 people
- City population
- 3,838,149
- Metro
- Los Angeles-Long Beach-Anaheim, CA
- Population (ZIP)
- 21,476
- Household income
- $103,495
- Rent vs Own
- Severe rent burden
- 2888.0
Population outlook (Los Angeles County) Hauer SSP2
- Today (2025)
- 10,940,515 people
- By 2030
- 11,256,481 · +2.9%
- By 2040
- 11,729,929 · +7.2%
- By 2050
- 11,948,407 · +9.2%
- By 2075
- 11,818,114 · +8.0%
- By 2100
- 10,842,928 · -0.9%
Race, ethnicity, and origin ACS 2023
- Neighborhood character
- Predominantly White (73%)
- Race & ethnicity
- White 73% Two or more races 9% Asian 8% Hispanic / Latino 8% Black 5%
- Hispanic origin (detail)
- Mexican 3%
- Common ancestry
- Romanian 5% Scotch-Irish 4% Lithuanian 3%
- Foreign-born
- 27% · Canada, China, South Korea
- Languages at home
- 74% English-only · Other Indo-European 7% Spanish 5% Russian/Polish/Slavic 2%
Political lean MEDSL · Los Angeles
- 2024 margin
- Solid D (+32.9) · D 64.8% · R 31.9% · Other 3.3%
- 2008→2024 swing
- -7.4pp toward R · 2008: 40.4pp · 2024: 32.9pp
- All cycles
- 2024: D+32.9 2020: D+44.2 2016: D+48.0 2012: D+40.0 2008: D+40.4
Not yet ingested
- Civics
- —
Market trends
- HPI YoY
- ▲ 6.25%
- Current HPI
- 500.5893
- Rent YoY
- ▲ 0.14%
- Metro
- Los Angeles-Long Beach-Anaheim, CA
- State GDP YoY
- ▲ 3.21%
- F500 in state
- 116
Industry mix (Fortune 500 HQ in CA)
| Industry | F500 HQs | Revenue |
|---|---|---|
| Technology | 27 | $1,492B |
|
||
| Financial Services | 3 | $174B |
|
||
| Retail | 3 | $44B |
|
||
| Insurance | 3 | $26B |
|
||
| Media / Entertainment | 2 | $115B |
|
||
| Pharmaceuticals / Biotech | 2 | $62B |
|
||
Price history
+541.1% since first listed15 events — show timeline
- 2026-06-17 Listed $1,795,000 TheMLS
- 2026-05-11 Listed — TheMLS
- 2026-02-18 Listed — TheMLS
- 2026-01-05 Listed — TheMLS
- 2025-10-31 Listed — TheMLS
- 2025-09-04 Listed — TheMLS
- 2025-05-29 Listed — TheMLS
- 2023-03-02 Sold (Public Records) $1,700,000 Public Records
- 2023-03-02 Sold (MLS) $1,700,000 TheMLS
- 2023-03-02 Sold (MLS) $1,700,000 SDMLS
- 2023-01-24 Pending — TheMLS
- 2023-01-13 Price Changed $1,995,000 TheMLS
- 2022-11-28 Listed $2,050,000 TheMLS
- 2022-11-28 Listed $1,995,000 SDMLS
- 1986-01-17 Sold (Public Records) $280,000 Public Records
Property tax history
+8.5%/yrLatest (2025): $21,569 · +1.2% YoY. Source: county tax records.
Cash-flow waterfall
monthlySold comps — $/sqft
last 12 mo · ≤1 miLoading sold comps…