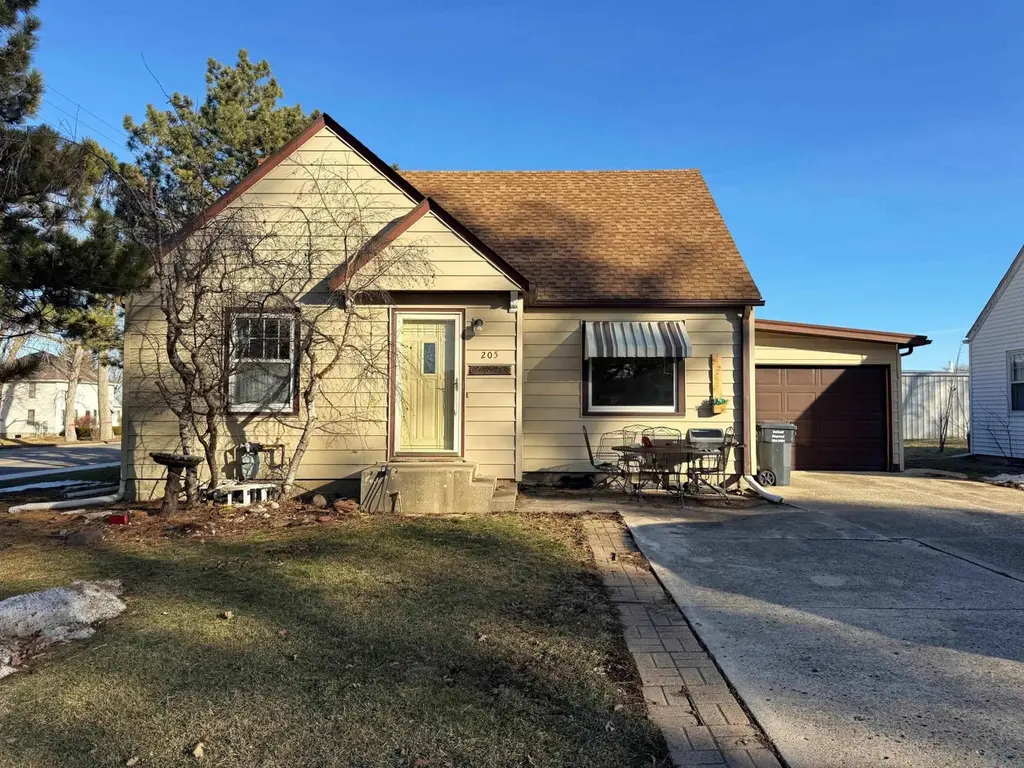
205 Washington Ave · Sheldon, IA
Flood risk 1/10 · Minimal
- FEMA flood zone
- X (unshaded)
- Chance of flooding over 30 yrs
- 0.0%
- Est. flood insurance / yr
- $473 – $860
Fire risk 1/10 · Minimal
- Est. fire insurance / yr
- $902 – $1,676
Heat risk 3/10 · Minor
- Hot days now (above 101°F)
- 7 days/yr
- Hot days in 30 yrs
- 14 days/yr
Wind risk 2/10 · Minimal
- Chance of severe wind over 30 yrs
- —
Air-quality risk 1/10 · Minimal
- Unhealthy air days now
- 0 days/yr
- Unhealthy air days in 30 yrs
- 0 days/yr
Risk factors via First Street. Map © Google.
Why this score? — see what drove the D grade
The composite is a weighted blend of 9 inputs, each scored 0–100. Each bar is that input's sub-score; the figure is the points it added to the 100-point composite (weight × sub-score).
- ARV discount +12.2/15.0
- Cash flow +10.2/30.0
- Schools +6.4/10.0
- Livability +4.2/5.0
- DSCR +2.9/10.0
- 1% rule +2.5/10.0
- Rent growth +2.5/5.0
- Condition / age +2.5/5.0
- Appreciation +0.0/10.0
$174,900
🖨 Deal sheet (PDF) 📄 Offer letter ✓ Due diligence
Listing remarks MLS
Solid 3-bedroom, 2-bath home in a central location near schools and parks. The home offers a practical layout and generous living spaces, with plenty of potential for updates to make it your own. A great opportunity for buyers looking to add value while enjoying a convenient, well-established neighborhood.
Key facts
- Near schools
- Practical layout
- Central location
Tags
Neighborhood map
What this means for you Summary
Snapshot
- This is a 3-bed/2.0-bath single-family listed at $175k.
Deal economics
- At list price, monthly cash flow is $-99 ($-1k/yr) — negative.
- To cash-flow at today's rent, offer at most $157k (10.0% below list).
- To meet the 1% rule (rent ≥ 1% of price), the offer needs to be $131k (25.1% below list).
- Recommended offer: $131k (25.1% below list) — sets the bar for 1% rule.
- Cap rate 5.6% vs local median 3.6% in Sheldon — top-decile yield for the area; either an underpriced asset or a hidden risk that comps aren't pricing in. Stress-test before assuming the spread holds.
Location & tenants
- Location reads 84/100 on livability (#23 in IA, #688 nationally) — a professional / high-income tenant draw. Strengths: cost of living A+, housing A+, health & safety A+; Watch: commute F.
- Sheldon Community School District (town): math 74% / reading 78% proficiency, ranked #63 of 289 in IA (top 22%) — strong family-tenant draw, lease renewals of 3-5y typical.
- Zoned schools: East Elementary School (math 87% / reading 72%, grade A, #71 of 616 statewide, top 15%, 450 students, 44% FRL); Sheldon Middle School (math 70% / reading 78%, grade A, #83 of 246 statewide, top 34%, 320 students, 47% FRL); Sheldon High School (math 73% / reading 81%, grade A-, #60 of 336 statewide, top 21%, 342 students, 39% FRL).
- Market conditions: 49 active listings in the ZIP; 13 units permitted in O'Brien County in 2024 (0 in 5+ unit buildings).
Forward outlook
- Local home prices are declining (-3.0%/yr); year-one equity from $1k of loan paydown is wiped out by about $5k of value loss. Plan a longer hold.
- O'Brien County population projected at -11% by 2050 — secular population decline; favor cash flow + early exit over multi-decade hold.
Negotiation context
- It's been on market 193 days — a 12% lower offer ($154k) is reasonable based on typical stale-listing flexibility.
Risks & watch-outs
- Watch-outs: built in 1940 — expect roof / HVAC / electrical / plumbing capex.
Questions for the listing agent
- What do current leases actually rent for vs. the listed asking? Can we see a recent rent roll and the last 12 months of T-12 income?
- It's been on market 193 days. Have you received any prior offers? Is the seller open to a 25% concession, seller financing, or rate buy-down credit?
- Built in 1940 — when were the roof, HVAC, electrical panel, plumbing, and water heater last replaced?
- Why hasn't it sold? Are there any deal-killer items the seller is aware of (foundation, flood, title, zoning, code violations)?
- Is there a deadline driving the sale (1031 exchange, divorce, estate, relocation)? That informs how much negotiation room exists.
- Schools are A-rated — typically a magnet for longer-tenancy family renters. What's the average tenant stay here, and is there a school-zone premium baked into asking?
- The area grade is low — what's the realistic commute time and amenity access for the typical tenant pool here? Any planned neighborhood developments (good or bad) we should know about?
- What's the average days-on-market for RENTAL listings here right now (not sales)? A rising rental-DOM trend means longer vacancies and softer asking-rent achievability than the comps imply.
- What's the recent tenant-quality profile in this submarket — average credit score on applications, eviction rate, late-payment / NSF rate, and stable-employment percentage? A property-management company in the area should have these aggregated.
- How much new for-sale + rental construction is in the pipeline within 1–3 miles? Heavy new supply typically softens prices + rents 12–24 months out; constrained supply supports both.
Investment metrics
- 1% rule
- 0.75% ✗
- Cap rate
- 5.62%
- Cash-on-cash
- -2.42%
- DSCR
- 0.89
- GRM
- 11.1
CMA / ARV
- ARV (median comp)
- $195,231
- List price
- $174,900
- Delta
- -10.41%
- Verdict
- UNDERPRICED
- Comps
- 20 within 1.0 mi
Show comp detail 12 sales within ~0.75 mi
| Address | Dist | Beds/Ba | Sqft | Sold | Price | $/sf | Match |
|---|---|---|---|---|---|---|---|
| 515 8th Ave | 0.27mi | 3/1.0 | 1,627 (+2%) | 1mo | $162,000 | $100 | 80 |
| 902 6th Street St | 0.28mi | 3/1.5 | 1,520 (-5%) | 6mo | $180,000 | $118 | 71 |
| 823 8th | 0.43mi | 4/2.0 (+1) | 1,592 (-1%) | 3mo | $83,000 | $52 | 71 |
| 412 Washington Ave | 0.12mi | 2/2.0 (-1) | 1,720 (+7%) | 7mo | $260,000 | $151 | 71 |
| 905 6th St | 0.25mi | 4/2.0 (+1) | 1,720 (+7%) | 3mo | $193,000 | $112 | 68 |
| 703 9th Ave | 0.39mi | 3/2.0 | 1,736 (+8%) | 0mo | $217,000 | $125 | 68 |
| 711 8th St | 0.48mi | 3/2.0 | 1,492 (-7%) | 6mo | $182,000 | $122 | 61 |
| 1670 Pleasant Ct. Dr | 0.61mi | 3/1.0 | 1,602 (+0%) | 8mo | $186,000 | $116 | 61 |
| 620 6th Ave | 0.46mi | 2/2.0 (-1) | 1,430 (-11%) | 1mo | $175,000 | $122 | 55 |
| 1144 11th St | 0.71mi | 3/2.0 | 1,744 (+9%) | 3mo | $187,000 | $107 | 50 |
| 806 10th St | 0.63mi | 3/1.5 | 1,440 (-10%) | 7mo | $150,000 | $104 | 46 |
| 1812 E 9th St | 0.64mi | 3/2.0 | 1,771 (+11%) | 8mo | $198,000 | $112 | 46 |
Match score weights: distance 35% · size 25% · config 20% · recency 20%. Top-matched comps best support the ARV.
Projected returns pro-forma
-3.0% appreciation · 3.0% rent growth · sell at horizon
- IRR
- -20.3%
- Equity multiple
- 0.29×
- Total profit
- $-34,659
- Equity at exit
- $26,078
- IRR
- -13.5%
- Equity multiple
- 0.22×
- Total profit
- $-38,389
- Equity at exit
- $15,122
Cash invested: $48,972 (down + closing). Projections, not guarantees.
Landlord ↔ Tenant lean methodology
- Overall (STATE)
- 83 Strongly Landlord-Friendly
- State Iowa
- 83 Strongly Landlord-Friendly · R+6
- County
- — inherits STATE
- City
- — inherits STATE
ZIP-level market 51201
- Home prices YoY
- -25.9%
- Active inventory
- 49
- Price-to-rent
- 11.1×
Monthly cashflow live
- Estimated rent
- $1,310 medium interval (Pro) →
- Mortgage (P&I)
- −$917
- Tax from tax record
- −$144 /mo · $1,728/yr
- Insurance
- −$73
- HOA
- −$0
- Vacancy / Maint / Mgmt
- −$275
- Net cashflow
- $-99
Break-even live
Sensitivity live
| Price | -10% $0 | -5% $-49 | +0% $-99 | +5% $-148 | +10% $-198 |
|---|---|---|---|---|---|
| Rent | -10% $-202 | -5% $-151 | +0% $-99 | +5% $-47 | +10% $5 |
| Rate | -1.0pp $-11 | -0.5pp $-54 | base $-99 | +0.5pp $-144 | +1.0pp $-190 |
UW: 25.0% down · 7.5% · 30yr · 1.5% tax · 5.0% vac · 8.0% maint · 8.0% mgmt
Financing live
Cash to close
- Down payment
- $43,725
- Closing costs
- $5,247
- Reserves months
- —
- Total cash needed
- —
Loan-product check · same deal, 3 products live
Conventional
25% down · 7.5% · 30yr
- Down + closing
- —
- Monthly P&I
- —
- Monthly cashflow
- —
- DSCR
- —
- Eligible?
- —
Personal DTI + credit; lowest rate.
DSCR
20% down · 8.5% · 30yr
- Down + closing
- —
- Monthly P&I
- —
- Monthly cashflow
- —
- DSCR
- —
- Eligible?
- —
No personal income docs; deal must DSCR.
Hard money
10% down · 12.0% · 12mo
- Down + closing
- —
- Monthly P&I
- —
- Monthly cashflow
- —
- DSCR
- —
- Eligible?
- —
Short-term bridge; refi at stabilization.
Listing history 19 events
-
2026-06-21days on market $174,900 Active 193 DOM
-
2026-06-21days on market $174,900 Active 192 DOM
-
2026-06-18days on market $174,900 Active 190 DOM
-
2026-06-17days on market $174,900 Active 189 DOM
-
2026-06-16days on market $174,900 Active 188 DOM
-
2026-06-15days on market $174,900 Active 187 DOM
-
2026-06-13days on market $174,900 Active 185 DOM
-
2026-06-12days on market $174,900 Active 184 DOM
-
2026-06-09days on market $174,900 Active 181 DOM
-
2026-06-08days on market $174,900 Active 180 DOM
-
2026-06-07days on market $174,900 Active 179 DOM
-
2026-06-05days on market $174,900 Active 177 DOM
-
2026-06-04days on market $174,900 Active 175 DOM
-
2026-06-02days on market $174,900 Active 174 DOM
-
2026-06-01days on market $174,900 Active 173 DOM
-
2026-05-31days on market $174,900 Active 172 DOM
-
2026-05-31days on market $174,900 Active 171 DOM
-
2026-05-05price $174,900 307-char remark
Show marketing remark (307 chars)
Solid 3-bedroom, 2-bath home in a central location near schools and parks. The home offers a practical layout and generous living spaces, with plenty of potential for updates to make it your own. A great opportunity for buyers looking to add value while enjoying a convenient, well-established neighborhood.
-
2025-12-10$179,900 Active 307-char remark
Show marketing remark (307 chars)
Solid 3-bedroom, 2-bath home in a central location near schools and parks. The home offers a practical layout and generous living spaces, with plenty of potential for updates to make it your own. A great opportunity for buyers looking to add value while enjoying a convenient, well-established neighborhood.
ⓘ Source: listings_history table (triggers on properties + properties_extension) + one-shot
backfill from property_details.listing_events for pre-trigger history.
Tax reassessment forecast IA · Partial reset (capped growth)
- Current annual tax
- $1,728 · $144/mo
- Projected year-2 tax
- $2,237 · $186/mo
- Expected delta
- +$509/yr (+$42/mo · 29.5%)
ⓘ Screening estimate from a state-policy table — verify with the county assessor before closing.
Climate risk First Street
- Flood 1/10 Low FEMA zone X (unshaded) · 0% chance over 30 yrs
- Wildfire 1/10 Low
- Heat 3/10 Moderate 7 d/yr ≥101°F today · 14 d/yr by 30 yrs out
- Wind 2/10 Low
- Air quality 1/10 Low 0 unhealthy d/yr today · 0 by 30 yrs out
Nearby sold comps map
Loading sold comps map…
Walkable amenities ~0.75 mi
Loading nearby amenities…
Taxation est. · year 1
- Rental income
- $15,726
- − Mortgage interest
- −$9,797
- − Property taxes
- −$1,728
- − Insurance
- −$874
- − Repairs & maintenance
- −$1,258
- − Management
- −$1,258
- − Depreciation
- −$5,088
- Taxable loss
- −$4,278
- Est. tax savings @ 24.0%
- +$1,027
- After-tax cash flow
- $-159/yr
For passive investors: Depreciation is non-cash, so a rental often shows a tax loss while cash-flowing — sheltering income. Rental losses are passive: they offset passive income freely, and up to $25,000/yr can offset ordinary (W-2) income if you actively participate and your MAGI is under $100k (phasing out to $0 by $150k); unused losses carry forward. On sale, claimed depreciation is recaptured at up to 25%, and gains may owe capital-gains tax (a 1031 exchange can defer both). Figures are a year-1 estimate at your 24.0% rate — not tax advice; consult a CPA.
Schools (NCES district)
- District
- Sheldon Community School District
- NCES district ID
- 1925980
- Math proficiency
- 74% ▼ -4.00%
- Reading proficiency
- 78% ▬ 0.00%
- Median HH income
- $50,644
- Composite
- 64.39/100
- National rank
- #545
- State rank
- #63 of 289 in IA
Livability — Sheldon
- Score
- 84/100
- State rank
- #23
- US rank
- #688
Category grades
Schools grade is shown separately in the Schools card above.
Census & demographics
- Census place
- Sheldon, IA
- City population
- 6,226
- Population (ZIP)
- 6,226
Population outlook (O'Brien County) Hauer SSP2
- Today (2025)
- 13,353 people
- By 2030
- 13,040 · -2.3%
- By 2040
- 12,422 · -7.0%
- By 2050
- 11,887 · -11.0%
- By 2075
- 11,132 · -16.6%
- By 2100
- 10,176 · -23.8%
Race, ethnicity, and origin ACS 2023
- Neighborhood character
- Predominantly White (81%)
- Race & ethnicity
- White 81% Hispanic / Latino 14% Two or more races 8% Black 2% Asian 1%
- Hispanic origin (detail)
- Mexican 4% Puerto Rican 2%
- Common ancestry
- Iranian 24% Portuguese 6% Ukrainian 2%
- Foreign-born
- 8% · Canada
- Languages at home
- 88% English-only · Spanish 10% Arabic 2%
Political lean MEDSL · O'Brien
- 2024 margin
- Solid R (+60.9) · D 19.0% · R 80.0% · Other 1.0%
- 2008→2024 swing
- -26.1pp toward R · 2008: -34.9pp · 2024: -60.9pp
- All cycles
- 2024: R+60.9 2020: R+56.8 2016: R+60.2 2012: R+45.2 2008: R+34.9
Not yet ingested
- Civics
- —
Market trends
- HPI YoY
- ▼ -75.15%
- Current HPI
- 214.5955
- Rent YoY
- —
- Metro
- —
- State GDP YoY
- ▲ 2.48%
- F500 in state
- 4
Industry mix (Fortune 500 HQ in IA)
| Industry | F500 HQs | Revenue |
|---|---|---|
| Financial Services | 1 | $16B |
|
||
| Retail / Convenience | 1 | $15B |
|
||
Price history
-2.8% since first listed2 events — show timeline
- 2026-05-05 Price Changed $174,900 NWIA
- 2025-12-10 Listed $179,900 NWIA
Property tax history
+3.9%/yrLatest (2025): $1,728 · -3.7% YoY. Source: county tax records.
Cash-flow waterfall
monthlySold comps — $/sqft
last 12 mo · ≤1 miLoading sold comps…