420 Kelly Ln · Seven Points, TX
Flood risk 1/10 · Minimal
- FEMA flood zone
- X (unshaded)
- Chance of flooding over 30 yrs
- 0.0%
- Est. flood insurance / yr
- $507 – $1,088
Fire risk 4/10 · Minor
- Est. fire insurance / yr
- $1,222 – $2,270
Heat risk 7/10 · Major
- Hot days now (above 110°F)
- 7 days/yr
- Hot days in 30 yrs
- 27 days/yr
Wind risk 6/10 · Moderate
- Chance of severe wind over 30 yrs
- 58.0%
Air-quality risk 2/10 · Minimal
- Unhealthy air days now
- 0 days/yr
- Unhealthy air days in 30 yrs
- 1 days/yr
Risk factors via First Street. Map © Google.
Why this score? — see what drove the B- grade
The composite is a weighted blend of 9 inputs, each scored 0–100. Each bar is that input's sub-score; the figure is the points it added to the 100-point composite (weight × sub-score).
- Cash flow +27.4/30.0
- DSCR +9.6/10.0
- ARV discount +8.7/15.0
- 1% rule +7.4/10.0
- Condition / age +4.8/5.0
- Schools +3.8/10.0
- Livability +3.0/5.0
- Rent growth +2.5/5.0
- Appreciation +0.0/10.0
$229,000
🖨 Deal sheet (PDF) 📄 Offer letter ✓ Due diligence
Listing remarks MLS
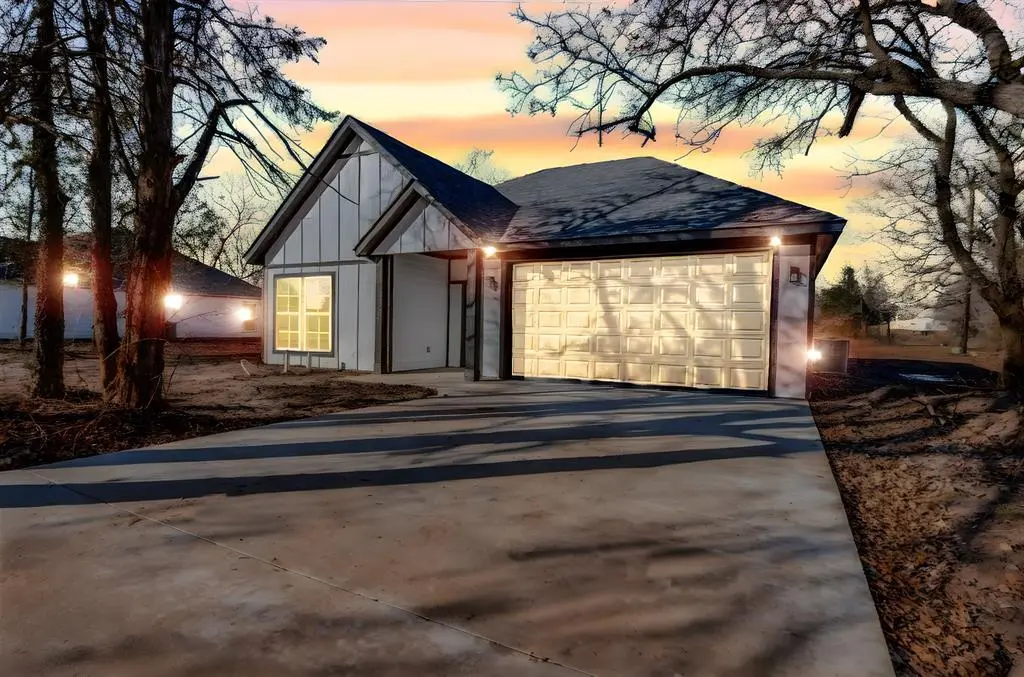
Welcome to this charming, brand-new, meticulously designed home on a CORNER LOT that offers an open floor plan with stunning attention to detail that defines modern luxury living LOCATED 3 MINUTES FROM CEDAR CREEK LAKE! Upon entering, the open floor plan immediately captures your attention. The spacious living offers cathedral cielings and flows effortlessly into the dining and kitchen spaces, creating an environment perfect for both relaxation and entertaining. The primary bedroom is a serene retreat overlooking the backyard. Additional two bedrooms are equally well-appointed, offering walk-in closets. The two-car garage is seamlessly integrated into the home providing both functionality and appeal.
Key facts
- Open floor plan
- Cathedral ceilings
- Walk-in closets
Tags
Neighborhood map
What this means for you Summary
Snapshot
- This is a 3-bed/2.0-bath single-family listed at $229k. Condition is rated excellent.
Deal economics
- At list price, monthly cash flow is $669 ($8k/yr) — positive.
- The deal already cash-flows at list — no discount required.
- Meets the 1% rule at list price ($3k rent vs $229k).
- Recommended offer: $202k (12.0% below list) — sets the bar for market timing.
- Cap rate 9.8% vs local median 3.1% in Seven Points — top-decile yield for the area; either an underpriced asset or a hidden risk that comps aren't pricing in. Stress-test before assuming the spread holds.
Location & tenants
- Location reads 60/100 on livability (#1,063 in TX) — a middle-class / working-renter tenant base. Strengths: cost of living A+, housing A+, crime B+; Watch: employment D, schools F, amenities F.
- Mabank ISD (town): math 47% / reading 44% proficiency, ranked #273 of 826 in TX (top 33%) — families likely to look elsewhere, expect single-tenant / working-renter base with shorter leases.
- Market conditions: 441 active listings in the ZIP; 1 comparable units currently listed for rent nearby; 263 units permitted in Henderson County in 2024 (0 in 5+ unit buildings).
Forward outlook
- Local home prices are declining (-3.0%/yr); year-one equity from $2k of loan paydown is wiped out by about $7k of value loss. Plan a longer hold.
- At projected returns (-3.0% appreciation + 3.0% rent growth), your $64k cash investment doubles in ~10 years — after that, you're playing with house money.
Negotiation context
- It's been on market 153 days — a 12% lower offer ($202k) is reasonable based on typical stale-listing flexibility.
- 5 sale attempts since 2y ago; this cycle's ask has dropped $30k (12%) from the opening price — seller is motivated, your offer sets the floor, not the list.
Risks & watch-outs
- Climate carrying-cost: major wind risk, 58% chance of damaging wind over 30y; extreme-heat days projected 7→27/yr by 2055 (HVAC capex compounding) — expect insurance premiums to compound above CPI over the hold.
Questions for the listing agent
- It's been on market 153 days. Have you received any prior offers? Is the seller open to a 12% concession, seller financing, or rate buy-down credit?
- Why hasn't it sold? Are there any deal-killer items the seller is aware of (foundation, flood, title, zoning, code violations)?
- Is there a deadline driving the sale (1031 exchange, divorce, estate, relocation)? That informs how much negotiation room exists.
- Schools are F-rated, which usually means shorter tenancies and higher turnover. Who's the typical renter profile here, and what's been the actual vacancy rate?
- What's the average days-on-market for RENTAL listings here right now (not sales)? A rising rental-DOM trend means longer vacancies and softer asking-rent achievability than the comps imply.
- What's the recent tenant-quality profile in this submarket — average credit score on applications, eviction rate, late-payment / NSF rate, and stable-employment percentage? A property-management company in the area should have these aggregated.
- How much new for-sale + rental construction is in the pipeline within 1–3 miles? Heavy new supply typically softens prices + rents 12–24 months out; constrained supply supports both.
Investment metrics
- 1% rule
- 1.24% ✓
- Cap rate
- 9.80%
- Cash-on-cash
- 12.52%
- DSCR
- 1.56
- GRM
- 6.7
CMA / ARV
- ARV (median comp)
- $235,355
- List price
- $229,000
- Delta
- -2.70%
- Verdict
- FAIR
- Comps
- 20 within 1.0 mi
Show comp detail 4 sales within ~0.75 mi
| Address | Dist | Beds/Ba | Sqft | Sold | Price | $/sf | Match |
|---|---|---|---|---|---|---|---|
| 304 Pine St | 0.71mi | 3/2.0 | 1,320 (-6%) | 1mo | $239,999 | $182 | 57 |
| 201 Causeway Cv | 0.72mi | 3/2.0 | 1,360 (-3%) | 23mo | $260,000 | $191 | 43 |
| 3005 Arnold Hills Rd | 0.59mi | 3/2.0 | 1,260 (-10%) | 19mo | $179,500 | $142 | 40 |
| 216 Causeway Cv | 0.71mi | 3/2.5 | 1,230 (-12%) | 18mo | $259,900 | $211 | 30 |
Match score weights: distance 35% · size 25% · config 20% · recency 20%. Top-matched comps best support the ARV.
Projected returns pro-forma
-3.0% appreciation · 3.0% rent growth · sell at horizon
- IRR
- 2.3%
- Equity multiple
- 1.09×
- Total profit
- $5,540
- Equity at exit
- $34,145
- IRR
- 11.8%
- Equity multiple
- 1.93×
- Total profit
- $59,859
- Equity at exit
- $19,800
Cash invested: $64,120 (down + closing). Projections, not guarantees.
Landlord ↔ Tenant lean methodology
- Overall (STATE)
- 87 Strongly Landlord-Friendly
- State Texas
- 87 Strongly Landlord-Friendly · R+5
- County
- — inherits STATE
- City
- — inherits STATE
ZIP-level market 75143
- Home prices YoY
- -11.4%
- Active inventory
- 441
- Price-to-rent
- 6.7×
Monthly cashflow live
- Estimated rent
- $2,850 medium interval (Pro) →
- Mortgage (P&I)
- −$1,201
- Tax est. 1.5%
- −$286 /mo · $3,435/yr
- Insurance
- −$95
- HOA
- −$0
- Vacancy / Maint / Mgmt
- −$598
- Net cashflow
- $669
Break-even live
Sensitivity live
| Price | -10% $827 | -5% $748 | +0% $669 | +5% $590 | +10% $511 |
|---|---|---|---|---|---|
| Rent | -10% $444 | -5% $556 | +0% $669 | +5% $782 | +10% $894 |
| Rate | -1.0pp $784 | -0.5pp $727 | base $669 | +0.5pp $610 | +1.0pp $549 |
UW: 25.0% down · 7.5% · 30yr · 1.5% tax · 5.0% vac · 8.0% maint · 8.0% mgmt
Financing live
Cash to close
- Down payment
- $57,250
- Closing costs
- $6,870
- Reserves months
- —
- Total cash needed
- —
Loan-product check · same deal, 3 products live
Conventional
25% down · 7.5% · 30yr
- Down + closing
- —
- Monthly P&I
- —
- Monthly cashflow
- —
- DSCR
- —
- Eligible?
- —
Personal DTI + credit; lowest rate.
DSCR
20% down · 8.5% · 30yr
- Down + closing
- —
- Monthly P&I
- —
- Monthly cashflow
- —
- DSCR
- —
- Eligible?
- —
No personal income docs; deal must DSCR.
Hard money
10% down · 12.0% · 12mo
- Down + closing
- —
- Monthly P&I
- —
- Monthly cashflow
- —
- DSCR
- —
- Eligible?
- —
Short-term bridge; refi at stabilization.
Rent comps 1 comps
| Address | Beds | Baths | Sqft | Rent | $/sqft | DOM | Units | Dist |
|---|---|---|---|---|---|---|---|---|
| 1340 E Cedar Creek Pkwy Kemp, TX | 3.0 | 2.0 | 1330 | $2,850 | $2.14 | 44d | 1 | 1.08mi |
Listing history 28 events
-
2026-06-19days on market $229,000 Active 153 DOM
-
2026-06-18days on market $229,000 Active 152 DOM
-
2026-06-17days on market $229,000 Active 151 DOM
-
2026-06-16days on market $229,000 Active 150 DOM
-
2026-06-15days on market $229,000 Active 149 DOM
-
2026-06-14days on market $229,000 Active 147 DOM
-
2026-06-12pricedays on market $229,000 Active 146 DOM
-
2026-06-09days on market $248,000 Active 143 DOM
-
2026-06-08days on market $248,000 Active 142 DOM
-
2026-06-07days on market $248,000 Active 141 DOM
-
2026-06-05days on market $248,000 Active 138 DOM
-
2026-06-03days on market $248,000 Active 137 DOM
-
2026-06-02days on market $248,000 Active 136 DOM
-
2026-06-01days on market $248,000 Active 135 DOM
-
2026-05-31days on market $248,000 Active 134 DOM
-
2026-05-30days on market $248,000 Active 133 DOM
-
2026-03-25price $248,000 709-char remark
Show marketing remark (709 chars)
Welcome to this charming, brand-new, meticulously designed home on a CORNER LOT that offers an open floor plan with stunning attention to detail that defines modern luxury living LOCATED 3 MINUTES FROM CEDAR CREEK LAKE! Upon entering, the open floor plan immediately captures your attention. The spacious living offers cathedral cielings and flows effortlessly into the dining and kitchen spaces, creating an environment perfect for both relaxation and entertaining. The primary bedroom is a serene retreat overlooking the backyard. Additional two bedrooms are equally well-appointed, offering walk-in closets. The two-car garage is seamlessly integrated into the home providing both functionality and appeal.
-
2026-01-17$259,000 Active 709-char remark
Show marketing remark (709 chars)
Welcome to this charming, brand-new, meticulously designed home on a CORNER LOT that offers an open floor plan with stunning attention to detail that defines modern luxury living LOCATED 3 MINUTES FROM CEDAR CREEK LAKE! Upon entering, the open floor plan immediately captures your attention. The spacious living offers cathedral cielings and flows effortlessly into the dining and kitchen spaces, creating an environment perfect for both relaxation and entertaining. The primary bedroom is a serene retreat overlooking the backyard. Additional two bedrooms are equally well-appointed, offering walk-in closets. The two-car garage is seamlessly integrated into the home providing both functionality and appeal.
-
2025-12-05historical
-
2025-10-01$270,000 Active
-
2025-09-30historical
-
2025-06-08status Active
-
2025-06-05status Pending
-
2025-04-17price $270,000
-
2025-03-21status Active
-
2025-03-03historical Active Option Contract
-
2025-01-15price $283,500
-
2024-11-27$289,500 Active
ⓘ Source: listings_history table (triggers on properties + properties_extension) + one-shot
backfill from property_details.listing_events for pre-trigger history.
Climate risk First Street
- Flood 1/10 Low FEMA zone X (unshaded) · 0% chance over 30 yrs
- Wildfire 4/10 Moderate
- Heat 7/10 Severe 7 d/yr ≥110°F today · 27 d/yr by 30 yrs out
- Wind 6/10 Major 58% chance of damaging wind over 30 yrs
- Air quality 2/10 Low 0 unhealthy d/yr today · 1 by 30 yrs out
Nearby sold comps map
Loading sold comps map…
Walkable amenities ~0.75 mi
Loading nearby amenities…
Taxation est. · year 1
- Rental income
- $34,200
- − Mortgage interest
- −$12,828
- − Property taxes
- −$3,435
- − Insurance
- −$1,145
- − Repairs & maintenance
- −$2,736
- − Management
- −$2,736
- − Depreciation
- −$6,662
- Taxable income
- $4,659
- Est. tax owed @ 24.0%
- −$1,118
- After-tax cash flow
- $6,909/yr
For passive investors: Depreciation is non-cash, so a rental often shows a tax loss while cash-flowing — sheltering income. Rental losses are passive: they offset passive income freely, and up to $25,000/yr can offset ordinary (W-2) income if you actively participate and your MAGI is under $100k (phasing out to $0 by $150k); unused losses carry forward. On sale, claimed depreciation is recaptured at up to 25%, and gains may owe capital-gains tax (a 1031 exchange can defer both). Figures are a year-1 estimate at your 24.0% rate — not tax advice; consult a CPA.
Condition & rehab AI · 1 photo
This brand-new, meticulously designed home on a corner lot is in excellent condition with no visible repairs or maintenance needed. It offers an open floor plan, modern kitchen, and well-maintained bathrooms, making it an ideal investment for both resale and rental.
Value-add opportunities
- Both Painting exterior and interior walls — Enhances curb appeal and interior aesthetics.
- Both Landscaping improvements — Enhances curb appeal and adds value.
- Both New flooring in bathrooms — Improves functionality and aesthetics in high-traffic areas.
Renovation cost estimate screening
Value-add ROI direction
- Both Painting exterior and interior walls — Enhances curb appeal and interior aesthetics. ↑
- Both Landscaping improvements — Enhances curb appeal and adds value. ↑
- Both New flooring in bathrooms — Improves functionality and aesthetics in high-traffic areas. ↑
ⓘ Cost ranges are severity-bucket heuristics (US national rule-of-thumb). Get contractor quotes + a written scope before underwriting a rehab budget.
Schools (NCES district)
- District
- Mabank ISD
- NCES district ID
- 4828680
- Math proficiency
- 47% ▼ -19.00%
- Reading proficiency
- 44% ▼ -11.00%
- Median HH income
- $40,321
- Composite
- 38.15/100
- National rank
- #4267
- State rank
- #273 of 826 in TX
Livability — Seven Points
- Score
- 60/100
- State rank
- #1063
- US rank
- #18899
Category grades
Schools grade is shown separately in the Schools card above.
Census & demographics
- Census place
- Seven Points, TX
- Population (ZIP)
- 14,676
Population outlook (Henderson County) Hauer SSP2
- Today (2025)
- 80,471 people
- By 2030
- 80,608 · +0.2%
- By 2040
- 80,087 · -0.5%
- By 2050
- 78,208 · -2.8%
- By 2075
- 72,423 · -10.0%
- By 2100
- 61,012 · -24.2%
Race, ethnicity, and origin ACS 2023
- Neighborhood character
- Predominantly White (80%)
- Race & ethnicity
- White 80% Hispanic / Latino 13% Two or more races 8% Black 2%
- Hispanic origin (detail)
- Mexican 13%
- Common ancestry
- Italian 2% Iranian 2% Lithuanian 1%
- Foreign-born
- 4% · Canada, China
- Languages at home
- 90% English-only · Spanish 9%
Political lean MEDSL · Henderson
- 2024 margin
- Solid R (+63.5) · D 18.0% · R 81.4%
- 2008→2024 swing
- -18.8pp toward R · 2008: -44.6pp · 2024: -63.5pp
- All cycles
- 2024: R+63.5 2020: R+60.2 2016: R+60.0 2012: R+54.8 2008: R+44.6
Not yet ingested
- Civics
- —
Market trends
- HPI YoY
- ▼ -42.99%
- Current HPI
- 332.57
- Rent YoY
- —
- Metro
- —
- State GDP YoY
- ▲ 3.95%
- F500 in state
- 110
Industry mix (Fortune 500 HQ in TX)
| Industry | F500 HQs | Revenue |
|---|---|---|
| Energy | 16 | $1,198B |
|
||
| Technology | 5 | $198B |
|
||
| Engineering / Construction | 4 | $72B |
|
||
| Energy Services | 3 | $60B |
|
||
| Utilities | 3 | $41B |
|
||
| Healthcare | 2 | $330B |
|
||
Price history
-14.3% since first listed12 events — show timeline
- 2026-03-25 Price Changed $248,000 NTREIS
- 2026-01-17 Listed $259,000 NTREIS
- 2025-12-05 Listing Removed — NTREIS
- 2025-10-01 Listed $270,000 NTREIS
- 2025-09-30 Listing Removed — NTREIS
- 2025-06-08 Relisted — NTREIS
- 2025-06-05 Pending — NTREIS
- 2025-04-17 Price Changed $270,000 NTREIS
- 2025-03-21 Relisted — NTREIS
- 2025-03-03 Contingent — NTREIS
- 2025-01-15 Price Changed $283,500 NTREIS
- 2024-11-27 Listed $289,500 NTREIS
Cash-flow waterfall
monthlySold comps — $/sqft
last 12 mo · ≤1 miLoading sold comps…