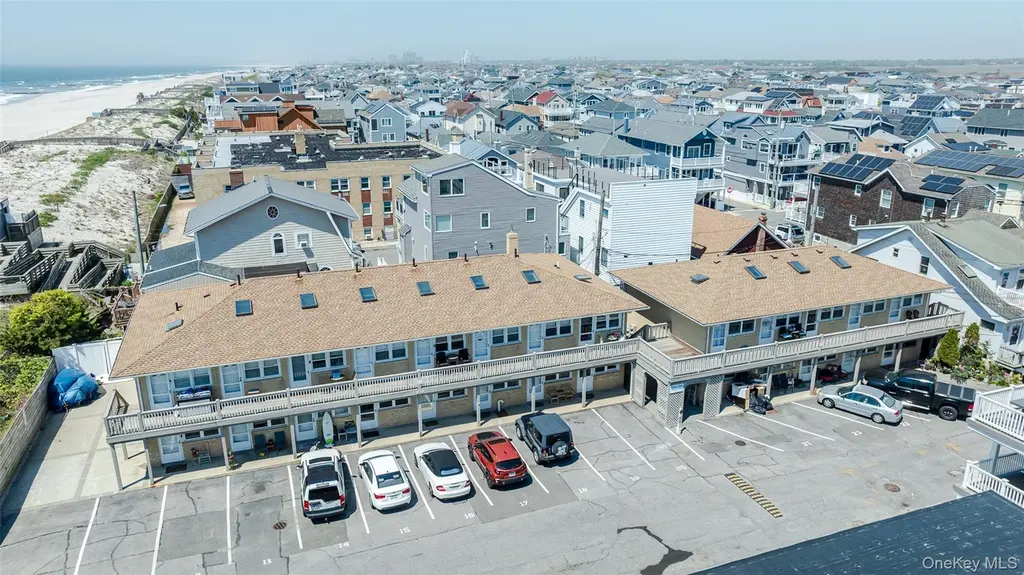
979 Oceanfront #17 · Long Beach, NY
Flood risk 6/10 · Moderate
- FEMA flood zone
- VE
- Chance of flooding over 30 yrs
- 0.86%
- Est. flood insurance / yr
- $5,013 – $11,043
Fire risk 2/10 · Minimal
- Est. fire insurance / yr
- $691 – $1,283
Heat risk 6/10 · Moderate
- Hot days now (above 95°F)
- 7 days/yr
- Hot days in 30 yrs
- 16 days/yr
Wind risk 8/10 · Major
- Chance of severe wind over 30 yrs
- 80.0%
Air-quality risk 4/10 · Minor
- Unhealthy air days now
- 4 days/yr
- Unhealthy air days in 30 yrs
- 6 days/yr
Risk factors via First Street. Map © Google.
Why this score? — see what drove the B grade
The composite is a weighted blend of 9 inputs, each scored 0–100. Each bar is that input's sub-score; the figure is the points it added to the 100-point composite (weight × sub-score).
- Cash flow +27.3/30.0
- DSCR +9.5/10.0
- 1% rule +8.8/10.0
- ARV discount +7.5/15.0
- Schools +5.9/10.0
- Livability +4.1/5.0
- Condition / age +4.0/5.0
- Rent growth +3.7/5.0
- Appreciation +0.0/10.0
$315,000
🖨 Deal sheet 📄 Offer letter ✓ Due diligence
Listing remarks
Welcome to a rare opportunity to own a pristine studio in the oceanfront Sandy Reef Condominium Complex in the heart of Long Beach’s coveted West End. This beautifully renovated 1st floor unit offers the ultimate beachside lifestyle with the convenience of an assigned parking spot which is an exceptional find in this location. This unit features an open living space, kitchen with quartz counters and stainless steel appliances and a sparkling bathroom. Located just moments from the West End’s vibrant restaurants, local shops, and Long Beach’s iconic boardwalk, this condo blends coastal charm with everyday convenience. The Sandy Reef Condo has a common laundry room, is pet-f
Key facts
- Pet-friendly
- Common laundry room
- $350 HOA
Tags
Property features AI
Finance
- HOA & community: Sandy Reef association; Monthly association fee of $350; Association covers common area maintenance, exterior maintenance, gas, heat, sewer, snow removal, trash and water; Association amenities include grounds maintenance, parking, snow removal and trash
Exterior
- Parking: Assigned parking (1 space)
- Utilities: Electric service by PSEG; Public sewer; Cable connected; Electricity connected; Natural gas connected; Sewer connected; Trash collection (public); Water connected
- Home design: Condominium; One-level living with 2-story building; Entry on first floor
- Construction: Brick construction; Actual property condition
- Exterior features: Brick exterior; Views; Near golf course; Near public transit; Near schools; Near shops; Waterfront (property noted as waterfront in lot features)
Interior
- Kitchen: Gas range; Refrigerator; Stainless steel appliances
- Bedrooms: One bedroom (located on entry level)
- Bathrooms: 1 full bathroom
- Heating & cooling: Oil heating; Wall/window AC unit(s)
- Interior features: Open floorplan; Open kitchen; Skylight(s); Outdoor space
- Laundry & utility: Common area laundry; Shared laundry room
Neighborhood map
What this means for you Summary
Snapshot
- This is a ?-bed/1.0-bath condo listed at $315k. Condition is rated good.
Deal economics
- At list price, monthly cash flow is $241 ($3k/yr) — positive.
- The deal already cash-flows at list — no discount required.
- Meets the 1% rule at list price ($4k rent vs $315k).
- Cap rate 9.8% vs local median 2.1% in Long Beach — top-decile yield for the area; either an underpriced asset or a hidden risk that comps aren't pricing in. Stress-test before assuming the spread holds.
Location & tenants
- Location reads 82/100 on livability (#84 in NY, #1,285 nationally) — a professional / high-income tenant draw. Strengths: crime A+, commute A+, employment A+; Watch: cost of living F.
- Long Beach City School District (suburban): math 66% / reading 65% proficiency, ranked #150 of 590 in NY (top 25%) — acceptable for families but not a draw, mixed tenant base, ~2y average lease.
- Zoned schools: West Elementary School (math 72% / reading 72%, grade A-, #378 of 2,108 statewide, top 20%, 301 students, 24% FRL); Long Beach Middle School (math 39% / reading 61%, grade C, #261 of 729 statewide, top 36%, 721 students, 25% FRL); Long Beach High School (math 91% / reading 75%, grade A, #440 of 1,100 statewide, top 40%, 1,314 students, 31% FRL) — zoned schools at 26% FRL track the district average.
- Market conditions: Rents rising fast (+4.8%/yr); 352 active listings in the ZIP; 40 comparable units currently listed for rent nearby; rentals at typical pace (median 22d on market — plan ~3-4 weeks tenant-placement turnaround); high-income renter base; 824 units permitted in Nassau County in 2024 (153 in 5+ unit buildings).
- This rent runs 37% of the median local income ($142k/yr) — at the standard rent-burdened threshold; future hikes will face affordability resistance.
Forward outlook
- Local home prices are declining (-3.0%/yr); year-one equity from $2k of loan paydown is wiped out by about $9k of value loss. Plan a longer hold.
- Nassau County population projected at +7% by 2050 — modest demand growth; plan on rents tracking national, not racing it.
Negotiation context
- Only 13 days on market — expect competitive offers; lowballing is unlikely to land.
- 3 sale attempts since 3y ago with the ask held roughly flat each time — persistent listings suggest the price (not the market) is what's stuck; bring a comps-based counter.
Risks & watch-outs
- Watch-outs: flood insurance adds $669/mo.
- Climate carrying-cost: in FEMA flood zone VE (mandatory federal flood insurance); severe wind risk, 80% chance of damaging wind over 30y; extreme-heat days projected 7→16/yr by 2055 (HVAC capex compounding) — expect insurance premiums to compound above CPI over the hold.
Questions for the listing agent
- Built in 1970 — when were the roof, HVAC, electrical panel, plumbing, and water heater last replaced?
- What's the actual annual flood-insurance premium (NFIP or private), and is the property in a SFHA with mandatory coverage?
- What does the HOA fee cover, when was the last increase, and are there any pending special assessments or reserve-fund shortfalls?
- Any open or pending special assessments — roof, HVAC, plumbing, elevator, façade? What's the per-unit balance and payoff schedule, and is the seller paying it off at close or rolling it to the buyer?
- Is there a deadline driving the sale (1031 exchange, divorce, estate, relocation)? That informs how much negotiation room exists.
- Schools are A-rated — typically a magnet for longer-tenancy family renters. What's the average tenant stay here, and is there a school-zone premium baked into asking?
- What's the average days-on-market for RENTAL listings here right now (not sales)? A rising rental-DOM trend means longer vacancies and softer asking-rent achievability than the comps imply.
- What's the recent tenant-quality profile in this submarket — average credit score on applications, eviction rate, late-payment / NSF rate, and stable-employment percentage? A property-management company in the area should have these aggregated.
- How much new apartment / multifamily construction is in the pipeline within 1–3 miles? Heavy new supply (>2% of stock underway) typically softens rents 12–24 months out; light construction supports rent growth.
Investment metrics
- 1% rule
- 1.38% ✓
- Cap rate
- 9.76%
- Cash-on-cash
- 12.39%
- DSCR
- 1.55
- GRM
- 6.0
CMA / ARV
No comps found within radius.
Projected returns pro-forma
-3.0% appreciation · 4.84% rent growth · sell at horizon
- IRR
- -8.0%
- Equity multiple
- 0.70×
- Total profit
- $-26,774
- Equity at exit
- $46,968
- IRR
- 4.7%
- Equity multiple
- 1.39×
- Total profit
- $34,244
- Equity at exit
- $27,235
Cash invested: $88,200 (down + closing). Projections, not guarantees.
Landlord ↔ Tenant lean methodology
- Overall (STATE)
- 15 Strongly Tenant-Friendly
- State New York
- 15 Strongly Tenant-Friendly · D+10
- County
- — inherits STATE
- City
- — inherits STATE
ZIP-level market 11561
- Rents YoY
- 4.8%
- Active inventory
- 352
- Price-to-rent
- 6.0×
Monthly cashflow live
- Estimated rent
- $4,351 high interval (Pro) →
- Mortgage (P&I)
- −$1,652
- Tax est. 1.5%
- −$394 /mo · $4,725/yr
- Insurance
- −$131
- Flood insurance flood zone
- −$669 /mo · $8,028/yr
- HOA
- −$350
- Vacancy / Maint / Mgmt
- −$914
- Net cashflow
- $241
Break-even live
UW: 25.0% down · 7.5% · 30yr · 1.5% tax · 5.0% vac · 8.0% maint · 8.0% mgmt
Financing live
Cash to close
- Down payment
- $78,750
- Closing costs
- $9,450
- Reserves months
- —
- Total cash needed
- —
Loan-product check · same deal, 3 products live
Conventional
25% down · 7.5% · 30yr
- Down + closing
- —
- Monthly P&I
- —
- Monthly cashflow
- —
- DSCR
- —
- Eligible?
- —
Personal DTI + credit; lowest rate.
DSCR
20% down · 8.5% · 30yr
- Down + closing
- —
- Monthly P&I
- —
- Monthly cashflow
- —
- DSCR
- —
- Eligible?
- —
No personal income docs; deal must DSCR.
Hard money
10% down · 12.0% · 12mo
- Down + closing
- —
- Monthly P&I
- —
- Monthly cashflow
- —
- DSCR
- —
- Eligible?
- —
Short-term bridge; refi at stabilization.
Rent comps 40 comps
| Address | Beds | Baths | Sqft | Rent | $/sqft | DOM | Units | Dist |
|---|---|---|---|---|---|---|---|---|
| 1 Tennessee Ave Long Beach, NY | 1.0 | 1.0 | 1929 | $19,000 | $9.85 | 24d | 1 | 0.06mi |
| 17 Louisiana St Long Beach, NY | 1.0 | 1.0 | 350 | $2,200 | $6.29 | 14d | 1 | 0.09mi |
| 1051 Oceanfront #7 Long Beach, NY | 3.0 | 2.5 | — | $20,000 | — | 17d | 1 | 0.15mi |
| 949 W Beech St Unit UPPER Long Beach, NY | 1.0 | 1.5 | 1872 | $2,850 | $1.52 | 8d | 1 | 0.16mi |
| 65 New Hampshire St Long Beach, NY | 3.0 | 2.0 | 2116 | $22,500 | $10.63 | 8d | 1 | 0.18mi |
| 43 Kentucky St Long Beach, NY | 3.0 | 2.5 | 1804 | $3,400 | $1.88 | 18d | 1 | 0.18mi |
| 43 Kentucky St Long Beach, NY | 3.0 | 1.0 | 1500 | $3,500 | $2.33 | 44d | 1 | 0.18mi |
| 15 Georgia Ave Unit 2 Long Beach, NY | 1.0 | 1.0 | 600 | $2,400 | $4.00 | 44d | 1 | 0.18mi |
| 32 Florida St Long Beach, NY | 2.0 | 1.0 | 880 | $3,450 | $3.92 | 1d | 1 | 0.20mi |
| 1113 Oceanfront Long Beach, NY | 1.0 | 1.0 | 500 | $3,200 | $6.40 | 5d | 1 | 0.21mi |
| 62 Kentucky St Long Beach, NY | 1.0 | 1.0 | 600 | $2,300 | $3.83 | 44d | 1 | 0.21mi |
| 52 Florida St #17 Long Beach, NY | 1.0 | 1.0 | — | $2,200 | — | 19d | 1 | 0.23mi |
| 77 Kentucky St Unit Upper Long Beach, NY | 3.0 | 1.0 | 800 | $3,500 | $4.38 | 22d | 1 | 0.26mi |
| 27 Illinois Ave Long Beach, NY | 3.0 | 1.0 | 1000 | $3,750 | $3.75 | 44d | 1 | 0.28mi |
| 26 Ohio Ave Unit lower Long Beach, NY | 2.0 | 2.0 | — | $4,000 | — | 12d | 1 | 0.28mi |
| 100 Vermont St Long Beach, NY | 2.0 | 1.5 | — | $3,800 | — | 44d | 1 | 0.29mi |
| 1107 Ocean Blvd Long Beach, NY | 1.0 | 1.0 | 506 | $3,200 | $6.32 | 44d | 1 | 0.31mi |
| 47 Ohio Ave Unit G Long Beach, NY | 2.0 | 1.0 | 800 | $3,350 | $4.19 | 1d | 1 | 0.32mi |
| 69 Illinois Ave Long Beach, NY | 3.0 | 1.0 | 1070 | $3,800 | $3.55 | 17d | 1 | 0.33mi |
| 63 Ohio Ave Long Beach, NY | 3.0 | 2.0 | 1730 | $25,000 | $14.45 | 17d | 1 | 0.35mi |
| 103 Florida St Unit Upper Long Beach, NY | 1.0 | 1.0 | 1463 | $2,500 | $1.71 | 24d | 1 | 0.35mi |
| 90 Oregon St Long Beach, NY | 2.0 | 1.0 | 798 | $4,000 | $5.01 | 11d | 1 | 0.38mi |
| 24 Pennsylvania Ave Unit Upper Long Beach, NY | 3.0 | 1.0 | 1000 | $9,000 | $9.00 | 24d | 1 | 0.38mi |
| 68 Brookline Ave Unit 2 East Atlantic Beach, NY | 3.0 | 2.0 | 1200 | $15,000 | $12.50 | 22d | 1 | 0.38mi |
| 73 Nebraska St Long Beach, NY | 3.0 | 1.0 | 1092 | $4,200 | $3.85 | 19d | 1 | 0.38mi |
| 100 Ohio Ave Unit 2 Long Beach, NY | 3.0 | 1.0 | 1000 | $4,000 | $4.00 | 44d | 1 | 0.40mi |
| 105 Ohio Ave Long Beach, NY | 3.0 | 1.0 | — | $3,800 | — | 1d | 1 | 0.42mi |
| 23 Troy Ave Unit 1st FL East Atlantic Beach, NY | 2.0 | 1.0 | 1000 | $35,000 | $35.00 | 22d | 1 | 0.48mi |
| 59 Troy Ave East Atlantic Beach, NY | 3.0 | 2.0 | 800 | $5,000 | $6.25 | 1d | 1 | 0.50mi |
| 16 June Walk Long Beach, NY | 3.0 | 1.0 | 1117 | $12,000 | $10.74 | 17d | 1 | 0.52mi |
| 40 Oswego Ave Unit 1 East Atlantic Beach, NY | 2.0 | 1.0 | 880 | $2,850 | $3.24 | 24d | 1 | 0.53mi |
| 46 Bay St East Atlantic Beach, NY | 3.0 | 2.0 | — | $3,850 | — | 2d | 1 | 0.54mi |
| 110 Grand Blvd Unit 4 Long Beach, NY | 1.0 | 1.0 | 800 | $2,600 | $3.25 | 44d | 1 | 0.59mi |
| 206 Grand Blvd Long Beach, NY | 3.0 | 2.5 | 1944 | $17,500 | $9.00 | 19d | 1 | 0.61mi |
| 16 November Walk Long Beach, NY | 3.0 | 2.0 | 1824 | $3,500 | $1.92 | 44d | 1 | 0.67mi |
| 16 November Walk Long Beach, NY | 3.0 | 2.0 | 1824 | $3,500 | $1.92 | 24d | 1 | 0.67mi |
| 631 W Market St Unit 2 Long Beach, NY | 1.0 | 1.0 | 680 | $3,000 | $4.41 | 44d | 1 | 0.79mi |
| 521 W Broadway Unit B Long Beach, NY | 3.0 | 2.0 | 1600 | $4,200 | $2.62 | 44d | 1 | 0.83mi |
| 539 W Park Ave Unit 1 Long Beach, NY | 3.0 | 2.0 | 1200 | $4,300 | $3.58 | 44d | 1 | 0.86mi |
| 475 W Broadway Apt B2 Long Beach, NY | 1.0 | 1.0 | 600 | $2,750 | $4.58 | 3d | 1 | 0.91mi |
HOA detail condo
- Monthly dues
- $350 · $4,200/yr
- Likely covers
- parking
- Assessments
- None detected in remarks — confirm with the listing agent.
Listing history 8 events
-
2026-06-02statusdays on market $315,000 Pending 13 DOM
-
2026-06-01days on market $315,000 Active 12 DOM
-
2026-05-31days on market $315,000 Active 11 DOM
-
2026-05-18$315,000 Active
-
2025-06-27historical $1,875
-
2025-03-08$1,875
-
2024-03-05historical $1,895
-
2023-11-26$1,895
ⓘ Source: listings_history table (triggers on properties + properties_extension) + one-shot
backfill from property_details.listing_events for pre-trigger history.
Climate risk First Street
- Flood 6/10 Major FEMA zone VE · 86% chance over 30 yrs
- Wildfire 2/10 Low
- Heat 6/10 Major 7 d/yr ≥95°F today · 16 d/yr by 30 yrs out
- Wind 8/10 Severe 80% chance of damaging wind over 30 yrs
- Air quality 4/10 Moderate 4 unhealthy d/yr today · 6 by 30 yrs out
Nearby sold comps map
Loading sold comps map…
Walkable amenities ~0.75 mi
Loading nearby amenities…
Taxation est. · year 1
- Rental income
- $52,212
- − Mortgage interest
- −$17,645
- − Property taxes
- −$4,725
- − Insurance
- −$9,603
- − Repairs & maintenance
- −$4,177
- − Management
- −$4,177
- − HOA
- −$4,200
- − Depreciation
- −$9,164
- Taxable loss
- −$1,478
- Est. tax savings @ 24.0%
- +$355
- After-tax cash flow
- $3,252/yr
For passive investors: Depreciation is non-cash, so a rental often shows a tax loss while cash-flowing — sheltering income. Rental losses are passive: they offset passive income freely, and up to $25,000/yr can offset ordinary (W-2) income if you actively participate and your MAGI is under $100k (phasing out to $0 by $150k); unused losses carry forward. On sale, claimed depreciation is recaptured at up to 25%, and gains may owe capital-gains tax (a 1031 exchange can defer both). Figures are a year-1 estimate at your 24.0% rate — not tax advice; consult a CPA.
Condition & rehab AI · 12 photos
This well-maintained, fully renovated studio in the Sandy Reef Condominium Complex offers a pristine beachside lifestyle with modern amenities and a prime location.
Value-add opportunities
- Both Painting exterior — Enhances curb appeal and value
- Both Landscaping — Improves curb appeal and enhances property value
- Both New flooring — Modernizes the space and increases value
Renovation cost estimate screening
Value-add ROI direction
- Both Painting exterior — Enhances curb appeal and value ↑
- Both Landscaping — Improves curb appeal and enhances property value ↑
- Both New flooring — Modernizes the space and increases value ↑
ⓘ Cost ranges are severity-bucket heuristics (US national rule-of-thumb). Get contractor quotes + a written scope before underwriting a rehab budget.
Schools (NCES district)
- District
- Long Beach City School District
- NCES district ID
- 3617730
- Math proficiency
- 66% ▼ -6.00%
- Reading proficiency
- 65% ▼ -1.00%
- Median HH income
- $86,938
- Composite
- 59.18/100
- National rank
- #947
- State rank
- #150 of 590 in NY
Livability — Long Beach
- Score
- 82/100
- State rank
- #84
- US rank
- #1285
Category grades
Schools grade is shown separately in the Schools card above.
Census & demographics
- Census place
- Long Beach, NY
- County
- Nassau County · 653,051 people
- City population
- 38,708
- Metro
- New York-Newark-Jersey City, NY-NJ-PA
- Population (ZIP)
- 38,708
- Household income
- $141,629
- Rent vs Own
- Severe rent burden
- 1284.0
Population outlook (Nassau County) Hauer SSP2
- Today (2025)
- 1,409,302 people
- By 2030
- 1,431,482 · +1.6%
- By 2040
- 1,471,607 · +4.4%
- By 2050
- 1,502,845 · +6.6%
- By 2075
- 1,575,403 · +11.8%
- By 2100
- 1,554,356 · +10.3%
Race, ethnicity, and origin ACS 2023
- Neighborhood character
- Predominantly White (73%)
- Race & ethnicity
- White 73% Hispanic / Latino 14% Two or more races 7% Asian 5% Black 4%
- Hispanic origin (detail)
- Puerto Rican 2% Dominican 1%
- Common ancestry
- Romanian 4% Scotch-Irish 4% Italian 2%
- Foreign-born
- 14% · Canada, Jamaica, China
- Languages at home
- 84% English-only · Spanish 8% Other Indo-European 3% Tagalog/Filipino 2%
Political lean MEDSL · Nassau
- 2024 margin
- Toss-up / Even · D 47.9% · R 52.1%
- 2008→2024 swing
- -12.6pp toward R · 2008: 8.4pp · 2024: -4.2pp
- All cycles
- 2024: R+4.2 2020: D+9.5 2016: D+5.3 2012: D+6.7 2008: D+8.4
Not yet ingested
- Civics
- —
Market trends
- HPI YoY
- ▼ -1067.69%
- Current HPI
- 309.3598
- Rent YoY
- ▲ 4.84%
- Metro
- New York-Newark-Jersey City, NY-NJ-PA
- State GDP YoY
- ▲ 2.60%
- F500 in state
- 92
Industry mix (Fortune 500 HQ in NY)
| Industry | F500 HQs | Revenue |
|---|---|---|
| Financial Services | 10 | $950B |
|
||
| Consumer Goods | 9 | $162B |
|
||
| Insurance | 4 | $225B |
|
||
| Telecommunications | 2 | $144B |
|
||
| Pharmaceuticals | 2 | $112B |
|
||
| Media / Entertainment | 2 | $69B |
|
||
Price history
+16522.7% since first listed5 events — show timeline
- 2026-05-18 Listed $315,000 OneKey® MLS as Distributed by MLS Grid
- 2025-06-27 Rental Removed $1,875 ONEKEY
- 2025-03-08 Listed for Rent $1,875 ONEKEY
- 2024-03-05 Rental Removed $1,895 ONEKEY
- 2023-11-26 Listed for Rent $1,895 ONEKEY
Cash-flow waterfall
monthlySold comps — $/sqft
last 12 mo · ≤1 miLoading sold comps…