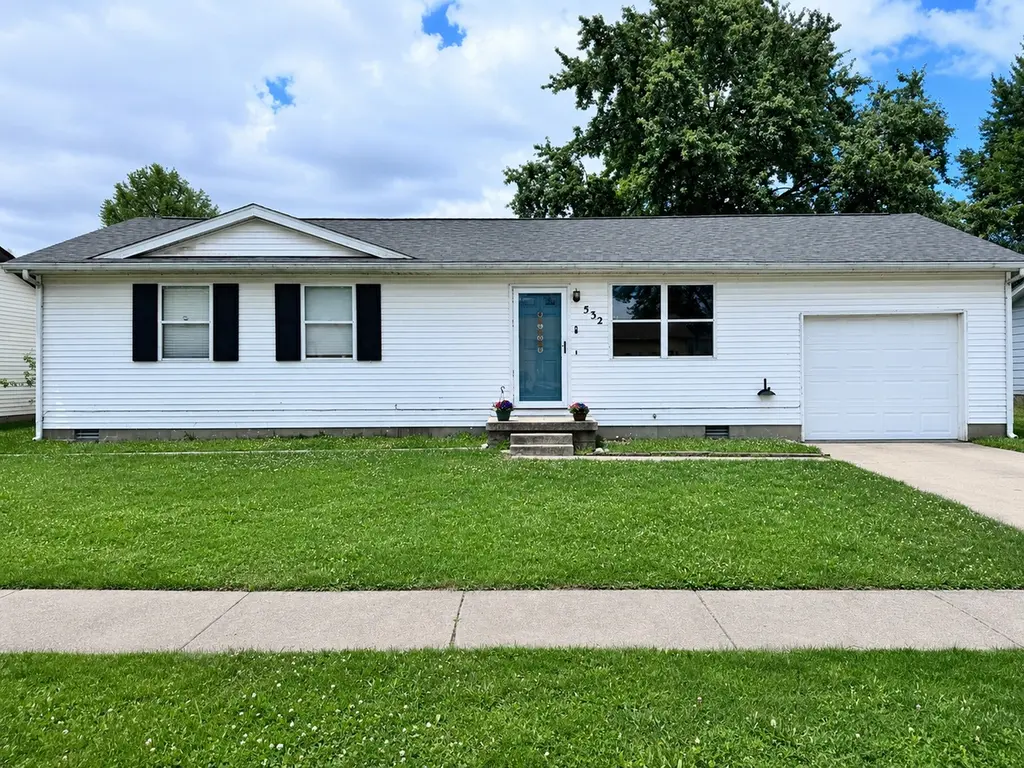
532 Kristy Dr · Centralia, IL
Flood risk 3/10 · Minor
- FEMA flood zone
- X (unshaded)
- Chance of flooding over 30 yrs
- 0.2%
- Est. flood insurance / yr
- $473 – $860
Fire risk 1/10 · Minimal
- Est. fire insurance / yr
- $804 – $1,492
Heat risk 4/10 · Minor
- Hot days now (above 105°F)
- 7 days/yr
- Hot days in 30 yrs
- 21 days/yr
Wind risk 2/10 · Minimal
- Chance of severe wind over 30 yrs
- 2.0%
Air-quality risk 2/10 · Minimal
- Unhealthy air days now
- 1 days/yr
- Unhealthy air days in 30 yrs
- 1 days/yr
Risk factors via First Street. Map © Google.
Why this score? — see what drove the D- grade
The composite is a weighted blend of 9 inputs, each scored 0–100. Each bar is that input's sub-score; the figure is the points it added to the 100-point composite (weight × sub-score).
- Cash flow +14.1/30.0
- DSCR +4.3/10.0
- 1% rule +3.9/10.0
- Livability +3.4/5.0
- ARV discount +2.6/15.0
- Rent growth +2.5/5.0
- Condition / age +2.5/5.0
- Schools +2.2/10.0
- Appreciation +0.0/10.0
$139,000
🖨 Deal sheet (PDF) 📄 Offer letter ✓ Due diligence
Listing remarks
Looking for an investment opportunity or future home? This 3 bedroom, 1 bathroom home with an attached garage was built in 1982 and offers a fenced backyard along with a small metal shed for extra storage. The roof was replaced in 2023. Tenant occupied, making this a great option for investors looking for immediate rental income. Conveniently located on Kristy Dr with plenty of potential! HIGHLY MOTIVATED SELLER
Key facts
- Tenant occupied
- Replaced roof
- Small metal shed
Tags
Property features AI
Finance
- HOA & community: No master association fee required
Exterior
- Parking: Attached garage (garage owned); Concrete driveway; 1 garage/parking space
- Utilities: Public water; Public sewer; Electric service with circuit breakers
- Home design: Detached single-family home; One-story; Fee simple ownership; Currently leased
- Construction: Vinyl siding; Asphalt roof; Block foundation; Built approximately 41–50 years ago
- Exterior features: Irregular lot; School bus service available; Lot dimensions approximately 70 x 109
Interior
- Kitchen: Range; Dishwasher; Refrigerator; Eating area / table space
- Bedrooms: 3 bedrooms (all on main level); Master bedroom on main level
- Flooring: Carpet in living areas and bedrooms; Laminate flooring in kitchen
- Bathrooms: 1 full bathroom
- Heating & cooling: Natural gas forced-air heating; Central air conditioning
- Interior features: Window treatments; 5 total rooms
- Laundry & utility: Laundry closet; Electric dryer hookup; Washer/dryer space in kitchen area (in kitchen)
Neighborhood map
What this means for you Summary
Snapshot
- This is a 3-bed/1.0-bath single-family listed at $139k.
Deal economics
- At list price, monthly cash flow is $19 ($229/yr) — positive.
- The deal already cash-flows at list — no discount required.
- To meet the 1% rule (rent ≥ 1% of price), the offer needs to be $124k (10.6% below list).
- Recommended offer: $124k (10.6% below list) — sets the bar for 1% rule.
Location & tenants
- Location reads 68/100 on livability (#481 in IL) — a middle-class / working-renter tenant base. Strengths: cost of living A+, housing A+, health & safety A+; Watch: crime F, amenities F, commute F.
- Centralia Hsd 200 (town): math 21% / reading 26% proficiency, ranked #668 of 919 in IL (top 73%) — low school quality limits family demand, transient renter base, plan for 1-2y turnover.
- Zoned schools: Centralia High School (math 22% / reading 17%, grade F, #397 of 693 statewide, top 61%, 863 students, 0% FRL).
- Market conditions: 107 active listings in the ZIP; 2 units permitted in Marion County in 2024 (0 in 5+ unit buildings).
Forward outlook
- Local home prices are declining (-3.0%/yr); year-one equity from $961 of loan paydown is wiped out by about $4k of value loss. Plan a longer hold.
- Marion County population projected at -20% by 2050 — secular population decline; favor cash flow + early exit over multi-decade hold.
Negotiation context
- It's been on market 15 days — a 2% lower offer ($137k) is reasonable based on typical stale-listing flexibility.
- 5 sale attempts since 3y ago with the ask held roughly flat each time — persistent listings suggest the price (not the market) is what's stuck; bring a comps-based counter.
- Current owner paid $70k; list at $139k implies a 99% gain — meaningful room to come down on a strong offer.
Questions for the listing agent
- Is there a deadline driving the sale (1031 exchange, divorce, estate, relocation)? That informs how much negotiation room exists.
- Schools are D-rated, which usually means shorter tenancies and higher turnover. Who's the typical renter profile here, and what's been the actual vacancy rate?
- Crime grade is F in this area — have there been break-ins, vandalism, or insurance claims at this property in the last 3 years? What carrier currently insures it and at what premium?
- The area grade is low — what's the realistic commute time and amenity access for the typical tenant pool here? Any planned neighborhood developments (good or bad) we should know about?
- What's the average days-on-market for RENTAL listings here right now (not sales)? A rising rental-DOM trend means longer vacancies and softer asking-rent achievability than the comps imply.
- What's the recent tenant-quality profile in this submarket — average credit score on applications, eviction rate, late-payment / NSF rate, and stable-employment percentage? A property-management company in the area should have these aggregated.
- How much new for-sale + rental construction is in the pipeline within 1–3 miles? Heavy new supply typically softens prices + rents 12–24 months out; constrained supply supports both.
Investment metrics
- 1% rule
- 0.89% ✗
- Cap rate
- 6.46%
- Cash-on-cash
- 0.59%
- DSCR
- 1.03
- GRM
- 9.3
CMA / ARV
- ARV (on-the-fly)
- $125,440
- Comps found
- 12
Show comp detail 12 sales within ~0.75 mi
| Address | Dist | Beds/Ba | Sqft | Sold | Price | $/sf | Match |
|---|---|---|---|---|---|---|---|
| 525 Kristy Dr | 0.03mi | 3/1.0 | 1,120 (0%) | 2mo | $125,000 | $112 | 97 |
| 525 Osage Dr | 0.13mi | 2/1.0 (-1) | 1,102 (-2%) | 8mo | $140,000 | $127 | 80 |
| 43 Ridge Rd | 0.20mi | 2/2.0 (-1) | 1,209 (+8%) | 2mo | $77,000 | $64 | 67 |
| 508 Marquis Ave | 0.54mi | 3/1.5 | 1,092 (-2%) | 5mo | $143,000 | $131 | 64 |
| 5 Ronnie | 0.19mi | 2/2.0 (-1) | 1,212 (+8%) | 6mo | $158,000 | $130 | 63 |
| 23 Park Ln | 0.35mi | 2/1.0 (-1) | 1,025 (-8%) | 2mo | $135,000 | $132 | 63 |
| 1100 E 2nd St | 0.68mi | 3/1.0 | 1,120 (0%) | 9mo | $58,000 | $52 | 60 |
| 19 Park Ln | 0.30mi | 3/1.0 | 1,011 (-10%) | 12mo | $112,000 | $111 | 60 |
| 409 S Pleasant Ave | 0.44mi | 3/1.0 | 957 (-15%) | 1mo | $97,500 | $102 | 54 |
| 503 Airport Rd | 0.62mi | 2/1.0 (-1) | 1,056 (-6%) | 3mo | $168,000 | $159 | 54 |
| 1014 E Broadway St | 0.74mi | 3/1.0 | 1,030 (-8%) | 6mo | $97,900 | $95 | 48 |
| 1206 E 2nd St | 0.63mi | 2/2.0 (-1) | 960 (-14%) | 11mo | $98,500 | $103 | 29 |
Match score weights: distance 35% · size 25% · config 20% · recency 20%. Top-matched comps best support the ARV.
Projected returns pro-forma
-3.0% appreciation · 3.0% rent growth · sell at horizon
- IRR
- -15.3%
- Equity multiple
- 0.45×
- Total profit
- $-21,287
- Equity at exit
- $20,725
- IRR
- -6.8%
- Equity multiple
- 0.57×
- Total profit
- $-16,887
- Equity at exit
- $12,018
Cash invested: $38,920 (down + closing). Projections, not guarantees.
Landlord ↔ Tenant lean methodology
- Overall (STATE)
- 43 Moderately Tenant-Leaning
- State Illinois
- 43 Moderately Tenant-Leaning · D+7
- County
- — inherits STATE
- City
- — inherits STATE
ZIP-level market 62801
- Home prices YoY
- -13.9%
- Active inventory
- 107
- Price-to-rent
- 9.3×
Monthly cashflow live
- Estimated rent
- $1,243 medium interval (Pro) →
- Mortgage (P&I)
- −$729
- Tax from tax record
- −$176 /mo · $2,114/yr
- Insurance
- −$58
- HOA
- −$0
- Vacancy / Maint / Mgmt
- −$261
- Net cashflow
- $19
Break-even live
Sensitivity live
| Price | -10% $98 | -5% $58 | +0% $19 | +5% $-20 | +10% $-60 |
|---|---|---|---|---|---|
| Rent | -10% $-79 | -5% $-30 | +0% $19 | +5% $68 | +10% $117 |
| Rate | -1.0pp $89 | -0.5pp $54 | base $19 | +0.5pp $-17 | +1.0pp $-54 |
UW: 25.0% down · 7.5% · 30yr · 1.5% tax · 5.0% vac · 8.0% maint · 8.0% mgmt
Financing live
Cash to close
- Down payment
- $34,750
- Closing costs
- $4,170
- Reserves months
- —
- Total cash needed
- —
Loan-product check · same deal, 3 products live
Conventional
25% down · 7.5% · 30yr
- Down + closing
- —
- Monthly P&I
- —
- Monthly cashflow
- —
- DSCR
- —
- Eligible?
- —
Personal DTI + credit; lowest rate.
DSCR
20% down · 8.5% · 30yr
- Down + closing
- —
- Monthly P&I
- —
- Monthly cashflow
- —
- DSCR
- —
- Eligible?
- —
No personal income docs; deal must DSCR.
Hard money
10% down · 12.0% · 12mo
- Down + closing
- —
- Monthly P&I
- —
- Monthly cashflow
- —
- DSCR
- —
- Eligible?
- —
Short-term bridge; refi at stabilization.
Listing history 23 events
-
2026-06-12statusdays on market $139,000 Pending 15 DOM
-
2026-06-09days on market $139,000 Active 13 DOM
-
2026-06-08days on market $139,000 Active 12 DOM
-
2026-06-07days on market $139,000 Active 11 DOM
-
2026-06-07days on market $139,000 Active 10 DOM
-
2026-06-04days on market $139,000 Active 7 DOM
-
2026-06-02days on market $139,000 Active 6 DOM
-
2026-06-01days on market $139,000 Active 5 DOM
-
2026-05-31days on market $139,000 Active 4 DOM
-
2026-05-31days on market $139,000 Active 3 DOM
-
2026-05-27$139,000 Active
-
2025-03-25$129,900 Active
-
2025-03-25historical
-
2024-10-08$129,900 Active
-
2024-08-17historical
-
2023-08-30$129,900 Active
-
2023-07-22historical
-
2023-03-25$99,900 Active
-
2021-08-06historical
-
2021-08-06historical
-
2021-08-06historical
-
2015-02-13soldstatus $70,000
-
2014-05-15historical
ⓘ Source: listings_history table (triggers on properties + properties_extension) + one-shot
backfill from property_details.listing_events for pre-trigger history.
Tax reassessment forecast IL · Partial reset (capped growth)
- Current annual tax
- $2,114 · $176/mo
- Projected year-2 tax
- $2,635 · $220/mo
- Expected delta
- +$521/yr (+$43/mo · 24.6%)
ⓘ Screening estimate from a state-policy table — verify with the county assessor before closing.
Climate risk First Street
- Flood 3/10 Moderate FEMA zone X (unshaded) · 20% chance over 30 yrs
- Wildfire 1/10 Low
- Heat 4/10 Moderate 7 d/yr ≥105°F today · 21 d/yr by 30 yrs out
- Wind 2/10 Low 2% chance of damaging wind over 30 yrs
- Air quality 2/10 Low 1 unhealthy d/yr today · 1 by 30 yrs out
Nearby sold comps map
Loading sold comps map…
Walkable amenities ~0.75 mi
Loading nearby amenities…
Taxation est. · year 1
- Rental income
- $14,918
- − Mortgage interest
- −$7,786
- − Property taxes
- −$2,114
- − Insurance
- −$695
- − Repairs & maintenance
- −$1,193
- − Management
- −$1,193
- − Depreciation
- −$4,044
- Taxable loss
- −$2,107
- Est. tax savings @ 24.0%
- +$506
- After-tax cash flow
- $735/yr
For passive investors: Depreciation is non-cash, so a rental often shows a tax loss while cash-flowing — sheltering income. Rental losses are passive: they offset passive income freely, and up to $25,000/yr can offset ordinary (W-2) income if you actively participate and your MAGI is under $100k (phasing out to $0 by $150k); unused losses carry forward. On sale, claimed depreciation is recaptured at up to 25%, and gains may owe capital-gains tax (a 1031 exchange can defer both). Figures are a year-1 estimate at your 24.0% rate — not tax advice; consult a CPA.
Schools (NCES district)
- District
- Centralia Hsd 200
- NCES district ID
- 1709300
- Math proficiency
- 21% ▲ 6.00%
- Reading proficiency
- 26% ▲ 1.00%
- Median HH income
- $34,555
- Composite
- 22.43/100
- National rank
- #13470
- State rank
- #668 of 919 in IL
Livability — Centralia
- Score
- 68/100
- State rank
- #481
- US rank
- #9987
Category grades
Schools grade is shown separately in the Schools card above.
Census & demographics
- Census place
- Centralia, IL
- City population
- 19,941
- Population (ZIP)
- 19,941
Population outlook (Marion County) Hauer SSP2
- Today (2025)
- 36,071 people
- By 2030
- 34,598 · -4.1%
- By 2040
- 31,754 · -12.0%
- By 2050
- 28,912 · -19.8%
- By 2075
- 22,527 · -37.5%
- By 2100
- 16,455 · -54.4%
Race, ethnicity, and origin ACS 2023
- Neighborhood character
- Predominantly White (81%)
- Race & ethnicity
- White 81% Black 11% Two or more races 4% Hispanic / Latino 4% Asian 1%
- Common ancestry
- Serbian 2% Romanian 2% Lithuanian 1%
- Foreign-born
- 3% · Canada, China
- Languages at home
- 96% English-only · Spanish 2%
Political lean MEDSL · Marion
- 2024 margin
- Solid R (+49.5) · D 24.6% · R 74.1% · Other 1.4%
- 2008→2024 swing
- -47.5pp toward R · 2008: -2.0pp · 2024: -49.5pp
- All cycles
- 2024: R+49.5 2020: R+46.6 2016: R+44.9 2012: R+19.2 2008: R+2.0
Not yet ingested
- Civics
- —
Market trends
- HPI YoY
- ▼ -34.12%
- Current HPI
- 211.3835
- Rent YoY
- —
- Metro
- —
- State GDP YoY
- ▲ 1.59%
- F500 in state
- 60
Industry mix (Fortune 500 HQ in IL)
| Industry | F500 HQs | Revenue |
|---|---|---|
| Insurance | 4 | $201B |
|
||
| Consumer Goods | 4 | $87B |
|
||
| Industrial Machinery | 3 | $64B |
|
||
| Healthcare | 2 | $55B |
|
||
| Retail / Pharmacy | 1 | $148B |
|
||
| Agriculture / Food | 1 | $86B |
|
||
Price history
+98.6% since first listed13 events — show timeline
- 2026-05-27 Listed $139,000 MRED as Distributed by MLS Grid
- 2025-03-25 Listed $129,900 MARIS as Distributed by MLS Grid
- 2025-03-25 Delisted — MARIS as Distributed by MLS Grid
- 2024-10-08 Listed $129,900 MARIS as Distributed by MLS Grid
- 2024-08-17 Delisted — MARIS as Distributed by MLS Grid
- 2023-08-30 Listed $129,900 MARIS as Distributed by MLS Grid
- 2023-07-22 Delisted — MARIS as Distributed by MLS Grid
- 2023-03-25 Listed $99,900 MARIS as Distributed by MLS Grid
- 2021-08-06 Listing Removed — RMLSA as Distributed by MLS Grid
- 2021-08-06 Listing Removed — RMLSA as Distributed by MLS Grid
- 2021-08-06 Listing Removed — RMLSA as Distributed by MLS Grid
- 2015-02-13 Sold (Public Records) $70,000 Public Records
- 2014-05-15 Listing Removed — MRED as Distributed by MLS Grid
Property tax history
+1.2%/yrLatest (2024): $2,114 · -3.1% YoY. Source: county tax records.
Cash-flow waterfall
monthlySold comps — $/sqft
last 12 mo · ≤1 miLoading sold comps…