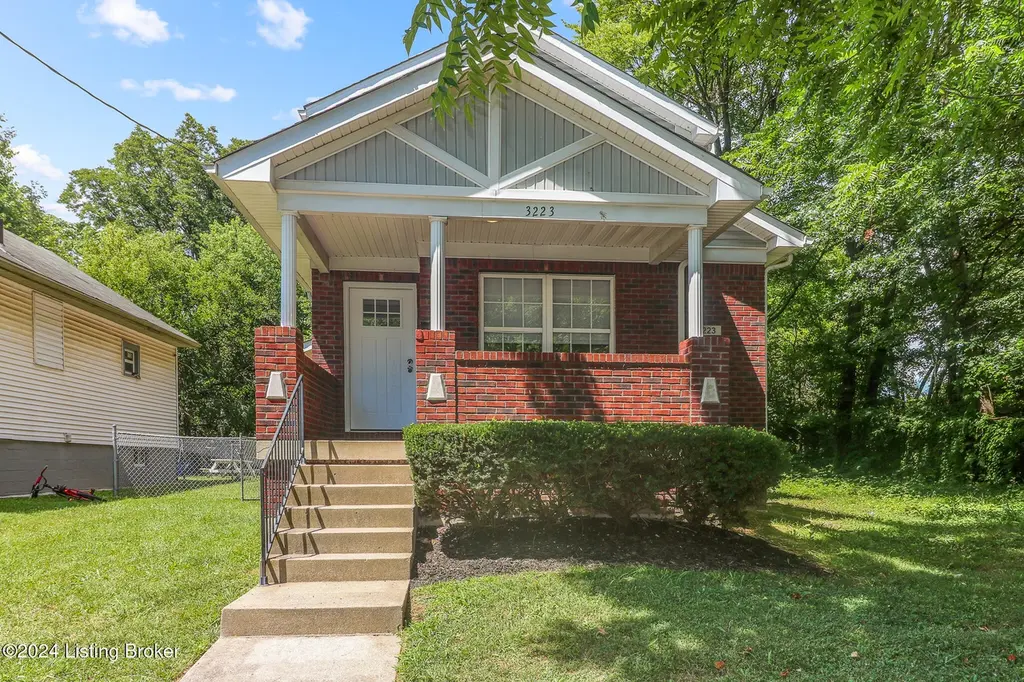
3223 Herman St · Louisville, KY
Flood risk 1/10 · Minimal
- FEMA flood zone
- X (unshaded)
- Chance of flooding over 30 yrs
- 0.0%
- Est. flood insurance / yr
- $473 – $860
Fire risk 1/10 · Minimal
- Est. fire insurance / yr
- $839 – $1,559
Heat risk 5/10 · Moderate
- Hot days now (above 105°F)
- 7 days/yr
- Hot days in 30 yrs
- 20 days/yr
Wind risk 2/10 · Minimal
- Chance of severe wind over 30 yrs
- 1.0%
Air-quality risk 2/10 · Minimal
- Unhealthy air days now
- 1 days/yr
- Unhealthy air days in 30 yrs
- 2 days/yr
Risk factors via First Street. Map © Google.
Why this score? — see what drove the C- grade
The composite is a weighted blend of 9 inputs, each scored 0–100. Each bar is that input's sub-score; the figure is the points it added to the 100-point composite (weight × sub-score).
- Cash flow +14.8/30.0
- Appreciation +10.0/10.0
- ARV discount +7.5/15.0
- DSCR +4.5/10.0
- Livability +3.2/5.0
- 1% rule +2.8/10.0
- Rent growth +2.6/5.0
- Condition / age +2.5/5.0
- Schools +2.3/10.0
$178,360
🖨 Deal sheet (PDF) 📄 Offer letter ✓ Due diligence
Listing remarks
Schedule Your Viewing of this Wonderful 2 Story Brick with 4 Bedrooms, 2 Full Baths, affordably priced home with Full Basement, and Garage. Plus, nothing that has to be done but, move in! New roof and furnace in 2023, new water heater, and central air will be installed before close. Throughout the main living areas is new LVP flooring, and the bedrooms have new plush carpeting. Featured on the 1st level is the primary bedroom with large walk-in closet, open and spacious living room/dining area and galley kitchen with new granite countertops, maple finish cabinets, and all new stainless-steel appliances. On the 2nd floor you'll find 3 more bedrooms 1 which is very large and can serve as the
Key facts
- New furnace
- New plush carpeting
- New water heater
Tags
Property features AI
Finance
- Other: Subdivision: PUSEY ADDN
- HOA & community: No association fee
Exterior
- Parking: Detached garage (1 car)
- Utilities: Electricity connected; Natural gas available
- Home design: Single family residence; Traditional style; 2 stories; Built in 2002
- Construction: Vinyl siding and brick exterior; Shingle roof; Poured concrete foundation
- Exterior features: Partial chain-link fencing; Handicap provisions
Interior
- Kitchen: Kitchen on the first floor
- Bedrooms: 4 bedrooms total; 1 bedroom on the first floor; 3 bedrooms on the second floor
- Bathrooms: 2 full bathrooms; 0 half bathrooms
- Heating & cooling: Forced air heating (natural gas); Central air conditioning; One HVAC unit for heating; One HVAC unit for cooling
- Interior features: 7 total rooms; 8 closets; Unfinished basement; Basement present; Handicap provisions
- Laundry & utility: First-floor laundry
Neighborhood map
What this means for you Summary
Snapshot
- This is a 4-bed/2.0-bath other listed at $178k.
Deal economics
- At list price, monthly cash flow is $49 ($594/yr) — positive.
- The deal already cash-flows at list — no discount required.
- To meet the 1% rule (rent ≥ 1% of price), the offer needs to be $139k (22.1% below list).
- Recommended offer: $139k (22.1% below list) — sets the bar for 1% rule.
- Cap rate 6.6% vs local median 5.0% in Louisville — top-decile yield for the area; either an underpriced asset or a hidden risk that comps aren't pricing in. Stress-test before assuming the spread holds.
Location & tenants
- Location reads 63/100 on livability (#333 in KY) — a middle-class / working-renter tenant base. Strengths: cost of living A+, housing A+; Watch: employment C-, health & safety D+, crime F.
- Jefferson County (urban): math 19% / reading 35% proficiency, ranked #121 of 165 in KY (top 73%) — low school quality limits family demand, transient renter base, plan for 1-2y turnover.
- Zoned schools: Foster Traditional Academy (math 2% / reading 12%, grade F, #662 of 676 statewide, top 99%, 578 students, 84% FRL); Robert Frost Sixth-Grade Academy (math 3% / reading 14%); Ballard High (math 42% / reading 46%, grade F, #27 of 254 statewide, top 10%, 2,014 students, 34% FRL) — zoned schools at 59% FRL track the district average.
- Market conditions: Rents flat; 141 active listings in the ZIP; 40 comparable units currently listed for rent nearby; rentals at typical pace (median 18d on market — plan ~3-4 weeks tenant-placement turnaround); lower-income renter base — watch delinquency; 2,836 units permitted in Jefferson County in 2024 (1,558 in 5+ unit buildings).
- At $1,390/mo this rent would consume 47% of the median local household income ($36k/yr) (locally 1148% of renters already pay >50% of income on rent) — very limited rent-growth headroom before tenants either downsize or default.
Forward outlook
- In year one you build about $19k of equity ($1k loan paydown + $18k appreciation (10.0% local appreciation)).
- Jefferson County population projected at +13% by 2050 — modest demand growth; plan on rents tracking national, not racing it.
- At projected returns (10.0% appreciation + 0.5% rent growth), your $50k cash investment doubles in ~3 years — after that, you're playing with house money.
- By year 2, paydown + projected appreciation supports a ~$31k cash-out refi (75% LTV) — recoverable capital for the next deal without selling this one.
Negotiation context
- It's been on market 70 days — a 6% lower offer ($168k) is reasonable based on typical stale-listing flexibility.
- 2 sale attempts with the ask held roughly flat each time — persistent listings suggest the price (not the market) is what's stuck; bring a comps-based counter.
Risks & watch-outs
- Climate carrying-cost: extreme-heat days projected 7→20/yr by 2055 (HVAC capex compounding) — expect insurance premiums to compound above CPI over the hold.
Questions for the listing agent
- It's been on market 70 days. Have you received any prior offers? Is the seller open to a 22% concession, seller financing, or rate buy-down credit?
- Why hasn't it sold? Are there any deal-killer items the seller is aware of (foundation, flood, title, zoning, code violations)?
- Is there a deadline driving the sale (1031 exchange, divorce, estate, relocation)? That informs how much negotiation room exists.
- Schools are D-rated, which usually means shorter tenancies and higher turnover. Who's the typical renter profile here, and what's been the actual vacancy rate?
- Crime grade is F in this area — have there been break-ins, vandalism, or insurance claims at this property in the last 3 years? What carrier currently insures it and at what premium?
- What's the average days-on-market for RENTAL listings here right now (not sales)? A rising rental-DOM trend means longer vacancies and softer asking-rent achievability than the comps imply.
- What's the recent tenant-quality profile in this submarket — average credit score on applications, eviction rate, late-payment / NSF rate, and stable-employment percentage? A property-management company in the area should have these aggregated.
- How much new for-sale + rental construction is in the pipeline within 1–3 miles? Heavy new supply typically softens prices + rents 12–24 months out; constrained supply supports both.
Investment metrics
- 1% rule
- 0.78% ✗
- Cap rate
- 6.63%
- Cash-on-cash
- 1.19%
- DSCR
- 1.05
- GRM
- 10.7
CMA / ARV
No comps found within radius.
Projected returns pro-forma
10.0% appreciation · 0.51% rent growth · sell at horizon
- IRR
- 24.4%
- Equity multiple
- 2.94×
- Total profit
- $96,800
- Equity at exit
- $160,681
- IRR
- 21.1%
- Equity multiple
- 6.53×
- Total profit
- $276,181
- Equity at exit
- $346,514
Cash invested: $49,941 (down + closing). Projections, not guarantees.
Landlord ↔ Tenant lean methodology
- Overall (STATE)
- 83 Strongly Landlord-Friendly
- State Kentucky
- 83 Strongly Landlord-Friendly · R+16
- County
- — inherits STATE
- City
- — inherits STATE
ZIP-level market 40212
- Home prices YoY
- 11.0%
- Rents YoY
- 0.5%
- Active inventory
- 141
- Price-to-rent
- 10.7×
Monthly cashflow live
- Estimated rent
- $1,390 high interval (Pro) →
- Mortgage (P&I)
- −$935
- Tax from tax record
- −$39 /mo · $468/yr
- Insurance
- −$74
- HOA
- −$0
- Vacancy / Maint / Mgmt
- −$292
- Net cashflow
- $49
Break-even live
Sensitivity live
| Price | -10% $150 | -5% $100 | +0% $49 | +5% $-1 | +10% $-52 |
|---|---|---|---|---|---|
| Rent | -10% $-60 | -5% $-5 | +0% $49 | +5% $104 | +10% $159 |
| Rate | -1.0pp $139 | -0.5pp $95 | base $49 | +0.5pp $3 | +1.0pp $-44 |
UW: 25.0% down · 7.5% · 30yr · 1.5% tax · 5.0% vac · 8.0% maint · 8.0% mgmt
Financing live
Cash to close
- Down payment
- $44,590
- Closing costs
- $5,351
- Reserves months
- —
- Total cash needed
- —
Loan-product check · same deal, 3 products live
Conventional
25% down · 7.5% · 30yr
- Down + closing
- —
- Monthly P&I
- —
- Monthly cashflow
- —
- DSCR
- —
- Eligible?
- —
Personal DTI + credit; lowest rate.
DSCR
20% down · 8.5% · 30yr
- Down + closing
- —
- Monthly P&I
- —
- Monthly cashflow
- —
- DSCR
- —
- Eligible?
- —
No personal income docs; deal must DSCR.
Hard money
10% down · 12.0% · 12mo
- Down + closing
- —
- Monthly P&I
- —
- Monthly cashflow
- —
- DSCR
- —
- Eligible?
- —
Short-term bridge; refi at stabilization.
Rent comps 40 comps
| Address | Beds | Baths | Sqft | Rent | $/sqft | DOM | Units | Dist |
|---|---|---|---|---|---|---|---|---|
| 3819 River Park Dr Louisville, KY | 3.0 | 1.0 | 1108 | $1,090 | $0.98 | 22d | 1 | 0.55mi |
| 627 S 38th St Louisville, KY | 4.0 | 1.0 | 1300 | $1,349 | $1.04 | 18d | 1 | 0.58mi |
| 106 N 40th St Louisville, KY | 3.0 | 1.0 | 1325 | $1,220 | $0.92 | 5d | 1 | 0.62mi |
| 3908 River Park Dr Louisville, KY | 3.0 | 1.0 | 1102 | $1,350 | $1.23 | 0d | 1 | 0.62mi |
| 127 N 40th St Louisville, KY | 3.0 | 2.0 | 1500 | $1,570 | $1.05 | 5d | 1 | 0.62mi |
| 652 S 37th St #9 Louisville, KY | 3.0 | 1.0 | 1070 | $1,095 | $1.02 | 25d | 1 | 0.64mi |
| 628 S 39th St Louisville, KY | 3.0 | 1.0 | 1448 | $1,220 | $0.84 | 18d | 1 | 0.67mi |
| 247 Cecil Ave Louisville, KY | 3.0 | 2.0 | 1083 | $1,305 | $1.20 | 21d | 1 | 0.68mi |
| 3901 Jewell Ave Louisville, KY | 3.0 | 1.0 | 1069 | $1,140 | $1.07 | 22d | 1 | 0.72mi |
| 737 S 33rd St Louisville, KY | 4.0 | 1.0 | 1356 | $1,595 | $1.18 | 25d | 1 | 0.73mi |
| 205 N 26th St Louisville, KY | 3.0 | 2.0 | 1538 | $1,350 | $0.88 | 0d | 1 | 0.73mi |
| 2529 W Main St #2 Louisville, KY | 3.0 | 1.0 | 1404 | $1,200 | $0.85 | 25d | 1 | 0.74mi |
| 4129 W Muhammad Ali Blvd Louisville, KY | 4.0 | 2.0 | 1224 | $1,500 | $1.23 | 3d | 1 | 0.77mi |
| 2508 W Main St Louisville, KY | 3.0 | 1.0 | 1327 | $1,500 | $1.13 | 0d | 1 | 0.78mi |
| 2508 W Main St Louisville, KY | 3.0 | 1.0 | 1327 | $1,500 | $1.13 | 25d | 1 | 0.78mi |
| 803 S 35th St Louisville, KY | 3.0 | 1.0 | 1486 | $1,350 | $0.91 | 25d | 1 | 0.80mi |
| 814 S 33rd St Louisville, KY | 3.0 | 1.0 | 1104 | $1,350 | $1.22 | 5d | 1 | 0.81mi |
| 430 S 24th St Louisville, KY | 3.0 | 1.5 | 1288 | $1,400 | $1.09 | 25d | 1 | 0.82mi |
| 212 N 25th St Louisville, KY | 3.0 | 1.0 | 1104 | $895 | $0.81 | 25d | 1 | 0.84mi |
| 3909 W Broadway Louisville, KY | 5.0 | 2.0 | 2000 | $1,745 | $0.87 | 18d | 1 | 0.85mi |
| 820 Hazel St Louisville, KY | 4.0 | 2.0 | 1872 | $1,395 | $0.75 | 5d | 1 | 0.86mi |
| 2319 W Muhammad Ali Blvd Louisville, KY | 4.0 | 1.0 | 1644 | $1,300 | $0.79 | 18d | 1 | 0.91mi |
| 722 S 40th St Unit NA Louisville, KY | 4.0 | 2.5 | 1556 | $1,700 | $1.09 | 5d | 1 | 0.94mi |
| 823 S 38th St Louisville, KY | 3.0 | 1.0 | 1100 | $1,195 | $1.09 | 5d | 1 | 0.95mi |
| 2216 W Main St Unit 2 Louisville, KY | 3.0 | 1.0 | 1152 | $845 | $0.73 | 0d | 1 | 1.02mi |
| 2429 Griffiths Ave Louisville, KY | 4.0 | 2.0 | 1645 | $1,800 | $1.09 | 0d | 1 | 1.03mi |
| 803 Cecil Ave Louisville, KY | 4.0 | 1.0 | 1165 | $1,449 | $1.24 | 12d | 1 | 1.09mi |
| 100 N Longworth Ave Louisville, KY | 4.0 | 1.0 | 1288 | $1,225 | $0.95 | 0d | 1 | 1.10mi |
| 2634 Garland Ave Unit B Louisville, KY | 3.0 | 1.0 | 1152 | $870 | $0.76 | 0d | 1 | 1.11mi |
| 2634 Garland Ave Unit A Louisville, KY | 3.0 | 1.0 | 1152 | $915 | $0.79 | 0d | 1 | 1.11mi |
| 714 S 42nd St Louisville, KY | 3.0 | 1.0 | 1078 | $1,150 | $1.07 | 18d | 1 | 1.11mi |
| 836 S 41st St Louisville, KY | 3.0 | 1.0 | 1300 | $1,300 | $1.00 | 21d | 1 | 1.11mi |
| 2711 W Kentucky St Louisville, KY | 3.0 | 1.0 | 1155 | $1,100 | $0.95 | 25d | 1 | 1.14mi |
| 2825 Greenwood Ave #4 Louisville, KY | 3.0 | 1.0 | 1440 | $1,250 | $0.87 | 25d | 1 | 1.17mi |
| 2821 Greenwood Ave #1 Louisville, KY | 3.0 | 1.0 | 1113 | $1,300 | $1.17 | 25d | 1 | 1.17mi |
| 2912 Greenwood Ave Louisville, KY | 3.0 | 2.0 | 1362 | $1,150 | $0.84 | 18d | 1 | 1.18mi |
| 2906 Montgomery St Unit B Louisville, KY | 3.0 | 1.0 | 1152 | $1,060 | $0.92 | 25d | 1 | 1.21mi |
| 2416 Garland Ave Louisville, KY | 3.0 | 2.0 | 1172 | $1,600 | $1.37 | 25d | 1 | 1.23mi |
| 3514 Grand Ave Louisville, KY | 3.0 | 1.5 | 1450 | $1,295 | $0.89 | 23d | 1 | 1.24mi |
| 120 N 20th St Louisville, KY | 3.0 | 1.5 | 1300 | $1,400 | $1.08 | 25d | 1 | 1.25mi |
Listing history 20 events
-
2026-06-21days on market $178,360 Active 70 DOM
-
2026-06-18days on market $178,360 Active 67 DOM
-
2026-06-17days on market $178,360 Active 66 DOM
-
2026-06-16days on market $178,360 Active 65 DOM
-
2026-06-15days on market $178,360 Active 64 DOM
-
2026-06-13days on market $178,360 Active 62 DOM
-
2026-06-10days on market $178,360 Active 59 DOM
-
2026-06-09days on market $178,360 Active 58 DOM
-
2026-06-08days on market $178,360 Active 57 DOM
-
2026-06-07days on market $178,360 Active 56 DOM
-
2026-06-03days on market $178,360 Active 52 DOM
-
2026-06-02days on market $178,360 Active 51 DOM
-
2026-06-01days on market $178,360 Active 50 DOM
-
2026-05-31days on market $178,360 Active 49 DOM
-
2026-04-13$178,360 Active
-
2026-04-11historical
-
2026-01-08price $178,360
-
2025-07-11$182,000 Active
-
2024-12-19price $181,300
-
2018-10-31soldstatus $3,240,000
ⓘ Source: listings_history table (triggers on properties + properties_extension) + one-shot
backfill from property_details.listing_events for pre-trigger history.
Tax reassessment forecast KY · Resets to sale price
- Current annual tax
- $468 · $39/mo
- Projected year-2 tax
- $1,534 · $128/mo
- Expected delta
- +$1,066/yr (+$89/mo · 227.6%)
ⓘ Screening estimate from a state-policy table — verify with the county assessor before closing.
Climate risk First Street
- Flood 1/10 Low FEMA zone X (unshaded) · 0% chance over 30 yrs
- Wildfire 1/10 Low
- Heat 5/10 Major 7 d/yr ≥105°F today · 20 d/yr by 30 yrs out
- Wind 2/10 Low 100% chance of damaging wind over 30 yrs
- Air quality 2/10 Low 1 unhealthy d/yr today · 2 by 30 yrs out
Nearby sold comps map
Loading sold comps map…
Walkable amenities ~0.75 mi
Loading nearby amenities…
Taxation est. · year 1
- Rental income
- $16,681
- − Mortgage interest
- −$9,991
- − Property taxes
- −$468
- − Insurance
- −$892
- − Repairs & maintenance
- −$1,334
- − Management
- −$1,334
- − Depreciation
- −$5,189
- Taxable loss
- −$2,528
- Est. tax savings @ 24.0%
- +$607
- After-tax cash flow
- $1,200/yr
For passive investors: Depreciation is non-cash, so a rental often shows a tax loss while cash-flowing — sheltering income. Rental losses are passive: they offset passive income freely, and up to $25,000/yr can offset ordinary (W-2) income if you actively participate and your MAGI is under $100k (phasing out to $0 by $150k); unused losses carry forward. On sale, claimed depreciation is recaptured at up to 25%, and gains may owe capital-gains tax (a 1031 exchange can defer both). Figures are a year-1 estimate at your 24.0% rate — not tax advice; consult a CPA.
Schools (NCES district)
- District
- Jefferson County
- NCES district ID
- 2102990
- Math proficiency
- 19% ▼ -17.00%
- Reading proficiency
- 35% ▼ -11.00%
- Median HH income
- $47,885
- Composite
- 23.45/100
- National rank
- #7884
- State rank
- #121 of 165 in KY
Livability — Louisville
- Score
- 63/100
- State rank
- #333
- US rank
- #15887
Category grades
Schools grade is shown separately in the Schools card above.
Census & demographics
- Census place
- Louisville, KY
- County
- Jefferson County · 790,184 people
- City population
- 769,292
- Metro
- Louisville/Jefferson County, KY-IN
- Population (ZIP)
- 14,661
- Household income
- $35,753
- Rent vs Own
- Severe rent burden
- 1148.0
Population outlook (Jefferson County) Hauer SSP2
- Today (2025)
- 823,112 people
- By 2030
- 849,343 · +3.2%
- By 2040
- 895,696 · +8.8%
- By 2050
- 933,630 · +13.4%
- By 2075
- 1,028,262 · +24.9%
- By 2100
- 1,072,675 · +30.3%
Race, ethnicity, and origin ACS 2023
- Neighborhood character
- Majority Black (60%)
- Race & ethnicity
- Black 60% White 37% Two or more races 2% Hispanic / Latino 1%
- Common ancestry
- Slovak 1% Lithuanian 1% Iranian 1%
- Foreign-born
- 1% · Canada
- Languages at home
- 98% English-only · Spanish 1%
Political lean MEDSL · Jefferson
- 2024 margin
- D (+16.6) · D 57.4% · R 40.9% · Other 1.7%
- 2008→2024 swing
- +4.5pp toward D · 2008: 12.0pp · 2024: 16.6pp
- All cycles
- 2024: D+16.6 2020: D+20.1 2016: D+13.3 2012: D+11.1 2008: D+12.0
Not yet ingested
- Civics
- —
Market trends
- HPI YoY
- ▲ 29.02%
- Current HPI
- 293.2624
- Rent YoY
- ▲ 0.51%
- Metro
- Louisville/Jefferson County, KY-IN
- State GDP YoY
- ▲ 1.81%
- F500 in state
- 4
Industry mix (Fortune 500 HQ in KY)
| Industry | F500 HQs | Revenue |
|---|---|---|
| Healthcare | 1 | $118B |
|
||
| Food / Beverage | 1 | $7B |
|
||
Price history
-94.5% since first listed6 events — show timeline
- 2026-04-13 Listed $178,360 Metro Search MLS
- 2026-04-11 Listing Removed — Metro Search MLS
- 2026-01-08 Price Changed $178,360 Metro Search MLS
- 2025-07-11 Listed $182,000 Metro Search MLS
- 2024-12-19 Price Changed $181,300 Metro Search MLS
- 2018-10-31 Sold (Public Records) $3,240,000 Public Records
Property tax history
+0.0%/yrLatest (2018): $468 · +1.6% YoY. Source: county tax records.
Cash-flow waterfall
monthlySold comps — $/sqft
last 12 mo · ≤1 miLoading sold comps…