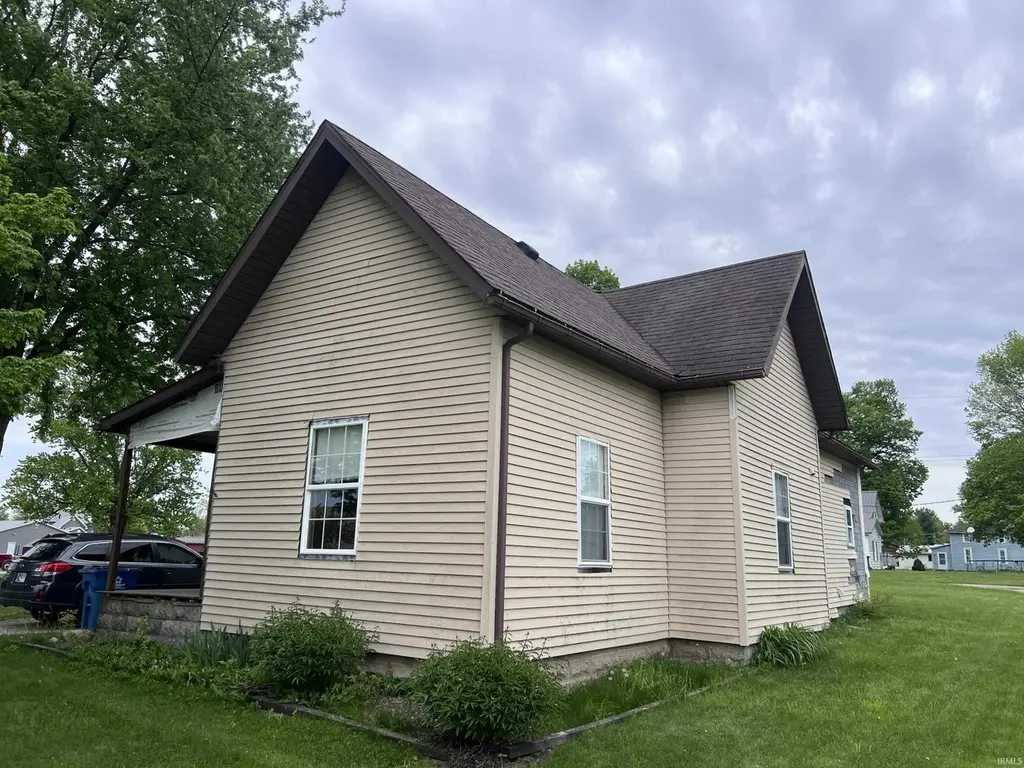
208 W Garfield St · Ashley, IN
Flood risk 1/10 · Minimal
- FEMA flood zone
- X (unshaded)
- Chance of flooding over 30 yrs
- 0.0%
- Est. flood insurance / yr
- $473 – $860
Fire risk 1/10 · Minimal
- Est. fire insurance / yr
- $717 – $1,331
Heat risk 3/10 · Minor
- Hot days now (above 100°F)
- 7 days/yr
- Hot days in 30 yrs
- 16 days/yr
Wind risk 2/10 · Minimal
- Chance of severe wind over 30 yrs
- —
Air-quality risk 2/10 · Minimal
- Unhealthy air days now
- 1 days/yr
- Unhealthy air days in 30 yrs
- 2 days/yr
Risk factors via First Street. Map © Google.
Why this score? — see what drove the B- grade
The composite is a weighted blend of 9 inputs, each scored 0–100. Each bar is that input's sub-score; the figure is the points it added to the 100-point composite (weight × sub-score).
- Cash flow +30.0/30.0
- DSCR +10.0/10.0
- 1% rule +8.4/10.0
- ARV discount +7.5/15.0
- Schools +3.9/10.0
- Livability +3.2/5.0
- Rent growth +2.5/5.0
- Condition / age +2.5/5.0
- Appreciation +0.0/10.0
$74,000
🖨 Deal sheet 📄 Offer letter ✓ Due diligence
Listing remarks
OPPORTUNITY! Partially renovated 3 bedroom home with large rooms, solid potential and improvements already started. Most windows have already been replaced and remaining windows and siding materials included. Home features newer electrical panel, newer water heater, and plumbing in place for additional half bath - plus potential for to create an upstairs owner's suite. Functional layout with large kitchen, high ceilings, stable overall structure. Exterior still needs siding completion (materials included) soffits, and gutter extensions. Located within walking distance to town and ideal for investors, flippers, rental portfolios, or handy buyers looking to finish and build equity. * '[] Age
Key facts
- Large kitchen
- Newer water heater
- Functional layout
Tags
Property features AI
Finance
- Other: Property listed as residential single family; Subdivision: Ashley(s)
Exterior
- Utilities: Public water; Public sewer
- Home design: Single-family site-built home; One story
- Construction: Vinyl siding; Asphalt roof; Above-grade finished area listed (1,112)
- Exterior features: Level lot; Lot dimensions approximately 50 x 135
Interior
- Bathrooms: One full bathroom (main level)
- Heating & cooling: Central air conditioning; No heating system listed
- Interior features: One fireplace (no special features); Partial, unfinished basement
- Laundry & utility: Laundry located on the main level
Neighborhood map
What this means for you Summary
Snapshot
- This is a 3-bed/1.0-bath single-family listed at $74k.
Deal economics
- At list price, monthly cash flow is $351 ($4k/yr) — positive.
- The deal already cash-flows at list — no discount required.
- Meets the 1% rule at list price ($992 rent vs $74k).
Location & tenants
- Location reads 65/100 on livability (#320 in IN) — a middle-class / working-renter tenant base. Strengths: crime A+, cost of living A+, housing A+; Watch: employment C-, amenities F, commute F.
- Dekalb County Ctl United School District (town): math 42% / reading 50% proficiency, ranked #91 of 301 in IN (top 30%) — families likely to look elsewhere, expect single-tenant / working-renter base with shorter leases.
- Zoned schools: Country Meadow Elementary School (math 47% / reading 37%, grade F, #434 of 994 statewide, top 48%, 314 students, 43% FRL); Dekalb Middle School (math 34% / reading 52%, grade D-, #92 of 330 statewide, top 29%, 800 students, 47% FRL); Dekalb High School (math 43% / reading 70%, grade C, #70 of 369 statewide, top 19%, 1,075 students, 36% FRL).
- Market conditions: 9 active listings in the ZIP; 209 units permitted in Steuben County in 2024 (72 in 5+ unit buildings).
Forward outlook
- Local home prices are declining (-3.0%/yr); year-one equity from $512 of loan paydown is wiped out by about $2k of value loss. Plan a longer hold.
- Steuben County population projected at -13% by 2050 — secular population decline; favor cash flow + early exit over multi-decade hold.
- At projected returns (-3.0% appreciation + 3.0% rent growth), your $21k cash investment doubles in ~6 years — after that, you're playing with house money.
Negotiation context
- Only 4 days on market — expect competitive offers; lowballing is unlikely to land.
Risks & watch-outs
- Watch-outs: built in 1900 — expect roof / HVAC / electrical / plumbing capex.
Questions for the listing agent
- Built in 1900 — when were the roof, HVAC, electrical panel, plumbing, and water heater last replaced?
- Is there a deadline driving the sale (1031 exchange, divorce, estate, relocation)? That informs how much negotiation room exists.
- Schools are D-rated, which usually means shorter tenancies and higher turnover. Who's the typical renter profile here, and what's been the actual vacancy rate?
- What's the average days-on-market for RENTAL listings here right now (not sales)? A rising rental-DOM trend means longer vacancies and softer asking-rent achievability than the comps imply.
- What's the recent tenant-quality profile in this submarket — average credit score on applications, eviction rate, late-payment / NSF rate, and stable-employment percentage? A property-management company in the area should have these aggregated.
- How much new for-sale + rental construction is in the pipeline within 1–3 miles? Heavy new supply typically softens prices + rents 12–24 months out; constrained supply supports both.
Investment metrics
- 1% rule
- 1.34% ✓
- Cap rate
- 11.99%
- Cash-on-cash
- 20.34%
- DSCR
- 1.91
- GRM
- 6.2
CMA / ARV
- ARV (on-the-fly)
- $182,368
- Comps found
- 9
Show comp detail 9 sales within ~0.75 mi
| Address | Dist | Beds/Ba | Sqft | Sold | Price | $/sf | Match |
|---|---|---|---|---|---|---|---|
| 507 W State St | 0.27mi | 3/1.5 | 1,144 (+3%) | 9mo | $189,900 | $166 | 73 |
| 106 E Hobart St | 0.31mi | 3/2.0 | 1,120 (+1%) | 9mo | $175,000 | $156 | 73 |
| 509 W State St | 0.29mi | 3/2.0 | 1,056 (-5%) | 10mo | $197,200 | $187 | 66 |
| 103 Adams Ct | 0.27mi | 3/1.0 | 1,008 (-9%) | 11mo | $165,000 | $164 | 62 |
| 408 Hardy St | 0.64mi | 3/1.0 | 1,188 (+7%) | 1mo | $189,000 | $159 | 58 |
| 410 S Gonser Ave | 0.41mi | 3/2.0 | 1,001 (-10%) | 3mo | $180,000 | $180 | 58 |
| 302 Chaple Ln | 0.60mi | 3/1.0 | 1,008 (-9%) | 0mo | $195,000 | $193 | 56 |
| 203 E Lincoln St | 0.23mi | 3/1.0 | 1,008 (-9%) | 24mo | $110,000 | $109 | 54 |
| 106 W Pearl St | 0.48mi | 2/2.0 (-1) | 992 (-11%) | 12mo | $155,000 | $156 | 41 |
Match score weights: distance 35% · size 25% · config 20% · recency 20%. Top-matched comps best support the ARV.
Projected returns pro-forma
-3.0% appreciation · 3.0% rent growth · sell at horizon
- IRR
- 12.6%
- Equity multiple
- 1.50×
- Total profit
- $10,346
- Equity at exit
- $11,034
- IRR
- 21.4%
- Equity multiple
- 2.82×
- Total profit
- $37,680
- Equity at exit
- $6,398
Cash invested: $20,720 (down + closing). Projections, not guarantees.
Landlord ↔ Tenant lean methodology
- Overall (STATE)
- 90 Strongly Landlord-Friendly
- State Indiana
- 90 Strongly Landlord-Friendly · R+11
- County
- — inherits STATE
- City
- — inherits STATE
ZIP-level market 46705
- Home prices YoY
- -5.2%
- Active inventory
- 9
- Price-to-rent
- 6.2×
Monthly cashflow live
- Estimated rent
- $992 medium interval (Pro) →
- Mortgage (P&I)
- −$388
- Tax from tax record
- −$14 /mo · $167/yr
- Insurance
- −$31
- HOA
- −$0
- Vacancy / Maint / Mgmt
- −$208
- Net cashflow
- $351
Break-even live
UW: 25.0% down · 7.5% · 30yr · 1.5% tax · 5.0% vac · 8.0% maint · 8.0% mgmt
Financing live
Cash to close
- Down payment
- $18,500
- Closing costs
- $2,220
- Reserves months
- —
- Total cash needed
- —
Loan-product check · same deal, 3 products live
Conventional
25% down · 7.5% · 30yr
- Down + closing
- —
- Monthly P&I
- —
- Monthly cashflow
- —
- DSCR
- —
- Eligible?
- —
Personal DTI + credit; lowest rate.
DSCR
20% down · 8.5% · 30yr
- Down + closing
- —
- Monthly P&I
- —
- Monthly cashflow
- —
- DSCR
- —
- Eligible?
- —
No personal income docs; deal must DSCR.
Hard money
10% down · 12.0% · 12mo
- Down + closing
- —
- Monthly P&I
- —
- Monthly cashflow
- —
- DSCR
- —
- Eligible?
- —
Short-term bridge; refi at stabilization.
Listing history 1 events
-
2026-05-19$74,000 Active
ⓘ Source: listings_history table (triggers on properties + properties_extension) + one-shot
backfill from property_details.listing_events for pre-trigger history.
Tax reassessment forecast IN · Partial reset (capped growth)
- Current annual tax
- $167 · $14/mo
- Projected year-2 tax
- $398 · $33/mo
- Expected delta
- +$231/yr (+$19/mo · 138.2%)
ⓘ Screening estimate from a state-policy table — verify with the county assessor before closing.
Climate risk First Street
- Flood 1/10 Low FEMA zone X (unshaded) · 0% chance over 30 yrs
- Wildfire 1/10 Low
- Heat 3/10 Moderate 7 d/yr ≥100°F today · 16 d/yr by 30 yrs out
- Wind 2/10 Low
- Air quality 2/10 Low 1 unhealthy d/yr today · 2 by 30 yrs out
Nearby sold comps map
Loading sold comps map…
Walkable amenities ~0.75 mi
Loading nearby amenities…
Taxation est. · year 1
- Rental income
- $11,910
- − Mortgage interest
- −$4,145
- − Property taxes
- −$167
- − Insurance
- −$370
- − Repairs & maintenance
- −$953
- − Management
- −$953
- − Depreciation
- −$2,153
- Taxable income
- $3,169
- Est. tax owed @ 24.0%
- −$761
- After-tax cash flow
- $3,454/yr
For passive investors: Depreciation is non-cash, so a rental often shows a tax loss while cash-flowing — sheltering income. Rental losses are passive: they offset passive income freely, and up to $25,000/yr can offset ordinary (W-2) income if you actively participate and your MAGI is under $100k (phasing out to $0 by $150k); unused losses carry forward. On sale, claimed depreciation is recaptured at up to 25%, and gains may owe capital-gains tax (a 1031 exchange can defer both). Figures are a year-1 estimate at your 24.0% rate — not tax advice; consult a CPA.
Schools (NCES district)
- District
- Dekalb County Ctl United School District
- NCES district ID
- 1801590
- Math proficiency
- 42% ▼ -7.00%
- Reading proficiency
- 50% ▼ -7.00%
- Median HH income
- $48,100
- Composite
- 39.26/100
- National rank
- #4000
- State rank
- #91 of 301 in IN
Livability — Ashley
- Score
- 65/100
- State rank
- #320
- US rank
- #12601
Category grades
Schools grade is shown separately in the Schools card above.
Census & demographics
- Census place
- Ashley, IN
- City population
- 1,988
- Population (ZIP)
- 1,988
Population outlook (Steuben County) Hauer SSP2
- Today (2025)
- 34,334 people
- By 2030
- 33,801 · -1.6%
- By 2040
- 32,076 · -6.6%
- By 2050
- 30,022 · -12.6%
- By 2075
- 25,626 · -25.4%
- By 2100
- 21,257 · -38.1%
Race, ethnicity, and origin ACS 2023
- Neighborhood character
- Predominantly White (87%)
- Race & ethnicity
- White 87% Two or more races 11% Hispanic / Latino 6%
- Hispanic origin (detail)
- Mexican 5%
- Common ancestry
- Lithuanian 4% Romanian 2% Slovak 2%
- Foreign-born
- 1% · South Korea
Political lean MEDSL · Steuben
- 2024 margin
- Solid R (+42.1) · D 28.1% · R 70.2% · Other 1.6%
- 2008→2024 swing
- -32.3pp toward R · 2008: -9.8pp · 2024: -42.1pp
- All cycles
- 2024: R+42.1 2020: R+42.2 2016: R+44.0 2012: R+27.0 2008: R+9.8
Not yet ingested
- Civics
- —
Market trends
- HPI YoY
- ▼ -12.36%
- Current HPI
- 226.0674
- Rent YoY
- —
- Metro
- —
- State GDP YoY
- ▲ 2.90%
- F500 in state
- 18
Industry mix (Fortune 500 HQ in IN)
| Industry | F500 HQs | Revenue |
|---|---|---|
| Industrial Machinery | 2 | $37B |
|
||
| Healthcare | 1 | $177B |
|
||
| Pharmaceuticals | 1 | $45B |
|
||
| Metals / Steel | 1 | $18B |
|
||
| Agriculture | 1 | $17B |
|
||
| Packaging | 1 | $12B |
|
||
Price history
1 event — show timeline
- 2026-05-19 Listed $74,000 IRMLS
Property tax history
-14.3%/yrLatest (2024): $167 · -78.8% YoY. Source: county tax records.
Cash-flow waterfall
monthlySold comps — $/sqft
last 12 mo · ≤1 miLoading sold comps…