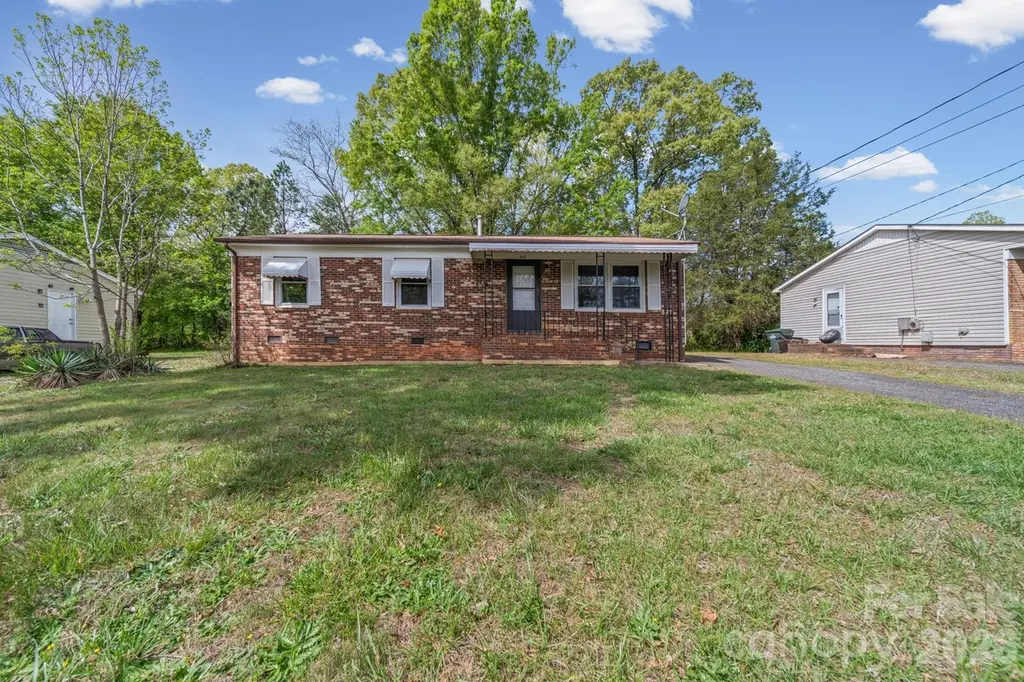
661 Kilborne Dr · Gastonia, NC
Flood risk 1/10 · Minimal
- FEMA flood zone
- X (unshaded)
- Chance of flooding over 30 yrs
- 0.0%
- Est. flood insurance / yr
- $473 – $860
Fire risk 4/10 · Minor
- Est. fire insurance / yr
- $906 – $1,684
Heat risk 6/10 · Moderate
- Hot days now (above 104°F)
- 7 days/yr
- Hot days in 30 yrs
- 17 days/yr
Wind risk 4/10 · Minor
- Chance of severe wind over 30 yrs
- 18.0%
Air-quality risk 3/10 · Minor
- Unhealthy air days now
- 3 days/yr
- Unhealthy air days in 30 yrs
- 3 days/yr
Risk factors via First Street. Map © Google.
Why this score? — see what drove the D- grade
The composite is a weighted blend of 9 inputs, each scored 0–100. Each bar is that input's sub-score; the figure is the points it added to the 100-point composite (weight × sub-score).
- Cash flow +13.8/30.0
- ARV discount +5.6/15.0
- DSCR +4.2/10.0
- Rent growth +3.9/5.0
- Schools +3.6/10.0
- 1% rule +3.1/10.0
- Livability +3.0/5.0
- Condition / age +2.5/5.0
- Appreciation +0.0/10.0
$190,000
🖨 Deal sheet (PDF) 📄 Offer letter ✓ Due diligence
Listing remarks
Stunning. . this Home has 3 Beds and 1 Bath home featuring inviting open-concept living with a seamless flow between the kitchen, dining, and living areas. Spacious bedrooms provide comfort and flexibility, ideal for both everyday living and entertaining. Thoughtfully updated and well maintained, the home features freshly painted kitchen cabinets, stylish new countertops, stainless steel appliances, durable LVP flooring, and modern lighting that enhances both style and functionality. Fresh interior paint in modern, neutral tones creates a bright and welcoming atmosphere throughout. Conveniently located in Gastonia with easy access to I-85, short commute to Kings Mountain, Crowders Mountain,
Key facts
- 8,712 sq ft lot
- Built 1978
- Listed 68 days
Property features AI
Finance
- HOA & community: No HOA
Exterior
- Parking: Driveway
- Utilities: City water; Public sewer
- Home design: Single-family residence (residential); One story; R1 zoning
- Construction: Site-built construction; Partial brick, metal and vinyl exterior; Crawl space foundation
- Exterior features: Concrete and paved road access; Publicly maintained road
Interior
- Kitchen: Dishwasher; Gas range; Refrigerator; Gas water heater
- Bedrooms: 3 bedrooms on the main level
- Flooring: Vinyl floors
- Bathrooms: 1 full bathroom on the main level
- Heating & cooling: Forced air heating (natural gas); Central air conditioning
- Interior features: 7 total rooms; Utility room laundry
- Laundry & utility: Laundry in utility room
Neighborhood map
What this means for you Summary
Snapshot
- This is a 3-bed/1.0-bath single-family listed at $190k.
Deal economics
- At list price, monthly cash flow is $16 ($194/yr) — positive.
- The deal already cash-flows at list — no discount required.
- To meet the 1% rule (rent ≥ 1% of price), the offer needs to be $153k (19.3% below list).
- Recommended offer: $153k (19.3% below list) — sets the bar for 1% rule.
- Cap rate 6.4% vs local median 3.7% in Gastonia — top-decile yield for the area; either an underpriced asset or a hidden risk that comps aren't pricing in. Stress-test before assuming the spread holds.
Location & tenants
- Location reads 59/100 on livability (#528 in NC) — a working-class tenant base; expect higher turnover. Strengths: cost of living A+, housing A+; Watch: employment D, crime F, amenities F.
- Gaston County Schools (suburban): math 44% / reading 42% proficiency, ranked #93 of 178 in NC (top 52%) — families likely to look elsewhere, expect single-tenant / working-renter base with shorter leases.
- Zoned schools: Edward D Sadler Jr Elementary School (math 27% / reading 27%, grade F, #1,033 of 1,410 statewide, top 76%, 321 students, 99% FRL); Bessemer City Middle (math 30% / reading 30%, grade F, #335 of 475 statewide, top 72%, 500 students, 99% FRL); Bessemer City High (math 37% / reading 32%, grade F, #427 of 535 statewide, top 81%, 566 students, 80% FRL) — zoned schools average 93% FRL vs 37% district-wide (56 pts higher); higher-poverty schools than district average — tighter screening recommended.
- Zoned-school proficiency averages 30% at this address vs 43% district-wide (-12 pts) — the specific schools serving this property underperform the Gaston County Schools average; the district grade overstates school quality for this exact location.
- Market conditions: Rents rising fast (+5.6%/yr); 352 active listings in the ZIP; 9 comparable units currently listed for rent nearby; rentals at typical pace (median 24d on market — plan ~3-4 weeks tenant-placement turnaround); 2,069 units permitted in Gaston County in 2024 (142 in 5+ unit buildings).
- This rent runs 37% of the median local income ($50k/yr) — at the standard rent-burdened threshold; future hikes will face affordability resistance.
Forward outlook
- Local home prices are declining (-3.0%/yr); year-one equity from $1k of loan paydown is wiped out by about $6k of value loss. Plan a longer hold.
- Gaston County population projected at +12% by 2050 — modest demand growth; plan on rents tracking national, not racing it.
Negotiation context
- It's been on market 69 days — a 6% lower offer ($179k) is reasonable based on typical stale-listing flexibility.
- Current owner paid $139k; 37% above their basis — modest negotiation headroom, anchor on the comps not their cost.
Risks & watch-outs
- Climate carrying-cost: extreme-heat days projected 7→17/yr by 2055 (HVAC capex compounding) — expect insurance premiums to compound above CPI over the hold.
Questions for the listing agent
- It's been on market 69 days. Have you received any prior offers? Is the seller open to a 19% concession, seller financing, or rate buy-down credit?
- Built in 1978 — when were the roof, HVAC, electrical panel, plumbing, and water heater last replaced?
- Why hasn't it sold? Are there any deal-killer items the seller is aware of (foundation, flood, title, zoning, code violations)?
- Is there a deadline driving the sale (1031 exchange, divorce, estate, relocation)? That informs how much negotiation room exists.
- Schools are D-rated, which usually means shorter tenancies and higher turnover. Who's the typical renter profile here, and what's been the actual vacancy rate?
- Crime grade is F in this area — have there been break-ins, vandalism, or insurance claims at this property in the last 3 years? What carrier currently insures it and at what premium?
- The area grade is low — what's the realistic commute time and amenity access for the typical tenant pool here? Any planned neighborhood developments (good or bad) we should know about?
- What's the average days-on-market for RENTAL listings here right now (not sales)? A rising rental-DOM trend means longer vacancies and softer asking-rent achievability than the comps imply.
- What's the recent tenant-quality profile in this submarket — average credit score on applications, eviction rate, late-payment / NSF rate, and stable-employment percentage? A property-management company in the area should have these aggregated.
- How much new for-sale + rental construction is in the pipeline within 1–3 miles? Heavy new supply typically softens prices + rents 12–24 months out; constrained supply supports both.
Investment metrics
- 1% rule
- 0.81% ✗
- Cap rate
- 6.40%
- Cash-on-cash
- 0.36%
- DSCR
- 1.02
- GRM
- 10.3
CMA / ARV
- ARV (on-the-fly)
- $182,448
- Comps found
- 9
Show comp detail 9 sales within ~0.75 mi
| Address | Dist | Beds/Ba | Sqft | Sold | Price | $/sf | Match |
|---|---|---|---|---|---|---|---|
| 625 Kilborne Dr | 0.08mi | 3/1.0 | 1,066 (+6%) | 15mo | $195,000 | $183 | 74 |
| 660 Kilborne Dr | 0.03mi | 3/2.0 | 1,063 (+6%) | 24mo | $209,900 | $197 | 66 |
| 701 Shannon Bradley Rd | 0.31mi | 4/1.0 (+1) | 1,048 (+4%) | 13mo | $199,500 | $190 | 63 |
| 918 Shannon Bradley Rd | 0.49mi | 3/1.0 | 954 (-5%) | 15mo | $210,000 | $220 | 55 |
| 737 Shannon Bradley Rd | 0.35mi | 3/2.0 | 1,062 (+5%) | 23mo | $176,500 | $166 | 51 |
| 691 Winston Dr | 0.46mi | 3/1.5 | 1,075 (+7%) | 22mo | $195,000 | $181 | 47 |
| 3039 Knollwood Dr | 0.64mi | 3/1.5 | 1,145 (+14%) | 9mo | $183,000 | $160 | 38 |
| 511 Newcastle Rd | 0.52mi | 3/1.5 | 1,150 (+14%) | 15mo | $194,900 | $169 | 38 |
| 1017 Vancouver Ln | 0.71mi | 4/2.0 (+1) | 1,120 (+11%) | 15mo | $186,000 | $166 | 27 |
Match score weights: distance 35% · size 25% · config 20% · recency 20%. Top-matched comps best support the ARV.
Projected returns pro-forma
-3.0% appreciation · 5.63% rent growth · sell at horizon
- IRR
- -13.1%
- Equity multiple
- 0.52×
- Total profit
- $-25,646
- Equity at exit
- $28,330
- IRR
- -0.8%
- Equity multiple
- 0.94×
- Total profit
- $-3,181
- Equity at exit
- $16,428
Cash invested: $53,200 (down + closing). Projections, not guarantees.
Landlord ↔ Tenant lean methodology
- Overall (STATE)
- 85 Strongly Landlord-Friendly
- State North Carolina
- 85 Strongly Landlord-Friendly · R+3
- County
- — inherits STATE
- City
- — inherits STATE
ZIP-level market 28052
- Rents YoY
- 5.6%
- Active inventory
- 352
- Price-to-rent
- 10.3×
Monthly cashflow live
- Estimated rent
- $1,533 high interval (Pro) →
- Mortgage (P&I)
- −$996
- Tax from tax record
- −$119 /mo · $1,428/yr
- Insurance
- −$79
- HOA
- −$0
- Vacancy / Maint / Mgmt
- −$322
- Net cashflow
- $16
Break-even live
Sensitivity live
| Price | -10% $124 | -5% $70 | +0% $16 | +5% $-38 | +10% $-91 |
|---|---|---|---|---|---|
| Rent | -10% $-105 | -5% $-44 | +0% $16 | +5% $77 | +10% $137 |
| Rate | -1.0pp $112 | -0.5pp $64 | base $16 | +0.5pp $-33 | +1.0pp $-83 |
UW: 25.0% down · 7.5% · 30yr · 1.5% tax · 5.0% vac · 8.0% maint · 8.0% mgmt
Financing live
Cash to close
- Down payment
- $47,500
- Closing costs
- $5,700
- Reserves months
- —
- Total cash needed
- —
Loan-product check · same deal, 3 products live
Conventional
25% down · 7.5% · 30yr
- Down + closing
- —
- Monthly P&I
- —
- Monthly cashflow
- —
- DSCR
- —
- Eligible?
- —
Personal DTI + credit; lowest rate.
DSCR
20% down · 8.5% · 30yr
- Down + closing
- —
- Monthly P&I
- —
- Monthly cashflow
- —
- DSCR
- —
- Eligible?
- —
No personal income docs; deal must DSCR.
Hard money
10% down · 12.0% · 12mo
- Down + closing
- —
- Monthly P&I
- —
- Monthly cashflow
- —
- DSCR
- —
- Eligible?
- —
Short-term bridge; refi at stabilization.
Rent comps 9 comps
| Address | Beds | Baths | Sqft | Rent | $/sqft | DOM | Units | Dist |
|---|---|---|---|---|---|---|---|---|
| 3129 Spring Valley Dr Gastonia, NC | 2.0–3.0 | 1.0 | 785 | $1,557 | $1.98 | 0d | 13 | 0.43mi |
| 2611 Crescent Ln Gastonia, NC | 2.0 | 1.5 | 930 | $1,150 | $1.24 | 25d | 1 | 0.87mi |
| 900 Junius St Unit c Gastonia, NC | 2.0 | 1.5 | 900 | $1,025 | $1.14 | 25d | 1 | 0.89mi |
| 924 Junius St Gastonia, NC | 3.0 | 2.0 | 960 | $1,450 | $1.51 | 6d | 1 | 0.90mi |
| 2746 Mary Ave Gastonia, NC | 3.0 | 1.0 | 941 | $1,493 | $1.59 | 4d | 1 | 0.91mi |
| 2600 Mary Ave Gastonia, NC | 3.0 | 1.0 | 912 | $1,423 | $1.56 | 23d | 1 | 1.06mi |
| 2427 Twin Ave Gastonia, NC | 2.0 | 1.0 | 1200 | $1,200 | $1.00 | 6d | 1 | 1.10mi |
| 1032 Crowders Woods Dr Gastonia, NC | 3.0 | 2.0 | 1350 | $1,749 | $1.30 | 25d | 1 | 1.15mi |
| 208 Graham St Gastonia, NC | 3.0 | 2.0 | 1315 | $1,800 | $1.37 | 25d | 1 | 1.38mi |
Listing history 24 events
-
2026-06-21days on market $190,000 Active 69 DOM
-
2026-06-18days on market $190,000 Active 66 DOM
-
2026-06-17days on market $190,000 Active 65 DOM
-
2026-06-16days on market $190,000 Active 64 DOM
-
2026-06-15days on market $190,000 Active 63 DOM
-
2026-06-13pricedays on market $190,000 Active 61 DOM
-
2026-06-09days on market $195,000 Active 57 DOM
-
2026-06-08days on market $195,000 Active 56 DOM
-
2026-06-07days on market $195,000 Active 55 DOM
-
2026-06-04days on market $195,000 Active 52 DOM
-
2026-06-03days on market $195,000 Active 51 DOM
-
2026-06-02days on market $195,000 Active 50 DOM
-
2026-06-02price $195,000 Active 49 DOM
-
2026-06-01days on market $204,800 Active 49 DOM
-
2026-05-31days on market $204,800 Active 48 DOM
-
2026-05-11price $204,800
-
2026-05-07price $208,900
-
2026-04-29price $211,900
-
2026-04-18price $216,000
-
2026-04-17price $224,000
-
2026-04-14$227,900 Active
-
2026-04-11historical $227,900
-
2019-06-11soldstatus $139,000
-
1995-01-20soldstatus $26,500
ⓘ Source: listings_history table (triggers on properties + properties_extension) + one-shot
backfill from property_details.listing_events for pre-trigger history.
Tax reassessment forecast NC · Resets to sale price
- Current annual tax
- $1,428 · $119/mo
- Projected year-2 tax
- $1,558 · $130/mo
- Expected delta
- +$130/yr (+$11/mo · 9.1%)
ⓘ Screening estimate from a state-policy table — verify with the county assessor before closing.
Climate risk First Street
- Flood 1/10 Low FEMA zone X (unshaded) · 0% chance over 30 yrs
- Wildfire 4/10 Moderate
- Heat 6/10 Major 7 d/yr ≥104°F today · 17 d/yr by 30 yrs out
- Wind 4/10 Moderate 18% chance of damaging wind over 30 yrs
- Air quality 3/10 Moderate 3 unhealthy d/yr today · 3 by 30 yrs out
Nearby sold comps map
Loading sold comps map…
Walkable amenities ~0.75 mi
Loading nearby amenities…
Taxation est. · year 1
- Rental income
- $18,391
- − Mortgage interest
- −$10,643
- − Property taxes
- −$1,428
- − Insurance
- −$950
- − Repairs & maintenance
- −$1,471
- − Management
- −$1,471
- − Depreciation
- −$5,527
- Taxable loss
- −$3,100
- Est. tax savings @ 24.0%
- +$744
- After-tax cash flow
- $938/yr
For passive investors: Depreciation is non-cash, so a rental often shows a tax loss while cash-flowing — sheltering income. Rental losses are passive: they offset passive income freely, and up to $25,000/yr can offset ordinary (W-2) income if you actively participate and your MAGI is under $100k (phasing out to $0 by $150k); unused losses carry forward. On sale, claimed depreciation is recaptured at up to 25%, and gains may owe capital-gains tax (a 1031 exchange can defer both). Figures are a year-1 estimate at your 24.0% rate — not tax advice; consult a CPA.
Schools (NCES district)
- District
- Gaston County Schools
- NCES district ID
- 3701620
- Math proficiency
- 44% ▲ 4.00%
- Reading proficiency
- 42% ▲ 1.00%
- Median HH income
- $43,644
- Composite
- 36.39/100
- National rank
- #4680
- State rank
- #93 of 178 in NC
Livability — Gastonia
- Score
- 59/100
- State rank
- #528
- US rank
- #19444
Category grades
Schools grade is shown separately in the Schools card above.
Census & demographics
- Census place
- Gastonia, NC
- County
- Gaston County · 201,497 people
- City population
- 114,179
- Metro
- Charlotte-Concord-Gastonia, NC-SC
- Population (ZIP)
- 36,272
- Household income
- $49,643
- Rent vs Own
- Severe rent burden
- 1521.0
Population outlook (Gaston County) Hauer SSP2
- Today (2025)
- 230,027 people
- By 2030
- 237,300 · +3.2%
- By 2040
- 249,659 · +8.5%
- By 2050
- 257,806 · +12.1%
- By 2075
- 272,163 · +18.3%
- By 2100
- 268,652 · +16.8%
Race, ethnicity, and origin ACS 2023
- Neighborhood character
- Diverse neighborhood (Simpson 0.65)
- Race & ethnicity
- White 46% Black 33% Hispanic / Latino 16% Two or more races 9%
- Hispanic origin (detail)
- Mexican 6% Puerto Rican 2%
- Common ancestry
- Serbian 2% Slovak 1% Italian 1%
- Foreign-born
- 7% · Canada, Dominican Republic, Jamaica
- Languages at home
- 86% English-only · Spanish 13%
Political lean MEDSL · Gaston
- 2024 margin
- Strong R (+25.0) · D 37.0% · R 62.1%
- 2008→2024 swing
- 0.0pp no change · 2008: -25.0pp · 2024: -25.0pp
- All cycles
- 2024: R+25.0 2020: R+27.8 2016: R+32.1 2012: R+25.6 2008: R+25.0
Not yet ingested
- Civics
- —
Market trends
- HPI YoY
- ▼ -348.71%
- Current HPI
- 252.912
- Rent YoY
- ▲ 5.63%
- Metro
- Charlotte-Concord-Gastonia, NC-SC
- State GDP YoY
- ▲ 3.28%
- F500 in state
- 26
Industry mix (Fortune 500 HQ in NC)
| Industry | F500 HQs | Revenue |
|---|---|---|
| Financial Services | 2 | $213B |
|
||
| Retail | 2 | $95B |
|
||
| Industrial Conglomerate | 1 | $38B |
|
||
| Metals / Steel | 1 | $35B |
|
||
| Utilities | 1 | $30B |
|
||
| Industrial Machinery | 1 | $19B |
|
||
Price history
+672.8% since first listed9 events — show timeline
- 2026-05-11 Price Changed $204,800 CANOPYMLS as Distributed by MLS Grid
- 2026-05-07 Price Changed $208,900 CANOPYMLS as Distributed by MLS Grid
- 2026-04-29 Price Changed $211,900 CANOPYMLS as Distributed by MLS Grid
- 2026-04-18 Price Changed $216,000 CANOPYMLS as Distributed by MLS Grid
- 2026-04-17 Price Changed $224,000 CANOPYMLS as Distributed by MLS Grid
- 2026-04-14 Listed $227,900 CANOPYMLS as Distributed by MLS Grid
- 2026-04-11 Coming Soon $227,900 CANOPYMLS as Distributed by MLS Grid
- 2019-06-11 Sold (Public Records) $139,000 Public Records
- 1995-01-20 Sold (Public Records) $26,500 Public Records
Property tax history
+5.8%/yrLatest (2025): $1,428 · +0.0% YoY. Source: county tax records.
Cash-flow waterfall
monthlySold comps — $/sqft
last 12 mo · ≤1 miLoading sold comps…