 🏗️ New Construction
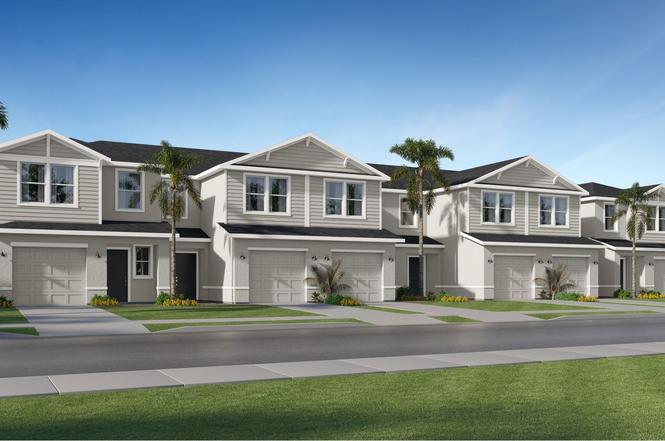
Ashford Plan · North Fort Myers, FL
Flood risk 1/10 · Minimal
- FEMA flood zone
- X (unshaded)
- Chance of flooding over 30 yrs
- 0.0%
- Est. flood insurance / yr
- $507 – $1,088
Fire risk 7/10 · Major
- Est. fire insurance / yr
- $947 – $1,759
Heat risk 10/10 · Severe
- Hot days now (above 107°F)
- 7 days/yr
- Hot days in 30 yrs
- 30 days/yr
Wind risk 10/10 · Severe
- Chance of severe wind over 30 yrs
- 99.0%
Air-quality risk 2/10 · Minimal
- Unhealthy air days now
- 1 days/yr
- Unhealthy air days in 30 yrs
- 1 days/yr
Risk factors via First Street. Map © Google.
Why this score? — see what drove the F grade
The composite is a weighted blend of 9 inputs, each scored 0–100. Each bar is that input's sub-score; the figure is the points it added to the 100-point composite (weight × sub-score).
- Cash flow +8.0/30.0
- ARV discount +7.5/15.0
- Schools +4.1/10.0
- Livability +3.7/5.0
- Rent growth +3.2/5.0
- 1% rule +2.5/10.0
- Condition / age +2.5/5.0
- DSCR +2.1/10.0
- Appreciation +0.0/10.0
$199,990
🖨 Deal sheet 📄 Offer letter ✓ Due diligence
Listing remarks
This new two-story townhome features a smart layout designed to maximize space. On the first floor is an open-plan layout connecting a multifunctional kitchen, lovely dining area and welcoming Great Room, which features sliding glass doors to a patio that's perfect for outdoor relaxation. Ideally situated upstairs are two secondary bedrooms and a tranquil owner's suite complete with a private bathroom.
Key facts
- Low hoa fees
- Close to shops
- New townhomes
Tags
Property features AI
Finance
- Other: Address: North Fort Myers, FL 33917
- Financial info: List price $199,990
Exterior
- Parking: 1 garage space (1 total parking space)
- Home design: Single-family plan (Ashford)
- Exterior features: Living area approximately 1,343
Interior
- Bedrooms: 3 bedrooms
- Bathrooms: 2 full bathrooms and 1 half bathroom (2.5 total)
- Interior features: Plan named Ashford; New construction plan
Neighborhood map
What this means for you Summary
Snapshot
- This is a 3-bed/2.5-bath townhouse listed at $200k.
Deal economics
- At list price, monthly cash flow is $-279 ($-3k/yr) — negative.
- The deal already cash-flows at list — no discount required.
- Meets the 1% rule at list price ($2k rent vs $200k).
- Recommended offer: $176k (12.0% below list) — sets the bar for market timing.
- Cap rate 5.1% vs local median 3.6% in North Fort Myers — top-decile yield for the area; either an underpriced asset or a hidden risk that comps aren't pricing in. Stress-test before assuming the spread holds.
Location & tenants
- Location reads 74/100 on livability (#269 in FL, #4,409 nationally) — a middle-class / working-renter tenant base. Strengths: cost of living A+, housing A+, health & safety A+; Watch: employment C-, amenities F, commute F.
- Lee (suburban): math 47% / reading 50% proficiency, ranked #42 of 73 in FL (top 58%) — families likely to look elsewhere, expect single-tenant / working-renter base with shorter leases.
- Market conditions: Rents rising (+2.6%/yr); 841 active listings in the ZIP; 40 comparable units currently listed for rent nearby; rentals at typical pace (median 24d on market — plan ~3-4 weeks tenant-placement turnaround); 15,411 units permitted in Lee County in 2024 (4,686 in 5+ unit buildings).
- This rent runs 45% of the median local income ($55k/yr) — at the standard rent-burdened threshold; future hikes will face affordability resistance.
Forward outlook
- Local home prices are declining (-3.0%/yr); year-one equity from $2k of loan paydown is wiped out by about $8k of value loss. Plan a longer hold.
- Lee County population projected at +44% by 2050 — long-run rental-demand tailwind backs the buy-and-hold thesis.
Negotiation context
- It's been on market 193 days — a 12% lower offer ($176k) is reasonable based on typical stale-listing flexibility.
Risks & watch-outs
- Climate carrying-cost: severe wind risk, 99% chance of damaging wind over 30y; major wildfire risk; extreme-heat days projected 7→30/yr by 2055 (HVAC capex compounding) — expect insurance premiums to compound above CPI over the hold.
Questions for the listing agent
- What do current leases actually rent for vs. the listed asking? Can we see a recent rent roll and the last 12 months of T-12 income?
- It's been on market 193 days. Have you received any prior offers? Is the seller open to a 12% concession, seller financing, or rate buy-down credit?
- Why hasn't it sold? Are there any deal-killer items the seller is aware of (foundation, flood, title, zoning, code violations)?
- Is there a deadline driving the sale (1031 exchange, divorce, estate, relocation)? That informs how much negotiation room exists.
- The area grade is low — what's the realistic commute time and amenity access for the typical tenant pool here? Any planned neighborhood developments (good or bad) we should know about?
- What's the average days-on-market for RENTAL listings here right now (not sales)? A rising rental-DOM trend means longer vacancies and softer asking-rent achievability than the comps imply.
- What's the recent tenant-quality profile in this submarket — average credit score on applications, eviction rate, late-payment / NSF rate, and stable-employment percentage? A property-management company in the area should have these aggregated.
- How much new for-sale + rental construction is in the pipeline within 1–3 miles? Heavy new supply typically softens prices + rents 12–24 months out; constrained supply supports both.
Investment metrics
- 1% rule
- 0.75% ✗
- Cap rate
- 5.07%
- Cash-on-cash
- -4.37%
- DSCR
- 0.81
- GRM
- 11.2
CMA / ARV
- ARV (on-the-fly)
- $273,972
- Comps found
- 4
Show comp detail 4 sales within ~0.75 mi
| Address | Dist | Beds/Ba | Sqft | Sold | Price | $/sf | Match |
|---|---|---|---|---|---|---|---|
| 17523 Paradiso Way | 0.40mi | 3/2.5 | 1,347 (+0%) | 1mo | $210,000 | $156 | 80 |
| 17499 Monte Isola Way | 0.42mi | 3/2.5 | 1,405 (+5%) | 1mo | $210,000 | $149 | 72 |
| 4255 Cirella Ct | 0.22mi | 3/2.5 | 1,347 (+0%) | 22mo | $276,298 | $205 | 71 |
| 4252 Cirella Ct | 0.26mi | 3/2.5 | 1,347 (+0%) | 20mo | $275,000 | $204 | 71 |
Match score weights: distance 35% · size 25% · config 20% · recency 20%. Top-matched comps best support the ARV.
Projected returns pro-forma
-3.0% appreciation · 2.63% rent growth · sell at horizon
- IRR
- -24.1%
- Equity multiple
- 0.18×
- Total profit
- $-62,898
- Equity at exit
- $40,850
- IRR
- -20.3%
- Equity multiple
- -0.05×
- Total profit
- $-80,620
- Equity at exit
- $23,688
Cash invested: $76,712 (down + closing). Projections, not guarantees.
Landlord ↔ Tenant lean methodology
- Overall (STATE)
- 87 Strongly Landlord-Friendly
- State Florida
- 87 Strongly Landlord-Friendly · R+3
- County
- — inherits STATE
- City
- — inherits STATE
ZIP-level market 33917
- Home prices YoY
- -30.2%
- Rents YoY
- 2.6%
- Active inventory
- 841
- Price-to-rent
- 8.2×
Monthly cashflow live
- Estimated rent
- $2,043 high interval (Pro) →
- Mortgage (P&I)
- −$1,437
- Tax est. 1.5%
- −$342 /mo · $4,110/yr
- Insurance
- −$114
- HOA
- −$0
- Vacancy / Maint / Mgmt
- −$429
- Net cashflow
- $-279
Break-even live
UW: 25.0% down · 7.5% · 30yr · 1.5% tax · 5.0% vac · 8.0% maint · 8.0% mgmt
Financing live
Cash to close
- Down payment
- $68,493
- Closing costs
- $8,219
- Reserves months
- —
- Total cash needed
- —
Loan-product check · same deal, 3 products live
Conventional
25% down · 7.5% · 30yr
- Down + closing
- —
- Monthly P&I
- —
- Monthly cashflow
- —
- DSCR
- —
- Eligible?
- —
Personal DTI + credit; lowest rate.
DSCR
20% down · 8.5% · 30yr
- Down + closing
- —
- Monthly P&I
- —
- Monthly cashflow
- —
- DSCR
- —
- Eligible?
- —
No personal income docs; deal must DSCR.
Hard money
10% down · 12.0% · 12mo
- Down + closing
- —
- Monthly P&I
- —
- Monthly cashflow
- —
- DSCR
- —
- Eligible?
- —
Short-term bridge; refi at stabilization.
Rent comps 40 comps
| Address | Beds | Baths | Sqft | Rent | $/sqft | DOM | Units | Dist |
|---|---|---|---|---|---|---|---|---|
| 17669 Paradiso Way North Fort Myers, FL | 3.0 | 2.0 | 1551 | $1,999 | $1.29 | 3d | 1 | 0.20mi |
| 17669 Paradiso Way North Fort Myers, FL | 3.0 | 2.0 | 1551 | $1,999 | $1.29 | 23d | 1 | 0.20mi |
| 17392 Monte Isola Way North Fort Myers, FL | 4.0 | 2.5 | 1871 | $2,299 | $1.23 | 23d | 1 | 0.20mi |
| 4216 Villa Rapallo Way North Fort Myers, FL | 4.0 | 2.0 | 1817 | $2,000 | $1.10 | 2d | 1 | 0.23mi |
| 4275 Cirella Ct North Fort Myers, FL | 3.0 | 2.5 | 1378 | $1,800 | $1.31 | 23d | 1 | 0.24mi |
| 4106 Granita Ct North Fort Myers, FL | 4.0 | 2.5 | 1812 | $2,300 | $1.27 | 23d | 1 | 0.24mi |
| 4232 Villa Rapallo Way North Fort Myers, FL | 4.0 | 2.0 | 1812 | $1,900 | $1.05 | 23d | 1 | 0.25mi |
| 17400 Monte Isola Way North Fort Myers, FL | 3.0 | 2.0 | 1448 | $1,875 | $1.29 | 23d | 1 | 0.25mi |
| 4106 Lattuca Ln North Fort Myers, FL | 4.0 | 2.5 | 1874 | $2,200 | $1.17 | 23d | 1 | 0.29mi |
| 4264 Cirella Ct North Fort Myers, FL | 3.0 | 2.5 | 1442 | $2,000 | $1.39 | 11d | 1 | 0.30mi |
| 4276 Cirella Ct North Fort Myers, FL | 3.0 | 2.5 | 1378 | $1,800 | $1.31 | 23d | 1 | 0.32mi |
| 4208 Caterina Ct North Fort Myers, FL | 3.0 | 2.5 | 1347 | $1,800 | $1.34 | 14d | 1 | 0.34mi |
| 4241 Caterina Ct North Fort Myers, FL | 3.0 | 2.5 | 1529 | $1,900 | $1.24 | 16d | 1 | 0.35mi |
| 4228 Caterina Ct North Fort Myers, FL | 3.0 | 2.5 | 1700 | $1,850 | $1.09 | 11d | 1 | 0.36mi |
| 4106 San Felice Ln North Fort Myers, FL | 4.0 | 2.5 | 1874 | $2,400 | $1.28 | 23d | 1 | 0.39mi |
| 17225 Cantu Ct North Fort Myers, FL | 4.0 | 2.0 | 1824 | $2,200 | $1.21 | 23d | 1 | 0.41mi |
| 17489 Monte Isola Way North Fort Myers, FL | 3.0 | 2.5 | 1347 | $1,800 | $1.34 | 14d | 1 | 0.43mi |
| 17499 Monte Isola Way Unit 17499 North Fort Myers, FL | 3.0 | 2.5 | 1405 | $1,800 | $1.28 | 13d | 1 | 0.44mi |
| 17244 Cantu Ct North Fort Myers, FL | 4.0 | 2.0 | 1824 | $2,200 | $1.21 | 14d | 1 | 0.46mi |
| 17920 Antherium Ln North Fort Myers, FL | 2.0 | 2.0 | 1693 | $2,400 | $1.42 | 23d | 1 | 0.48mi |
| 535 Zebra Dr #535 North Fort Myers, FL | 3.0 | 2.0 | 1352 | $1,499 | $1.11 | 14d | 1 | 0.48mi |
| 574 Leopard Ln #574 North Fort Myers, FL | 4.0 | 2.0 | 1459 | $1,599 | $1.10 | 13d | 1 | 0.58mi |
| 3358 Sabal Springs Blvd North Fort Myers, FL | 3.0 | 2.0 | 1621 | $2,200 | $1.36 | 23d | 1 | 0.76mi |
| 266 Mongoose Ln #266 North Fort Myers, FL | 3.0 | 2.0 | 1372 | $1,499 | $1.09 | 3d | 1 | 0.84mi |
| 4120 Pine Drop Ln North Fort Myers, FL | 3.0 | 2.0 | 957 | $1,895 | $1.98 | 23d | 1 | 1.01mi |
| 2774 Wedgewood Dr North Fort Myers, FL | 2.0 | 2.0 | 880 | $1,300 | $1.48 | 23d | 1 | 1.09mi |
| 16363 Teresa Ln North Fort Myers, FL | 2.0 | 1.0 | 1000 | $1,000 | $1.00 | 23d | 1 | 1.28mi |
| 3961 Pomodoro Cir #204 Cape Coral, FL | 2.0 | 2.0 | 1270 | $1,450 | $1.14 | 23d | 1 | 1.38mi |
| 3961 Pomodoro Cir #204 Cape Coral, FL | 2.0 | 2.0 | 1270 | $1,450 | $1.14 | 16d | 1 | 1.38mi |
| 3973 Pomodoro Cir Cape Coral, FL | 2.0 | 2.0 | 1469 | $1,498 | $1.02 | 23d | 2 | 1.39mi |
| 3973 Pomodoro Cir Cape Coral, FL | 2.0 | 2.0 | 1534 | $1,575 | $1.03 | 2d | 3 | 1.39mi |
| 3957 Pomodoro Cir #301 Cape Coral, FL | 2.0 | 2.0 | 1270 | $1,450 | $1.14 | 16d | 1 | 1.40mi |
| 2913 Tuscan Dr #102 Cape Coral, FL | 2.0 | 2.0 | 1469 | $1,450 | $0.99 | 23d | 1 | 1.42mi |
| 3968 Pomodoro Cir #202 Cape Coral, FL | 2.0 | 2.0 | 1469 | $1,475 | $1.00 | 14d | 1 | 1.42mi |
| 3953 Pomodoro Cir Cape Coral, FL | 1.0–3.0 | 1.0–2.0 | 1044 | $1,624 | $1.56 | 14d | 9 | 1.44mi |
| 2909 Tuscan Dr Cape Coral, FL | 2.0 | 2.0 | 1469 | $1,475 | $1.00 | 23d | 2 | 1.44mi |
| 2904 Tuscan Dr #303 Cape Coral, FL | 2.0 | 2.0 | 1460 | $1,450 | $0.99 | 23d | 1 | 1.45mi |
| 2376 Case Ln Unit A North Fort Myers, FL | 2.0 | 2.0 | 1440 | $1,800 | $1.25 | 23d | 1 | 1.48mi |
| 3944 Pomodoro Cir #202 Cape Coral, FL | 3.0 | 2.0 | 1411 | $2,200 | $1.56 | 23d | 1 | 1.48mi |
| 3187 Cozumel Ct Cape Coral, FL | 3.0 | 2.0 | 1747 | $2,000 | $1.14 | 2d | 1 | 1.48mi |
Listing history 8 events
-
2026-06-17days on market $199,990 Active 193 DOM
-
2026-06-16days on market $199,990 Active 192 DOM
-
2026-06-16days on market $199,990 Active 191 DOM
-
2026-06-13days on market $199,990 Active 189 DOM
-
2026-06-09days on market $199,990 Active 185 DOM
-
2026-06-07days on market $199,990 Active 183 DOM
-
2026-06-01days on market $199,990 Active 177 DOM
-
2026-06-01days on market $199,990 Active 176 DOM
ⓘ Source: listings_history table (triggers on properties + properties_extension) + one-shot
backfill from property_details.listing_events for pre-trigger history.
Climate risk First Street
- Flood 1/10 Low FEMA zone X (unshaded) · 0% chance over 30 yrs
- Wildfire 7/10 Severe
- Heat 10/10 Extreme 7 d/yr ≥107°F today · 30 d/yr by 30 yrs out
- Wind 10/10 Extreme 99% chance of damaging wind over 30 yrs
- Air quality 2/10 Low 1 unhealthy d/yr today · 1 by 30 yrs out
Nearby sold comps map
Loading sold comps map…
Walkable amenities ~0.75 mi
Loading nearby amenities…
Taxation est. · year 1
- Rental income
- $24,521
- − Mortgage interest
- −$15,347
- − Property taxes
- −$4,110
- − Insurance
- −$1,370
- − Repairs & maintenance
- −$1,962
- − Management
- −$1,962
- − Depreciation
- −$7,970
- Taxable loss
- −$8,199
- Est. tax savings @ 24.0%
- +$1,968
- After-tax cash flow
- $-1,381/yr
For passive investors: Depreciation is non-cash, so a rental often shows a tax loss while cash-flowing — sheltering income. Rental losses are passive: they offset passive income freely, and up to $25,000/yr can offset ordinary (W-2) income if you actively participate and your MAGI is under $100k (phasing out to $0 by $150k); unused losses carry forward. On sale, claimed depreciation is recaptured at up to 25%, and gains may owe capital-gains tax (a 1031 exchange can defer both). Figures are a year-1 estimate at your 24.0% rate — not tax advice; consult a CPA.
Schools (NCES district)
- District
- Lee
- NCES district ID
- 1201080
- Math proficiency
- 47% ▼ -11.00%
- Reading proficiency
- 50% ▼ -4.00%
- Median HH income
- $49,518
- Composite
- 41.49/100
- National rank
- #3458
- State rank
- #42 of 73 in FL
Livability — North Fort Myers
- Score
- 74/100
- State rank
- #269
- US rank
- #4409
Category grades
Schools grade is shown separately in the Schools card above.
Census & demographics
- Census place
- North Fort Myers, FL
- County
- Lee County · 788,662 people
- City population
- 57,035
- Metro
- Cape Coral-Fort Myers, FL
- Population (ZIP)
- 33,380
- Household income
- $55,000
- Rent vs Own
- Severe rent burden
- 775.0
Population outlook (Lee County) Hauer SSP2
- Today (2025)
- 871,946 people
- By 2030
- 955,468 · +9.6%
- By 2040
- 1,113,587 · +27.7%
- By 2050
- 1,256,891 · +44.1%
- By 2075
- 1,560,270 · +78.9%
- By 2100
- 1,726,848 · +98.0%
Race, ethnicity, and origin ACS 2023
- Neighborhood character
- Predominantly White (85%)
- Race & ethnicity
- White 85% Hispanic / Latino 10% Two or more races 7% Asian 1% Black 1%
- Hispanic origin (detail)
- Mexican 2% Puerto Rican 1% Cuban 3%
- Common ancestry
- Lithuanian 3% Romanian 3% Slovak 2%
- Foreign-born
- 10% · Canada
- Languages at home
- 88% English-only · Spanish 9% Other Indo-European 1% Russian/Polish/Slavic 1%
Political lean MEDSL · Lee
- 2024 margin
- Strong R (+28.4) · D 35.5% · R 63.9%
- 2008→2024 swing
- -18.0pp toward R · 2008: -10.4pp · 2024: -28.4pp
- All cycles
- 2024: R+28.4 2020: R+19.2 2016: R+20.4 2012: R+16.6 2008: R+10.4
Not yet ingested
- Civics
- —
Market trends
- HPI YoY
- ▼ -122.28%
- Current HPI
- 282.2895
- Rent YoY
- ▲ 2.63%
- Metro
- Cape Coral-Fort Myers, FL
- State GDP YoY
- ▲ 3.28%
- F500 in state
- 36
Industry mix (Fortune 500 HQ in FL)
| Industry | F500 HQs | Revenue |
|---|---|---|
| Industrial Technology | 2 | $29B |
|
||
| Insurance | 2 | $17B |
|
||
| Retail | 1 | $60B |
|
||
| Technology Distribution | 1 | $58B |
|
||
| Homebuilding | 1 | $35B |
|
||
| Technology Manufacturing | 1 | $35B |
|
||
Cash-flow waterfall
monthlySold comps — $/sqft
last 12 mo · ≤1 miLoading sold comps…