312 Belleza Blvd #799 · Edgewater, FL
Flood risk No data
- FEMA flood zone
- —
- Chance of flooding over 30 yrs
- —
- Est. flood insurance / yr
- —
Fire risk No data
- Est. fire insurance / yr
- —
Heat risk No data
- Hot days now (above threshold)
- —
- Hot days in 30 yrs
- —
Wind risk No data
- Chance of severe wind over 30 yrs
- —
Air-quality risk No data
- Unhealthy air days now
- —
- Unhealthy air days in 30 yrs
- —
Risk factors via First Street. Map © Google.
Why this score? — see what drove the C+ grade
The composite is a weighted blend of 9 inputs, each scored 0–100. Each bar is that input's sub-score; the figure is the points it added to the 100-point composite (weight × sub-score).
- Cash flow +25.5/30.0
- DSCR +8.4/10.0
- ARV discount +7.5/15.0
- 1% rule +6.7/10.0
- Condition / age +4.2/5.0
- Schools +3.9/10.0
- Livability +3.6/5.0
- Rent growth +2.5/5.0
- Appreciation +0.0/10.0
$155,995
🖨 Deal sheet 📄 Offer letter ✓ Due diligence
Listing remarks
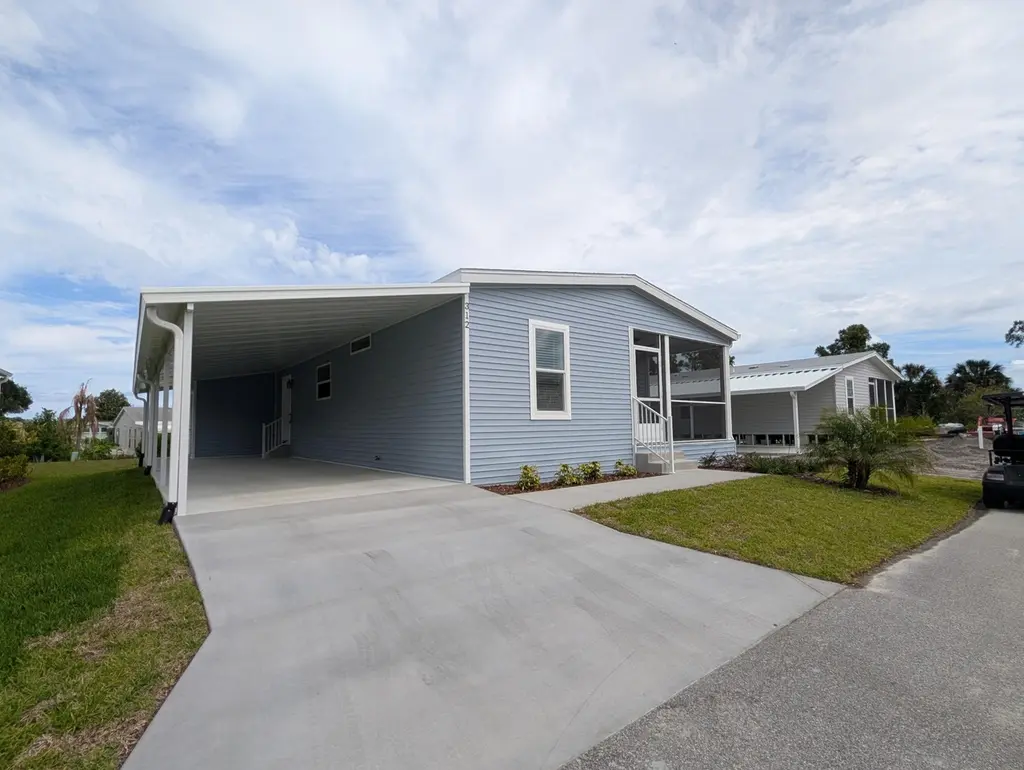
Located in Hacienda del Rio, a premier gated 55+ community, nestled along the Intracoastal. Beautiful brand New Palm Harbor home, ready for move in. Spacious and modern 2BR/2BA with gorgeous features you will love. Open kitchen with open shelving, stainless steel appliances, and a nice island that doubles as a breakfast bar. Formal dining room, large living room and 2 nicely sized bedrooms with a gorgeous primary suite bathroom that includes a large tiled shower with luxury rain shower head, and designer touches like under cabinet lighting. Call us today to see this home for yourself- it will sell fast!
Key facts
- Built 2026
- Listed 39 days
Neighborhood map
What this means for you Summary
Snapshot
- This is a 2-bed/2.0-bath manufactured listed at $156k. Condition is rated good.
Deal economics
- At list price, monthly cash flow is $364 ($4k/yr) — positive.
- The deal already cash-flows at list — no discount required.
- Meets the 1% rule at list price ($2k rent vs $156k).
- Recommended offer: $151k (3.0% below list) — sets the bar for market timing.
Location & tenants
- Location reads 72/100 on livability (#329 in FL) — a middle-class / working-renter tenant base. Strengths: cost of living A+, housing A+, health & safety A+; Watch: amenities D-, commute F.
- Volusia (suburban): math 44% / reading 49% proficiency, ranked #47 of 73 in FL (top 64%) — families likely to look elsewhere, expect single-tenant / working-renter base with shorter leases.
- Market conditions: 304 active listings in the ZIP; 4 comparable units currently listed for rent nearby; rentals at typical pace (median 23d on market — plan ~3-4 weeks tenant-placement turnaround); 3,402 units permitted in Volusia County in 2024 (681 in 5+ unit buildings).
- This rent runs 34% of the median local income ($64k/yr) — at the standard rent-burdened threshold; future hikes will face affordability resistance.
Forward outlook
- Local home prices are declining (-3.0%/yr); year-one equity from $1k of loan paydown is wiped out by about $5k of value loss. Plan a longer hold.
- Volusia County population projected at +19% by 2050 — long-run rental-demand tailwind backs the buy-and-hold thesis.
Negotiation context
- It's been on market 39 days — a 3% lower offer ($151k) is reasonable based on typical stale-listing flexibility.
Questions for the listing agent
- It's been on market 39 days. Have you received any prior offers? Is the seller open to a 3% concession, seller financing, or rate buy-down credit?
- Is there a deadline driving the sale (1031 exchange, divorce, estate, relocation)? That informs how much negotiation room exists.
- What's the average days-on-market for RENTAL listings here right now (not sales)? A rising rental-DOM trend means longer vacancies and softer asking-rent achievability than the comps imply.
- What's the recent tenant-quality profile in this submarket — average credit score on applications, eviction rate, late-payment / NSF rate, and stable-employment percentage? A property-management company in the area should have these aggregated.
- How much new for-sale + rental construction is in the pipeline within 1–3 miles? Heavy new supply typically softens prices + rents 12–24 months out; constrained supply supports both.
Investment metrics
- 1% rule
- 1.17% ✓
- Cap rate
- 9.09%
- Cash-on-cash
- 10.00%
- DSCR
- 1.44
- GRM
- 7.1
CMA / ARV
No comps found within radius.
Projected returns pro-forma
-3.0% appreciation · 3.0% rent growth · sell at horizon
- IRR
- -1.3%
- Equity multiple
- 0.95×
- Total profit
- $-2,073
- Equity at exit
- $23,259
- IRR
- 8.4%
- Equity multiple
- 1.64×
- Total profit
- $28,152
- Equity at exit
- $13,488
Cash invested: $43,679 (down + closing). Projections, not guarantees.
Landlord ↔ Tenant lean methodology
- Overall (STATE)
- 87 Strongly Landlord-Friendly
- State Florida
- 87 Strongly Landlord-Friendly · R+3
- County
- — inherits STATE
- City
- — inherits STATE
ZIP-level market 32141
- Home prices YoY
- -19.2%
- Active inventory
- 304
- Price-to-rent
- 7.1×
Monthly cashflow live
- Estimated rent
- $1,825 medium interval (Pro) →
- Mortgage (P&I)
- −$818
- Tax est. 1.5%
- −$195 /mo · $2,340/yr
- Insurance
- −$65
- HOA
- −$0
- Vacancy / Maint / Mgmt
- −$383
- Net cashflow
- $364
Break-even live
UW: 25.0% down · 7.5% · 30yr · 1.5% tax · 5.0% vac · 8.0% maint · 8.0% mgmt
Financing live
Cash to close
- Down payment
- $38,999
- Closing costs
- $4,680
- Reserves months
- —
- Total cash needed
- —
Loan-product check · same deal, 3 products live
Conventional
25% down · 7.5% · 30yr
- Down + closing
- —
- Monthly P&I
- —
- Monthly cashflow
- —
- DSCR
- —
- Eligible?
- —
Personal DTI + credit; lowest rate.
DSCR
20% down · 8.5% · 30yr
- Down + closing
- —
- Monthly P&I
- —
- Monthly cashflow
- —
- DSCR
- —
- Eligible?
- —
No personal income docs; deal must DSCR.
Hard money
10% down · 12.0% · 12mo
- Down + closing
- —
- Monthly P&I
- —
- Monthly cashflow
- —
- DSCR
- —
- Eligible?
- —
Short-term bridge; refi at stabilization.
Rent comps 4 comps
| Address | Beds | Baths | Sqft | Rent | $/sqft | DOM | Units | Dist |
|---|---|---|---|---|---|---|---|---|
| 287 Club Rio Dr Edgewater, FL | 2.0 | 2.0 | 1152 | $1,599 | $1.39 | 14d | 1 | 0.65mi |
| 20 River Park Blvd Edgewater, FL | 2.0 | 1.0 | 1000 | $1,700 | $1.70 | 14d | 1 | 0.94mi |
| 3413 Juniper Dr Edgewater, FL | 2.0 | 1.0 | 1000 | $1,500 | $1.50 | 23d | 1 | 1.41mi |
| 3318 India Palm Dr Edgewater, FL | 2.0 | 2.0 | 1200 | $1,875 | $1.56 | 23d | 1 | 1.50mi |
Listing history 6 events
-
2026-06-03days on market $155,995 Active 39 DOM
-
2026-06-03days on market $155,995 Active 38 DOM
-
2026-06-01days on market $155,995 Active 37 DOM
-
2026-05-31days on market $155,995 Active 36 DOM
-
2026-05-31days on market $155,995 Active 35 DOM
-
2026-04-25$155,995 Active 610-char remark
ⓘ Source: listings_history table (triggers on properties + properties_extension) + one-shot
backfill from property_details.listing_events for pre-trigger history.
Nearby sold comps map
Loading sold comps map…
Walkable amenities ~0.75 mi
Loading nearby amenities…
Taxation est. · year 1
- Rental income
- $21,903
- − Mortgage interest
- −$8,738
- − Property taxes
- −$2,340
- − Insurance
- −$780
- − Repairs & maintenance
- −$1,752
- − Management
- −$1,752
- − Depreciation
- −$4,538
- Taxable income
- $2,003
- Est. tax owed @ 24.0%
- −$481
- After-tax cash flow
- $3,886/yr
For passive investors: Depreciation is non-cash, so a rental often shows a tax loss while cash-flowing — sheltering income. Rental losses are passive: they offset passive income freely, and up to $25,000/yr can offset ordinary (W-2) income if you actively participate and your MAGI is under $100k (phasing out to $0 by $150k); unused losses carry forward. On sale, claimed depreciation is recaptured at up to 25%, and gains may owe capital-gains tax (a 1031 exchange can defer both). Figures are a year-1 estimate at your 24.0% rate — not tax advice; consult a CPA.
Condition & rehab AI · 12 photos
This move-in-ready manufactured home in a gated community offers a modern and well-maintained living space with no immediate repairs needed.
Value-add opportunities
- Both Painting the exterior — Fresh paint can enhance curb appeal and property value.
- Both Landscaping improvements — Enhanced landscaping can attract more buyers and renters.
- Both Adding smart home features — Modern technology can increase the home's appeal and value.
- Both Upgrading the kitchen appliances — Newer appliances can make the kitchen more functional and attractive.
Renovation cost estimate screening
Value-add ROI direction
- Both Painting the exterior — Fresh paint can enhance curb appeal and property value. ↑
- Both Landscaping improvements — Enhanced landscaping can attract more buyers and renters. ↑
- Both Adding smart home features — Modern technology can increase the home's appeal and value. ↑
- Both Upgrading the kitchen appliances — Newer appliances can make the kitchen more functional and attractive. ↑
ⓘ Cost ranges are severity-bucket heuristics (US national rule-of-thumb). Get contractor quotes + a written scope before underwriting a rehab budget.
Schools (NCES district)
- District
- Volusia
- NCES district ID
- 1201920
- Math proficiency
- 44% ▼ -9.00%
- Reading proficiency
- 49% ▼ -3.00%
- Median HH income
- $42,946
- Composite
- 39.2/100
- National rank
- #4019
- State rank
- #47 of 73 in FL
Livability — Edgewater
- Score
- 72/100
- State rank
- #329
- US rank
- #5753
Category grades
Schools grade is shown separately in the Schools card above.
Census & demographics
- Census place
- Edgewater, FL
- County
- Volusia County · 556,871 people
- City population
- 18,726
- Metro
- Deltona-Daytona Beach-Ormond Beach, FL
- Population (ZIP)
- 18,726
- Household income
- $63,936
- Rent vs Own
- Severe rent burden
- 161.0
Population outlook (Volusia County) Hauer SSP2
- Today (2025)
- 572,749 people
- By 2030
- 598,695 · +4.5%
- By 2040
- 644,880 · +12.6%
- By 2050
- 681,451 · +19.0%
- By 2075
- 759,957 · +32.7%
- By 2100
- 778,902 · +36.0%
Race, ethnicity, and origin ACS 2023
- Neighborhood character
- Predominantly White (90%)
- Race & ethnicity
- White 90% Hispanic / Latino 4% Two or more races 3% Black 2%
- Common ancestry
- Romanian 6% Lithuanian 2% Slovak 1%
- Foreign-born
- 4% · Canada
- Languages at home
- 94% English-only · Spanish 2% Other Indo-European 2% German/W. Germanic 1%
Political lean MEDSL · Volusia
- 2024 margin
- Strong R (+21.8) · D 38.7% · R 60.5%
- 2008→2024 swing
- -27.4pp toward R · 2008: 5.7pp · 2024: -21.8pp
- All cycles
- 2024: R+21.8 2020: R+14.1 2016: R+13.1 2012: R+1.2 2008: D+5.7
Not yet ingested
- Civics
- —
Market trends
- HPI YoY
- ▼ -80.12%
- Current HPI
- 337.8301
- Rent YoY
- —
- Metro
- Deltona-Daytona Beach-Ormond Beach, FL
- State GDP YoY
- ▲ 3.28%
- F500 in state
- 36
Industry mix (Fortune 500 HQ in FL)
| Industry | F500 HQs | Revenue |
|---|---|---|
| Industrial Technology | 2 | $29B |
|
||
| Insurance | 2 | $17B |
|
||
| Retail | 1 | $60B |
|
||
| Technology Distribution | 1 | $58B |
|
||
| Homebuilding | 1 | $35B |
|
||
| Technology Manufacturing | 1 | $35B |
|
||
Cash-flow waterfall
monthlySold comps — $/sqft
last 12 mo · ≤1 miLoading sold comps…