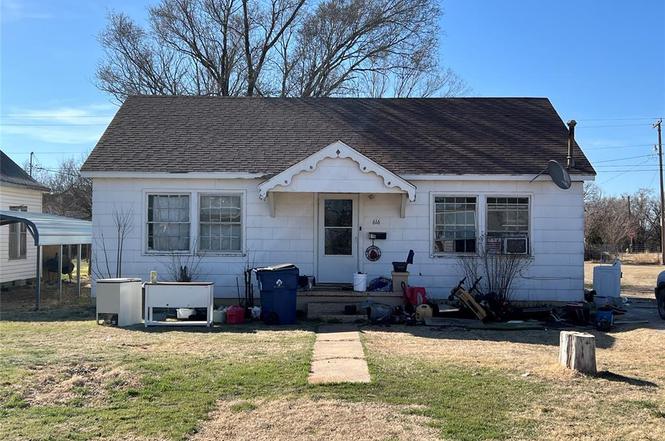
616 N 5th St · Okeene, OK
Flood risk 1/10 · Minimal
- FEMA flood zone
- X
- Chance of flooding over 30 yrs
- 0.0%
- Est. flood insurance / yr
- $507 – $1,088
Fire risk 1/10 · Minimal
- Est. fire insurance / yr
- $2,463 – $4,575
Heat risk 6/10 · Moderate
- Hot days now (above 109°F)
- 7 days/yr
- Hot days in 30 yrs
- 17 days/yr
Wind risk 2/10 · Minimal
- Chance of severe wind over 30 yrs
- 2.0%
Air-quality risk 1/10 · Minimal
- Unhealthy air days now
- 0 days/yr
- Unhealthy air days in 30 yrs
- 0 days/yr
Risk factors via First Street. Map © Google.
Why this score? — see what drove the A grade
The composite is a weighted blend of 9 inputs, each scored 0–100. Each bar is that input's sub-score; the figure is the points it added to the 100-point composite (weight × sub-score).
- Cash flow +30.0/30.0
- ARV discount +15.0/15.0
- 1% rule +10.0/10.0
- DSCR +10.0/10.0
- Appreciation +10.0/10.0
- Livability +3.7/5.0
- Schools +2.8/10.0
- Rent growth +2.5/5.0
- Condition / age +2.5/5.0
$38,000
🖨 Deal sheet (PDF) 📄 Offer letter ✓ Due diligence
Listing remarks
Come view this incredibly priced home in the interior of Okeene. Close to schools, downtown and easy access to the main highways. This would make a great first time home and/or investment property. AS IS.
Key facts
- 7,000 sq ft lot
- Built 1954
- Listed 116 days
Property features AI
Finance
- Other: Located in Okeene City addition; Directions available: From Main Street turn right/north on East B Street to 5th Street. House is on the right hand side.
- Financial info: Not assumable; Loan qualifying allowed; Current price listed (data provided)
- HOA & community: No mandatory association dues
Exterior
- Home design: Single family residence; One-level home; Existing property
- Construction: Brick and frame construction; Composition roof; Conventional foundation; Appraised living area
- Exterior features: Interior lot; Homestead eligible
Interior
- Bedrooms: 2 bedrooms
- Bathrooms: 1 full bathroom
- Heating & cooling: Floor furnace heating; Window air conditioning units
- Interior features: One living area; No fireplace
Neighborhood map
What this means for you Summary
Snapshot
- This is a 2-bed/1.0-bath single-family listed at $38k.
Deal economics
- At list price, monthly cash flow is $474 ($6k/yr) — positive.
- The deal already cash-flows at list — no discount required.
- Meets the 1% rule at list price ($889 rent vs $38k).
- Recommended offer: $35k (9.0% below list) — sets the bar for market timing.
Location & tenants
- Location reads 73/100 on livability (#19 in OK) — a middle-class / working-renter tenant base. Strengths: crime A+, cost of living A+, housing A+; Watch: employment C-, amenities F, commute F.
- Okeene (rural): math 30% / reading 30% proficiency, ranked #256 of 513 in OK (top 50%) — families likely to look elsewhere, expect single-tenant / working-renter base with shorter leases.
- Zoned schools: Okeene Es (math 17% / reading 22%, grade F, #479 of 845 statewide, top 63%, 176 students, 0% FRL); Okeene Jr-Sr Hs (Jr) (math 15% / reading 15%, grade F, #220 of 345 statewide, top 65%, 46 students, 0% FRL); Okeene Jr-Sr Hs (Sr) (math 10% / reading 10%, grade F, #361 of 447 statewide, top 94%, 106 students, 0% FRL) — zoned schools average 0% FRL vs 42% district-wide (42 pts lower); this property's tenant base skews higher-income than the district average.
- Zoned-school proficiency averages 15% at this address vs 30% district-wide (-15 pts) — the specific schools serving this property underperform the Okeene average; the district grade overstates school quality for this exact location.
- Market conditions: 9 active listings in the ZIP; 3 units permitted in Blaine County in 2024 (0 in 5+ unit buildings).
Forward outlook
- In year one you build about $4k of equity ($263 loan paydown + $4k appreciation (10.0% local appreciation)).
- Blaine County population projected at +21% by 2050 — long-run rental-demand tailwind backs the buy-and-hold thesis.
- At projected returns (10.0% appreciation + 3.0% rent growth), your $11k cash investment doubles in ~2 years — after that, you're playing with house money.
- By year 8, paydown + projected appreciation supports a ~$35k cash-out refi (75% LTV) — recoverable capital for the next deal without selling this one.
Negotiation context
- It's been on market 116 days — a 9% lower offer ($35k) is reasonable based on typical stale-listing flexibility.
- 3 sale attempts since 18y ago; this cycle's ask has dropped $10k (21%) from the opening price — seller is motivated, your offer sets the floor, not the list.
Risks & watch-outs
- Watch-outs: built in 1954 — expect roof / HVAC / electrical / plumbing capex.
- Climate carrying-cost: extreme-heat days projected 7→17/yr by 2055 (HVAC capex compounding) — expect insurance premiums to compound above CPI over the hold.
Questions for the listing agent
- It's been on market 116 days. Have you received any prior offers? Is the seller open to a 9% concession, seller financing, or rate buy-down credit?
- Built in 1954 — when were the roof, HVAC, electrical panel, plumbing, and water heater last replaced?
- Why hasn't it sold? Are there any deal-killer items the seller is aware of (foundation, flood, title, zoning, code violations)?
- Is there a deadline driving the sale (1031 exchange, divorce, estate, relocation)? That informs how much negotiation room exists.
- Schools are D-rated, which usually means shorter tenancies and higher turnover. Who's the typical renter profile here, and what's been the actual vacancy rate?
- What's the average days-on-market for RENTAL listings here right now (not sales)? A rising rental-DOM trend means longer vacancies and softer asking-rent achievability than the comps imply.
- What's the recent tenant-quality profile in this submarket — average credit score on applications, eviction rate, late-payment / NSF rate, and stable-employment percentage? A property-management company in the area should have these aggregated.
- How much new for-sale + rental construction is in the pipeline within 1–3 miles? Heavy new supply typically softens prices + rents 12–24 months out; constrained supply supports both.
Investment metrics
- 1% rule
- 2.34% ✓
- Cap rate
- 21.27%
- Cash-on-cash
- 53.49%
- DSCR
- 3.38
- GRM
- 3.6
CMA / ARV
- ARV (on-the-fly)
- $71,712
- Comps found
- 2
Show comp detail 2 sales within ~0.75 mi
| Address | Dist | Beds/Ba | Sqft | Sold | Price | $/sf | Match |
|---|---|---|---|---|---|---|---|
| 415 N Broadway | 0.39mi | 3/1.5 (+1) | 888 (-11%) | 3mo | $30,000 | $34 | 54 |
| 418 W E St | 0.44mi | 2/1.0 | 1,118 (+12%) | 12mo | $81,000 | $72 | 49 |
Match score weights: distance 35% · size 25% · config 20% · recency 20%. Top-matched comps best support the ARV.
Projected returns pro-forma
10.0% appreciation · 3.0% rent growth · sell at horizon
- IRR
- 66.6%
- Equity multiple
- 5.78×
- Total profit
- $50,892
- Equity at exit
- $34,233
- IRR
- 60.2%
- Equity multiple
- 12.85×
- Total profit
- $126,102
- Equity at exit
- $73,826
Cash invested: $10,640 (down + closing). Projections, not guarantees.
Landlord ↔ Tenant lean methodology
- Overall (STATE)
- 83 Strongly Landlord-Friendly
- State Oklahoma
- 83 Strongly Landlord-Friendly · R+20
- County
- — inherits STATE
- City
- — inherits STATE
ZIP-level market 73763
- Home prices YoY
- 5.1%
- Active inventory
- 9
- Price-to-rent
- 3.6×
Monthly cashflow live
- Estimated rent
- $889 medium interval (Pro) →
- Mortgage (P&I)
- −$199
- Tax from tax record
- −$13 /mo · $157/yr
- Insurance
- −$16
- HOA
- −$0
- Vacancy / Maint / Mgmt
- −$187
- Net cashflow
- $474
Break-even live
Sensitivity live
| Price | -10% $496 | -5% $485 | +0% $474 | +5% $463 | +10% $453 |
|---|---|---|---|---|---|
| Rent | -10% $404 | -5% $439 | +0% $474 | +5% $509 | +10% $544 |
| Rate | -1.0pp $493 | -0.5pp $484 | base $474 | +0.5pp $464 | +1.0pp $454 |
UW: 25.0% down · 7.5% · 30yr · 1.5% tax · 5.0% vac · 8.0% maint · 8.0% mgmt
Financing live
Cash to close
- Down payment
- $9,500
- Closing costs
- $1,140
- Reserves months
- —
- Total cash needed
- —
Loan-product check · same deal, 3 products live
Conventional
25% down · 7.5% · 30yr
- Down + closing
- —
- Monthly P&I
- —
- Monthly cashflow
- —
- DSCR
- —
- Eligible?
- —
Personal DTI + credit; lowest rate.
DSCR
20% down · 8.5% · 30yr
- Down + closing
- —
- Monthly P&I
- —
- Monthly cashflow
- —
- DSCR
- —
- Eligible?
- —
No personal income docs; deal must DSCR.
Hard money
10% down · 12.0% · 12mo
- Down + closing
- —
- Monthly P&I
- —
- Monthly cashflow
- —
- DSCR
- —
- Eligible?
- —
Short-term bridge; refi at stabilization.
Listing history 25 events
-
2026-06-21days on market $38,000 Active 116 DOM
-
2026-06-21days on market $38,000 Active 115 DOM
-
2026-06-18days on market $38,000 Active 113 DOM
-
2026-06-17days on market $38,000 Active 112 DOM
-
2026-06-16days on market $38,000 Active 111 DOM
-
2026-06-15days on market $38,000 Active 110 DOM
-
2026-06-13days on market $38,000 Active 108 DOM
-
2026-06-12days on market $38,000 Active 107 DOM
-
2026-06-09days on market $38,000 Active 104 DOM
-
2026-06-08days on market $38,000 Active 103 DOM
-
2026-06-08days on market $38,000 Active 102 DOM
-
2026-06-07days on market $38,000 Active 101 DOM
-
2026-06-04days on market $38,000 Active 98 DOM
-
2026-06-02days on market $38,000 Active 97 DOM
-
2026-06-01days on market $38,000 Active 96 DOM
-
2026-05-31days on market $38,000 Active 95 DOM
-
2026-02-23$48,000 Active
-
2021-03-01soldstatus $35,000
-
2021-01-12$38,000
-
2018-01-03soldstatus $31,000
-
2008-09-28historical
-
2008-06-23soldstatus $32,500
-
2008-03-28$29,500
-
2006-07-21soldstatus $14,500
-
2004-11-25soldstatus $10,000
ⓘ Source: listings_history table (triggers on properties + properties_extension) + one-shot
backfill from property_details.listing_events for pre-trigger history.
Tax reassessment forecast OK · Resets to sale price
- Current annual tax
- $157 · $13/mo
- Projected year-2 tax
- $342 · $28/mo
- Expected delta
- +$185/yr (+$15/mo · 117.8%)
ⓘ Screening estimate from a state-policy table — verify with the county assessor before closing.
Climate risk First Street
- Flood 1/10 Low FEMA zone X · 0% chance over 30 yrs
- Wildfire 1/10 Low
- Heat 6/10 Major 7 d/yr ≥109°F today · 17 d/yr by 30 yrs out
- Wind 2/10 Low 2% chance of damaging wind over 30 yrs
- Air quality 1/10 Low 0 unhealthy d/yr today · 0 by 30 yrs out
Nearby sold comps map
Loading sold comps map…
Walkable amenities ~0.75 mi
Loading nearby amenities…
Taxation est. · year 1
- Rental income
- $10,670
- − Mortgage interest
- −$2,129
- − Property taxes
- −$157
- − Insurance
- −$190
- − Repairs & maintenance
- −$854
- − Management
- −$854
- − Depreciation
- −$1,105
- Taxable income
- $5,382
- Est. tax owed @ 24.0%
- −$1,292
- After-tax cash flow
- $4,399/yr
For passive investors: Depreciation is non-cash, so a rental often shows a tax loss while cash-flowing — sheltering income. Rental losses are passive: they offset passive income freely, and up to $25,000/yr can offset ordinary (W-2) income if you actively participate and your MAGI is under $100k (phasing out to $0 by $150k); unused losses carry forward. On sale, claimed depreciation is recaptured at up to 25%, and gains may owe capital-gains tax (a 1031 exchange can defer both). Figures are a year-1 estimate at your 24.0% rate — not tax advice; consult a CPA.
Schools (NCES district)
- District
- Okeene
- NCES district ID
- 4022650
- Math proficiency
- 30% ▼ -10.00%
- Reading proficiency
- 30% ▲ 5.00%
- Median HH income
- $43,708
- Composite
- 28.44/100
- National rank
- #12108
- State rank
- #256 of 513 in OK
Livability — Okeene
- Score
- 73/100
- State rank
- #19
- US rank
- #5599
Category grades
Schools grade is shown separately in the Schools card above.
Census & demographics
- Census place
- Okeene, OK
- Population (ZIP)
- 1,746
Population outlook (Blaine County) Hauer SSP2
- Today (2025)
- 10,545 people
- By 2030
- 10,898 · +3.3%
- By 2040
- 11,795 · +11.9%
- By 2050
- 12,754 · +20.9%
- By 2075
- 15,721 · +49.1%
- By 2100
- 16,043 · +52.1%
Race, ethnicity, and origin ACS 2023
- Neighborhood character
- Predominantly White (79%)
- Race & ethnicity
- White 79% Hispanic / Latino 13% Two or more races 11% Native American 2%
- Hispanic origin (detail)
- Mexican 12%
- Common ancestry
- Slovak 8% Romanian 4% Lithuanian 3%
- Foreign-born
- 4% · Canada
- Languages at home
- 87% English-only · Spanish 11% German/W. Germanic 2%
Political lean MEDSL · Blaine
- 2024 margin
- Solid R (+63.0) · D 17.7% · R 80.7% · Other 1.6%
- 2008→2024 swing
- -12.1pp toward R · 2008: -50.8pp · 2024: -63.0pp
- All cycles
- 2024: R+63.0 2020: R+62.8 2016: R+57.3 2012: R+48.0 2008: R+50.8
Not yet ingested
- Civics
- —
Market trends
- HPI YoY
- ▲ 10.11%
- Current HPI
- 209.7871
- Rent YoY
- —
- Metro
- —
- State GDP YoY
- ▲ 1.55%
- F500 in state
- 6
Industry mix (Fortune 500 HQ in OK)
| Industry | F500 HQs | Revenue |
|---|---|---|
| Energy | 3 | $48B |
|
||
Price history
+380.0% since first listed9 events — show timeline
- 2026-02-23 Listed $48,000 MLSOK
- 2021-03-01 Sold (MLS) $35,000 NWOAR
- 2021-01-12 Listed $38,000 NWOAR
- 2018-01-03 Sold (Public Records) $31,000 Public Records
- 2008-09-28 Listing Removed — MLSOK
- 2008-06-23 Sold (Public Records) $32,500 Public Records
- 2008-03-28 Listed $29,500 MLSOK
- 2006-07-21 Sold (Public Records) $14,500 Public Records
- 2004-11-25 Sold (Public Records) $10,000 Public Records
Property tax history
-2.7%/yrLatest (2025): $157 · +4.0% YoY. Source: county tax records.
Cash-flow waterfall
monthlySold comps — $/sqft
last 12 mo · ≤1 miLoading sold comps…