3051 Seamon Ave · Baltimore, MD
Flood risk 1/10 · Minimal
- FEMA flood zone
- X (unshaded)
- Chance of flooding over 30 yrs
- 0.0%
- Est. flood insurance / yr
- $473 – $860
Fire risk 1/10 · Minimal
- Est. fire insurance / yr
- $755 – $1,403
Heat risk 8/10 · Major
- Hot days now (above 102°F)
- 7 days/yr
- Hot days in 30 yrs
- 15 days/yr
Wind risk 6/10 · Moderate
- Chance of severe wind over 30 yrs
- 27.0%
Air-quality risk 4/10 · Minor
- Unhealthy air days now
- 5 days/yr
- Unhealthy air days in 30 yrs
- 7 days/yr
Risk factors via First Street. Map © Google.
Why this score? — see what drove the D+ grade
The composite is a weighted blend of 9 inputs, each scored 0–100. Each bar is that input's sub-score; the figure is the points it added to the 100-point composite (weight × sub-score).
- Cash flow +22.2/30.0
- DSCR +7.1/10.0
- 1% rule +5.1/10.0
- Livability +3.8/5.0
- Rent growth +3.5/5.0
- Condition / age +2.5/5.0
- ARV discount +2.2/15.0
- Schools +1.0/10.0
- Appreciation +0.0/10.0
$170,000
🖨 Deal sheet 📄 Offer letter ✓ Due diligence
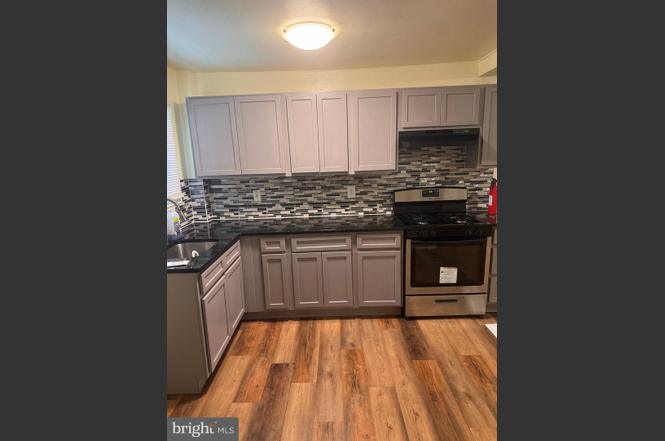
Listing remarks
Welcome Home! Charming 2BR + Office with Modern Updates & Private Parking Discover this well-maintained and move-in-ready home offering comfort, functionality, and convenience. Featuring 2 spacious bedrooms, a dedicated office, and 1.5 bathrooms, this property is packed with valuable upgrades and thoughtful living space. ✨ Key Features: New roof and brand-new A/C & heating system 5-year-old boiler New washer Updated kitchen with gas range, range hood, and pantry for ample storage Finished basement—perfect for additional living or entertainment space Enclosed front and back porches for year-round enjoyment Private off-street parking 📍 Prime Location: Conveniently located ne
Key facts
- Parking
- Built 1948
- Listed 3 days
Neighborhood map
What this means for you Summary
Snapshot
- This is a 2-bed/1.5-bath townhouse listed at $170k.
Deal economics
- At list price, monthly cash flow is $276 ($3k/yr) — positive.
- The deal already cash-flows at list — no discount required.
- Meets the 1% rule at list price ($2k rent vs $170k).
- Cap rate 8.2% vs local median 6.0% in Baltimore — top-decile yield for the area; either an underpriced asset or a hidden risk that comps aren't pricing in. Stress-test before assuming the spread holds.
Location & tenants
- Location reads 76/100 on livability (#90 in MD, #3,396 nationally) — a middle-class / working-renter tenant base. Strengths: amenities A+, commute A+, housing A+; Watch: schools D, crime F.
- Baltimore City Public Schools (urban): math 7% / reading 16% proficiency, ranked #24 of 24 in MD (top 100%) — low school quality limits family demand, transient renter base, plan for 1-2y turnover; 79% free/reduced lunch — lower-income household profile, screen leases tightly.
- Market conditions: Rents rising fast (+4.1%/yr); 165 active listings in the ZIP; 40 comparable units currently listed for rent nearby; rentals at typical pace (median 18d on market — plan ~3-4 weeks tenant-placement turnaround); 1,273 units permitted in Baltimore city in 2024 (1,104 in 5+ unit buildings).
- This rent runs 38% of the median local income ($54k/yr) — at the standard rent-burdened threshold; future hikes will face affordability resistance.
Forward outlook
- Local home prices are declining (-3.0%/yr); year-one equity from $1k of loan paydown is wiped out by about $5k of value loss. Plan a longer hold.
- Baltimore County population projected to shrink 4% by 2050 — rents likely to lag national; underwrite the cash flow, not the appreciation.
Negotiation context
- Only 3 days on market — expect competitive offers; lowballing is unlikely to land.
- 8 sale attempts since 26y ago with the ask held roughly flat each time — persistent listings suggest the price (not the market) is what's stuck; bring a comps-based counter.
- Current owner paid $70k; list at $170k implies a 143% gain — meaningful room to come down on a strong offer.
Risks & watch-outs
- Watch-outs: built in 1948 — expect roof / HVAC / electrical / plumbing capex.
- Climate carrying-cost: major wind risk, 27% chance of damaging wind over 30y; extreme-heat days projected 7→15/yr by 2055 (HVAC capex compounding) — expect insurance premiums to compound above CPI over the hold.
Questions for the listing agent
- Built in 1948 — when were the roof, HVAC, electrical panel, plumbing, and water heater last replaced?
- Is there a deadline driving the sale (1031 exchange, divorce, estate, relocation)? That informs how much negotiation room exists.
- Schools are D-rated, which usually means shorter tenancies and higher turnover. Who's the typical renter profile here, and what's been the actual vacancy rate?
- Crime grade is F in this area — have there been break-ins, vandalism, or insurance claims at this property in the last 3 years? What carrier currently insures it and at what premium?
- The area grade is low — what's the realistic commute time and amenity access for the typical tenant pool here? Any planned neighborhood developments (good or bad) we should know about?
- What's the average days-on-market for RENTAL listings here right now (not sales)? A rising rental-DOM trend means longer vacancies and softer asking-rent achievability than the comps imply.
- What's the recent tenant-quality profile in this submarket — average credit score on applications, eviction rate, late-payment / NSF rate, and stable-employment percentage? A property-management company in the area should have these aggregated.
- How much new for-sale + rental construction is in the pipeline within 1–3 miles? Heavy new supply typically softens prices + rents 12–24 months out; constrained supply supports both.
Investment metrics
- 1% rule
- 1.01% ✓
- Cap rate
- 8.24%
- Cash-on-cash
- 6.95%
- DSCR
- 1.31
- GRM
- 8.3
CMA / ARV
- ARV (on-the-fly)
- $152,064
- Comps found
- 10
Show comp detail 10 sales within ~0.75 mi
| Address | Dist | Beds/Ba | Sqft | Sold | Price | $/sf | Match |
|---|---|---|---|---|---|---|---|
| 3041 Southland Ave | 0.05mi | 3/1.5 (+1) | 1,240 (+8%) | 10mo | $210,000 | $169 | 72 |
| 604 Cheraton Rd | 0.42mi | 3/1.5 (+1) | 1,174 (+2%) | 6mo | $95,000 | $81 | 67 |
| 2847 Joseph Ave | 0.50mi | 3/1.5 (+1) | 1,116 (-3%) | 1mo | $235,000 | $211 | 66 |
| 3049 Ascension St | 0.10mi | 2/2.0 | 1,262 (+10%) | 15mo | $180,000 | $143 | 65 |
| 3036 Seamon Ave | 0.04mi | 3/2.5 (+1) | 1,240 (+8%) | 16mo | $259,000 | $209 | 64 |
| 504 Roundview | 0.21mi | 3/1.5 (+1) | 1,024 (-11%) | 7mo | $98,000 | $96 | 61 |
| 628 Roundview Rd | 0.25mi | 3/1.0 (+1) | 1,024 (-11%) | 3mo | $85,100 | $83 | 60 |
| 2741 Bookert Dr | 0.58mi | 3/1.0 (+1) | 1,204 (+4%) | 13mo | $44,000 | $37 | 48 |
| 2825 Round Rd | 0.63mi | 2/1.5 | 1,039 (-10%) | 20mo | $85,000 | $82 | 38 |
| 2821 Round Rd | 0.63mi | 2/2.5 | 1,324 (+15%) | 24mo | $175,000 | $132 | 22 |
Match score weights: distance 35% · size 25% · config 20% · recency 20%. Top-matched comps best support the ARV.
Projected returns pro-forma
-3.0% appreciation · 4.08% rent growth · sell at horizon
- IRR
- -4.5%
- Equity multiple
- 0.83×
- Total profit
- $-8,140
- Equity at exit
- $25,348
- IRR
- 6.3%
- Equity multiple
- 1.49×
- Total profit
- $23,291
- Equity at exit
- $14,698
Cash invested: $47,600 (down + closing). Projections, not guarantees.
Landlord ↔ Tenant lean methodology
- Overall (CITY)
- 12 Strongly Tenant-Friendly
- State Maryland
- 27 Tenant-Leaning · D+14
- County
- — inherits STATE
- City Baltimore
- 12 Strongly Tenant-Friendly · D+58
ZIP-level market 21225
- Home prices YoY
- -31.9%
- Rents YoY
- 4.1%
- Active inventory
- 165
- Price-to-rent
- 8.3×
Monthly cashflow live
- Estimated rent
- $1,716 high interval (Pro) →
- Mortgage (P&I)
- −$891
- Tax from tax record
- −$118 /mo · $1,412/yr
- Insurance
- −$71
- HOA
- −$0
- Vacancy / Maint / Mgmt
- −$360
- Net cashflow
- $276
Break-even live
UW: 25.0% down · 7.5% · 30yr · 1.5% tax · 5.0% vac · 8.0% maint · 8.0% mgmt
Financing live
Cash to close
- Down payment
- $42,500
- Closing costs
- $5,100
- Reserves months
- —
- Total cash needed
- —
Loan-product check · same deal, 3 products live
Conventional
25% down · 7.5% · 30yr
- Down + closing
- —
- Monthly P&I
- —
- Monthly cashflow
- —
- DSCR
- —
- Eligible?
- —
Personal DTI + credit; lowest rate.
DSCR
20% down · 8.5% · 30yr
- Down + closing
- —
- Monthly P&I
- —
- Monthly cashflow
- —
- DSCR
- —
- Eligible?
- —
No personal income docs; deal must DSCR.
Hard money
10% down · 12.0% · 12mo
- Down + closing
- —
- Monthly P&I
- —
- Monthly cashflow
- —
- DSCR
- —
- Eligible?
- —
Short-term bridge; refi at stabilization.
Rent comps 40 comps
| Address | Beds | Baths | Sqft | Rent | $/sqft | DOM | Units | Dist |
|---|---|---|---|---|---|---|---|---|
| 130 Reedbird Ave Brooklyn, MD | 2.0 | 1.0 | 1152 | $1,700 | $1.48 | 24d | 1 | 0.03mi |
| 511 Seagull Ave Brooklyn, MD | 2.0 | 1.0 | 756 | $1,550 | $2.05 | 24d | 1 | 0.11mi |
| 2868 Potee St Baltimore, MD | 1.0–3.0 | 1.0 | 720 | $1,392 | $1.93 | 2d | 22 | 0.29mi |
| 607 Cheraton Rd Brooklyn, MD | 3.0 | 3.0 | 1200 | $1,750 | $1.46 | 15d | 1 | 0.43mi |
| 2454 Terra Firma Rd Brooklyn, MD | 3.0 | 1.0 | 1024 | $1,650 | $1.61 | 15d | 1 | 0.52mi |
| 2745 Round Rd Brooklyn, MD | 2.0 | 2.0 | 756 | $1,800 | $2.38 | 44d | 1 | 0.65mi |
| 49 Talbott St Brooklyn, MD | 2.0 | 1.0 | 1300 | $1,300 | $1.00 | 24d | 1 | 0.87mi |
| 3513 Horton Ave Brooklyn, MD | 3.0 | 1.0 | 1020 | $1,600 | $1.57 | 18d | 1 | 0.89mi |
| 2500 Insulator Dr Baltimore, MD | 3.0 | 1.0–2.0 | 988 | $3,816 | $3.86 | 2d | 152 | 0.91mi |
| 217 W Edgevale Rd Brooklyn, MD | 3.0 | 1.5 | 992 | $1,800 | $1.81 | 24d | 1 | 0.96mi |
| 3569 4th St Brooklyn, MD | 2.0 | 1.5 | 1256 | $1,200 | $0.96 | 18d | 1 | 0.98mi |
| 520 Baltic Ave Unit B Baltimore, MD | 1.0 | 1.0 | 800 | $1,050 | $1.31 | 44d | 1 | 1.00mi |
| 3528 6th St Brooklyn, MD | 2.0 | 2.5 | 1060 | $1,500 | $1.42 | 18d | 1 | 1.09mi |
| 603 Maude Ave Unit A Baltimore, MD | 1.0 | 1.0 | 1294 | $950 | $0.73 | 4d | 1 | 1.11mi |
| 303 Arden Rd W Brooklyn, MD | 3.0 | 2.0 | 1388 | $2,500 | $1.80 | 18d | 1 | 1.12mi |
| 2450 Rye St Baltimore, MD | 2.0 | 1.0–2.0 | 926 | $3,789 | $4.09 | 2d | 31 | 1.13mi |
| 3428 7th St Unit B Baltimore, MD | 1.0 | 1.0 | 1294 | $1,150 | $0.89 | 44d | 1 | 1.13mi |
| 250 Mission Blvd Baltimore, MD | 2.0 | 1.0–2.0 | 790 | $3,406 | $4.31 | 2d | 21 | 1.15mi |
| 3010 Alabama Ave Halethorpe, MD | 2.0 | 1.0 | 900 | $2,200 | $2.44 | 18d | 1 | 1.17mi |
| 507 Washburn Ave Brooklyn, MD | 3.0 | 1.5 | 1024 | $2,500 | $2.44 | 24d | 1 | 1.20mi |
| 507 Washburn Ave Brooklyn, MD | 3.0 | 1.5 | 1024 | $2,500 | $2.44 | 20d | 1 | 1.20mi |
| 507 Washburn Ave Brooklyn, MD | 3.0 | 1.5 | 1024 | $2,500 | $2.44 | 4d | 1 | 1.20mi |
| 4207 3rd St Unit 3 Brooklyn, MD | 2.0 | 1.0 | 850 | $1,595 | $1.88 | 5d | 1 | 1.28mi |
| 1942 Light St Baltimore, MD | 2.0 | 2.5 | 1150 | $2,200 | $1.91 | 22d | 1 | 1.30mi |
| 1900 S Hanover St Baltimore, MD | 3.0 | 1.0–2.0 | 875 | $3,119 | $3.56 | 2d | 66 | 1.33mi |
| 103 E Wells St Baltimore, MD | 1.0–2.0 | 1.0 | 1008 | $2,415 | $2.39 | 2d | 11 | 1.35mi |
| 1839 S Charles St Baltimore, MD | 3.0 | 2.5 | 1238 | $2,600 | $2.10 | 44d | 1 | 1.37mi |
| 3840 8th St Brooklyn, MD | 3.0 | 1.5 | 1088 | $1,606 | $1.48 | 4d | 1 | 1.37mi |
| 4400 4th St Unit BASEMENT Baltimore, MD | 2.0 | 1.0 | 925 | $1,350 | $1.46 | 44d | 1 | 1.38mi |
| 1815 S Charles St Baltimore, MD | 2.0 | 2.0 | 1208 | $2,100 | $1.74 | 44d | 1 | 1.40mi |
| 1807 Westphal Pl Baltimore, MD | 2.0 | 2.5 | 1378 | $2,500 | $1.81 | 4d | 1 | 1.41mi |
| 1746 S Hanover St Baltimore, MD | 3.0 | 2.0 | 1490 | $2,700 | $1.81 | 11d | 1 | 1.42mi |
| 4206 Audrey Ave Brooklyn, MD | 2.0 | 2.0 | 1104 | $1,275 | $1.15 | 44d | 1 | 1.45mi |
| 4206 Audrey Ave Brooklyn, MD | 3.0 | 3.0 | 1104 | $1,950 | $1.77 | 24d | 1 | 1.45mi |
| 1718 S Hanover St Baltimore, MD | 2.0 | 2.5 | 1296 | $2,700 | $2.08 | 24d | 1 | 1.45mi |
| 111 W Heath St Baltimore, MD | 2.0 | 1.0–2.5 | 1263 | $2,850 | $2.26 | 3d | 7 | 1.46mi |
| 837 E Jeffrey St Unit 2 Baltimore, MD | 1.0 | 1.0 | 1116 | $900 | $0.81 | 44d | 1 | 1.47mi |
| 837 E Jeffrey St Apt 1 Baltimore, MD | 1.0 | 1.0 | 1116 | $900 | $0.81 | 18d | 1 | 1.47mi |
| 1710 Marshall St Baltimore, MD | 2.0 | 1.0 | 1110 | $2,500 | $2.25 | 44d | 1 | 1.47mi |
| 4201 Audrey Ave Unit 1 Brooklyn, MD | 2.0 | 1.0 | 1400 | $1,350 | $0.96 | 24d | 1 | 1.47mi |
Listing history 4 events
-
2026-06-18days on market $170,000 Active 3 DOM
-
2026-06-17days on market $170,000 Active 2 DOM
-
2026-06-15remarks 685-char remark
-
2026-06-15$170,000 Active 1 DOM
ⓘ Source: listings_history table (triggers on properties + properties_extension) + one-shot
backfill from property_details.listing_events for pre-trigger history.
Tax reassessment forecast MD · Partial reset (capped growth)
- Current annual tax
- $1,412 · $118/mo
- Projected year-2 tax
- $1,632 · $136/mo
- Expected delta
- +$221/yr (+$18/mo · 15.6%)
ⓘ Screening estimate from a state-policy table — verify with the county assessor before closing.
Climate risk First Street
- Flood 1/10 Low FEMA zone X (unshaded) · 0% chance over 30 yrs
- Wildfire 1/10 Low
- Heat 8/10 Severe 7 d/yr ≥102°F today · 15 d/yr by 30 yrs out
- Wind 6/10 Major 27% chance of damaging wind over 30 yrs
- Air quality 4/10 Moderate 5 unhealthy d/yr today · 7 by 30 yrs out
Nearby sold comps map
Loading sold comps map…
Walkable amenities ~0.75 mi
Loading nearby amenities…
Taxation est. · year 1
- Rental income
- $20,591
- − Mortgage interest
- −$9,523
- − Property taxes
- −$1,412
- − Insurance
- −$850
- − Repairs & maintenance
- −$1,647
- − Management
- −$1,647
- − Depreciation
- −$4,945
- Taxable income
- $567
- Est. tax owed @ 24.0%
- −$136
- After-tax cash flow
- $3,172/yr
For passive investors: Depreciation is non-cash, so a rental often shows a tax loss while cash-flowing — sheltering income. Rental losses are passive: they offset passive income freely, and up to $25,000/yr can offset ordinary (W-2) income if you actively participate and your MAGI is under $100k (phasing out to $0 by $150k); unused losses carry forward. On sale, claimed depreciation is recaptured at up to 25%, and gains may owe capital-gains tax (a 1031 exchange can defer both). Figures are a year-1 estimate at your 24.0% rate — not tax advice; consult a CPA.
Schools (NCES district)
- District
- Baltimore City Public Schools
- NCES district ID
- 2400090
- Math proficiency
- 7% ▼ -9.00%
- Reading proficiency
- 16% ▼ -5.00%
- Median HH income
- $42,108
- Composite
- 10.08/100
- National rank
- #9805
- State rank
- #24 of 24 in MD
Livability — Baltimore
- Score
- 76/100
- State rank
- #90
- US rank
- #3396
Category grades
Schools grade is shown separately in the Schools card above.
Census & demographics
- Census place
- Baltimore, MD
- County
- Anne Arundel County · 535,653 people
- City population
- 588,727
- Metro
- Baltimore-Columbia-Towson, MD
- Population (ZIP)
- 34,062
- Household income
- $54,020
- Rent vs Own
- Severe rent burden
- 1440.0
Population outlook (Baltimore County) Hauer SSP2
- Today (2025)
- 624,249 people
- By 2030
- 621,541 · -0.4%
- By 2040
- 609,756 · -2.3%
- By 2050
- 597,249 · -4.3%
- By 2075
- 552,236 · -11.5%
- By 2100
- 513,934 · -17.7%
Race, ethnicity, and origin ACS 2023
- Neighborhood character
- Diverse neighborhood (Simpson 0.68)
- Race & ethnicity
- Black 42% White 32% Hispanic / Latino 20% Two or more races 8% Native American 3% Asian 2%
- Hispanic origin (detail)
- Mexican 5% Puerto Rican 1%
- Common ancestry
- Romanian 2% Lithuanian 1% Iranian 1%
- Foreign-born
- 12% · Canada, China
- Languages at home
- 81% English-only · Spanish 16% Other Indo-European 1% French/Haitian/Cajun 1%
Political lean MEDSL · Baltimore
- 2024 margin
- Solid D (+73.0) · D 85.2% · R 12.2% · Other 2.6%
- 2008→2024 swing
- -2.5pp toward R · 2008: 75.5pp · 2024: 73.0pp
- All cycles
- 2024: D+73.0 2020: D+76.6 2016: D+74.6 2012: D+76.4 2008: D+75.5
Not yet ingested
- Civics
- —
Market trends
- HPI YoY
- ▼ -119.44%
- Current HPI
- 254.5089
- Rent YoY
- ▲ 4.08%
- Metro
- Baltimore-Columbia-Towson, MD
- State GDP YoY
- ▲ 2.97%
- F500 in state
- 12
Industry mix (Fortune 500 HQ in MD)
| Industry | F500 HQs | Revenue |
|---|---|---|
| Aerospace / Defense | 1 | $71B |
|
||
| Utilities | 1 | $25B |
|
||
| Hotels | 1 | $24B |
|
||
| Consumer Goods | 1 | $7B |
|
||
| Real Estate | 1 | $6B |
|
||
| Chemicals | 1 | $2B |
|
||
Price history
+195.7% since first listed21 events — show timeline
- 2026-06-15 Listed $170,000 BRIGHT MLS
- 2014-11-20 Delisted — MRIS
- 2014-11-20 Listing Removed — BRIGHT MLS
- 2014-09-30 Listed — MRIS
- 2014-09-29 Listed $85,000 BRIGHT MLS
- 2013-10-22 Delisted — MRIS
- 2013-10-21 Listing Removed — BRIGHT MLS
- 2013-08-27 Price Changed — MRIS
- 2013-06-29 Listed — MRIS
- 2013-06-29 Listed $80,000 BRIGHT MLS
- 2010-08-11 Sold (Public Records) $70,000 Public Records
- 2009-09-29 Delisted — MRIS
- 2009-09-29 Listing Removed — BRIGHT MLS
- 2009-05-19 Price Changed — MRIS
- 2009-04-24 Price Changed — MRIS
- 2008-10-02 Listed — MRIS
- 2008-10-02 Listed $99,000 BRIGHT MLS
- 2000-09-11 Sold (Public Records) $53,000 Public Records
- 2000-08-30 Sold (MLS) $53,000 MRIS
- 2000-08-07 Delisted — MRIS
- 2000-07-03 Listed $57,500 MRIS
Property tax history
-3.1%/yrLatest (2025): $1,412 · +9.1% YoY. Source: county tax records.
Cash-flow waterfall
monthlySold comps — $/sqft
last 12 mo · ≤1 miLoading sold comps…