 Multi-family
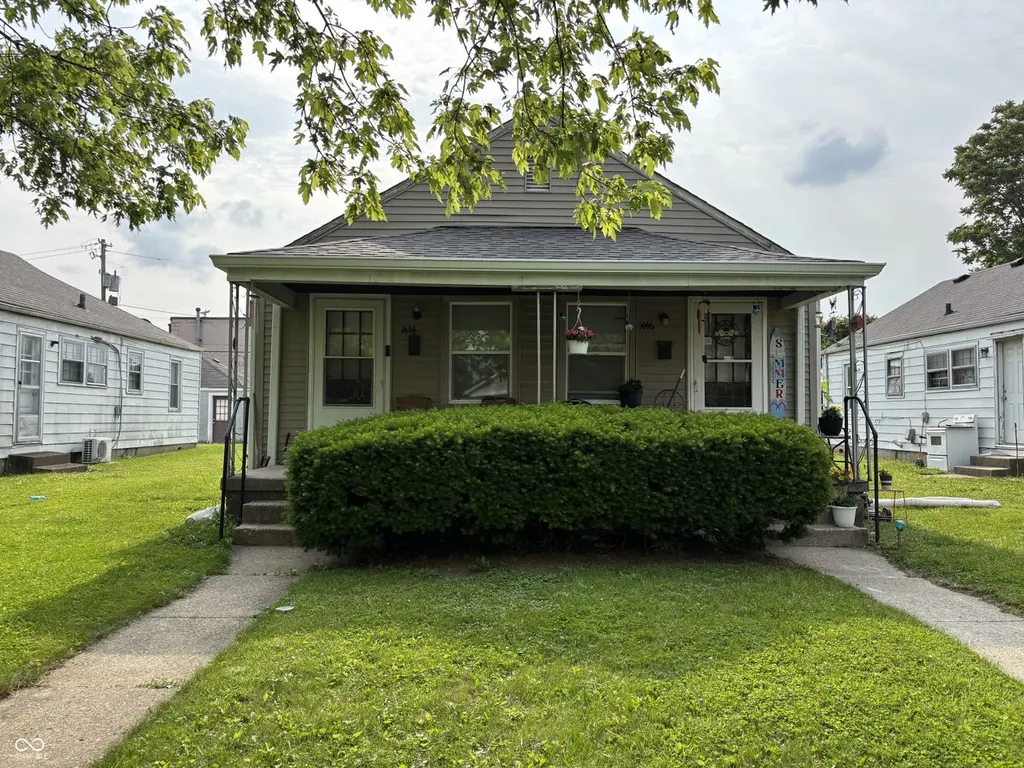
1444 N Denny St · Indianapolis city (balance), IN
Flood risk 1/10 · Minimal
- FEMA flood zone
- X (unshaded)
- Chance of flooding over 30 yrs
- 0.0%
- Est. flood insurance / yr
- $473 – $860
Fire risk 1/10 · Minimal
- Est. fire insurance / yr
- $717 – $1,331
Heat risk 4/10 · Minor
- Hot days now (above 102°F)
- 7 days/yr
- Hot days in 30 yrs
- 18 days/yr
Wind risk 2/10 · Minimal
- Chance of severe wind over 30 yrs
- 0.0%
Air-quality risk 4/10 · Minor
- Unhealthy air days now
- 5 days/yr
- Unhealthy air days in 30 yrs
- 7 days/yr
Risk factors via First Street. Map © Google.
Why this score? — see what drove the D grade
The composite is a weighted blend of 9 inputs, each scored 0–100. Each bar is that input's sub-score; the figure is the points it added to the 100-point composite (weight × sub-score).
- Cash flow +15.9/30.0
- ARV discount +7.9/15.0
- 1% rule +5.0/10.0
- DSCR +4.9/10.0
- Rent growth +4.3/5.0
- Livability +2.5/5.0
- Condition / age +2.5/5.0
- Schools +1.4/10.0
- Appreciation +0.0/10.0
$165,000
🖨 Deal sheet (PDF) 📄 Offer letter ✓ Due diligence
Multi-family units
County records classify this as Multi-Family (2-4 Unit). Listing-text estimate: 1 unit. estimate disagrees with records
Listing remarks MLS
Several updates just completed! Hardwoods throughout just totally refinished and look beautiful! Turnkey 1 bed 1 bath per side duplex with tons of updates. Property was updated in 2015 with new kitchens, bathrooms, tile floors, new furnaces, new water heaters, new appliances including washer and dryer in each unit. 2016 new vinyl siding and roof, 2022 new windows and gutters, 2023 new paint, refinished hardwood floors, new downspout extensions and several more updates!
Key facts
- Easy access
- Updated
- Laundry area
Tags
Property features AI
Finance
- Other: Property type: Residential income (duplex)
- Financial info: Two-unit property; Owner pays insurance and taxes; Gross income reported as $800; Expenses reported as $0; Unit 1 rent: $850 per month; Unit 2 rent: $800 per month
Exterior
- Parking: On-street parking
- Utilities: Private sewer; Solid waste: no
- Home design: Duplex (residential income); One story
- Construction: Aluminum siding
- Exterior features: Sidewalks; Street cuts for road access
Interior
- Kitchen: Kitchen (10 x 11) in Unit 1; Kitchen (10 x 11) in Unit 2
- Bedrooms: Unit 2 is a 1-bedroom unit
- Heating & cooling: Central air; Forced heat (gas)
- Interior features: Central air; Basement
- Laundry & utility: Laundry connections in each unit; Hot water: gas; Heat: forced air (gas); Fuel: gas
Neighborhood map
What this means for you Summary
Snapshot
- This is a 1-bed/4.0-bath multifamily listed at $165k.
Deal economics
- At list price, monthly cash flow is $80 ($959/yr) — positive.
- The deal already cash-flows at list — no discount required.
- To meet the 1% rule (rent ≥ 1% of price), the offer needs to be $165k (0.2% below list).
- Recommended offer: $160k (3.0% below list) — sets the bar for market timing.
- Cap rate 6.9% vs local median 4.4% in Indianapolis city (balance) — top-decile yield for the area; either an underpriced asset or a hidden risk that comps aren't pricing in. Stress-test before assuming the spread holds.
Location & tenants
- Location reads: area grade D — affects rentability + tenant quality, not the cash-flow math above.
- Indianapolis Public Schools (urban): math 14% / reading 20% proficiency, ranked #286 of 301 in IN (top 95%) — low school quality limits family demand, transient renter base, plan for 1-2y turnover; 77% free/reduced lunch — lower-income household profile, screen leases tightly.
- Market conditions: Rents rising fast (+7.3%/yr); 480 active listings in the ZIP; 40 comparable units currently listed for rent nearby; rentals at typical pace (median 24d on market — plan ~3-4 weeks tenant-placement turnaround); 1,906 units permitted in Marion County in 2024 (621 in 5+ unit buildings).
- This rent runs 40% of the median local income ($49k/yr) — at the standard rent-burdened threshold; future hikes will face affordability resistance.
Forward outlook
- Local home prices are declining (-3.0%/yr); year-one equity from $1k of loan paydown is wiped out by about $5k of value loss. Plan a longer hold.
- Marion County population projected at +18% by 2050 — long-run rental-demand tailwind backs the buy-and-hold thesis.
Negotiation context
- It's been on market 37 days — a 3% lower offer ($160k) is reasonable based on typical stale-listing flexibility.
- 9 sale attempts since 25y ago with the ask held roughly flat each time — persistent listings suggest the price (not the market) is what's stuck; bring a comps-based counter.
Risks & watch-outs
- Watch-outs: built in 1945 — expect roof / HVAC / electrical / plumbing capex.
Questions for the listing agent
- It's been on market 37 days. Have you received any prior offers? Is the seller open to a 3% concession, seller financing, or rate buy-down credit?
- Built in 1945 — when were the roof, HVAC, electrical panel, plumbing, and water heater last replaced?
- Is there a deadline driving the sale (1031 exchange, divorce, estate, relocation)? That informs how much negotiation room exists.
- The area grade is low — what's the realistic commute time and amenity access for the typical tenant pool here? Any planned neighborhood developments (good or bad) we should know about?
- What's the average days-on-market for RENTAL listings here right now (not sales)? A rising rental-DOM trend means longer vacancies and softer asking-rent achievability than the comps imply.
- What's the recent tenant-quality profile in this submarket — average credit score on applications, eviction rate, late-payment / NSF rate, and stable-employment percentage? A property-management company in the area should have these aggregated.
- How much new apartment / multifamily construction is in the pipeline within 1–3 miles? Heavy new supply (>2% of stock underway) typically softens rents 12–24 months out; light construction supports rent growth.
Investment metrics
- 1% rule
- 1.00% ✗
- Cap rate
- 6.87%
- Cash-on-cash
- 2.08%
- DSCR
- 1.09
- GRM
- 8.4
CMA / ARV
- ARV (median comp)
- $166,656
- List price
- $165,000
- Delta
- -0.99%
- Verdict
- FAIR
- Comps
- 20 within 1.0 mi
Projected returns pro-forma
-3.0% appreciation · 7.31% rent growth · sell at horizon
- IRR
- -7.9%
- Equity multiple
- 0.69×
- Total profit
- $-14,126
- Equity at exit
- $24,602
- IRR
- 6.7%
- Equity multiple
- 1.61×
- Total profit
- $27,962
- Equity at exit
- $14,266
Cash invested: $46,200 (down + closing). Projections, not guarantees.
Landlord ↔ Tenant lean methodology
- Overall (STATE)
- 90 Strongly Landlord-Friendly
- State Indiana
- 90 Strongly Landlord-Friendly · R+11
- County
- — inherits STATE
- City
- — inherits STATE
ZIP-level market 46201
- Home prices YoY
- -33.9%
- Rents YoY
- 7.3%
- Active inventory
- 480
- Price-to-rent
- 16.7×
Monthly cashflow live
- Estimated rent
- $1,646 medium interval (Pro) →
- Mortgage (P&I)
- −$865
- Tax from tax record
- −$286 /mo · $3,437/yr
- Insurance
- −$69
- HOA
- −$0
- Vacancy / Maint / Mgmt
- −$346
- Net cashflow
- $80
Break-even live
Sensitivity live
| Price | -10% $173 | -5% $127 | +0% $80 | +5% $33 | +10% $-13 |
|---|---|---|---|---|---|
| Rent | -10% $-50 | -5% $15 | +0% $80 | +5% $145 | +10% $210 |
| Rate | -1.0pp $163 | -0.5pp $122 | base $80 | +0.5pp $37 | +1.0pp $-6 |
2-unit breakdown (identical units grouped — click to expand)
| Units | Beds | Baths | Est. rent |
|---|---|---|---|
| 2× units | 1 | 1 | $1,646 |
| #1 | 1 | 1 | $823 |
| #2 | 1 | 1 | $823 |
| Total (2 units) | $1,646 | ||
UW: 25.0% down · 7.5% · 30yr · 1.5% tax · 5.0% vac · 8.0% maint · 8.0% mgmt
Financing live
Cash to close
- Down payment
- $41,250
- Closing costs
- $4,950
- Reserves months
- —
- Total cash needed
- —
Loan-product check · same deal, 3 products live
Conventional
25% down · 7.5% · 30yr
- Down + closing
- —
- Monthly P&I
- —
- Monthly cashflow
- —
- DSCR
- —
- Eligible?
- —
Personal DTI + credit; lowest rate.
DSCR
20% down · 8.5% · 30yr
- Down + closing
- —
- Monthly P&I
- —
- Monthly cashflow
- —
- DSCR
- —
- Eligible?
- —
No personal income docs; deal must DSCR.
Hard money
10% down · 12.0% · 12mo
- Down + closing
- —
- Monthly P&I
- —
- Monthly cashflow
- —
- DSCR
- —
- Eligible?
- —
Short-term bridge; refi at stabilization.
Rent comps 40 comps
| Address | Beds | Baths | Sqft | Rent | $/sqft | DOM | Units | Dist |
|---|---|---|---|---|---|---|---|---|
| 1518 N Chester Ave Indianapolis, IN | 2.0 | 1.0 | 672 | $700 | $1.04 | 8d | 1 | 0.10mi |
| 1327 N Chester Ave Indianapolis, IN | 1.0 | 1.0 | 600 | $795 | $1.32 | 14d | 1 | 0.16mi |
| 1538 N Grant Ave Indianapolis, IN | 1.0 | 1.0 | 375 | $700 | $1.87 | 44d | 1 | 0.16mi |
| 3709 Brookside Parkway South Dr Indianapolis, IN | 1.0 | 1.0 | 742 | $825 | $1.11 | 24d | 1 | 0.17mi |
| 1306 N Chester Ave Indianapolis, IN | 1.0 | 1.0 | 600 | $800 | $1.33 | 21d | 1 | 0.18mi |
| 1531 N Grant Ave Indianapolis, IN | 1.0 | 1.0 | 611 | $875 | $1.43 | 24d | 1 | 0.18mi |
| 1450 N Gladstone Ave Indianapolis, IN | 1.0 | 1.0 | 588 | $799 | $1.36 | 44d | 1 | 0.20mi |
| 1510 N Gladstone Ave Indianapolis, IN | 1.0 | 1.0 | 570 | $765 | $1.34 | 44d | 1 | 0.21mi |
| 1512 N Gladstone Ave Unit 1510 1510 Indianapolis, IN | 1.0 | 1.0 | 570 | $830 | $1.46 | 15d | 1 | 0.21mi |
| 1432 N Colorado Ave Indianapolis, IN | 1.0 | 1.0 | 584 | $875 | $1.50 | 24d | 1 | 0.27mi |
| 1358 N Gale St Indianapolis, IN | 1.0 | 1.0 | 550 | $890 | $1.62 | 17d | 1 | 0.28mi |
| 1301 N Olney St Unit 1303 Indianapolis, IN | 2.0 | 1.0 | 750 | $1,100 | $1.47 | 44d | 1 | 0.35mi |
| 1106 N Gale St Unit 3 Indianapolis, IN | — | 1.0 | 400 | $650 | $1.62 | 5d | 1 | 0.40mi |
| 1106 N Gale St Unit 1 Indianapolis, IN | 2.0 | 1.0 | 750 | $895 | $1.19 | 44d | 1 | 0.40mi |
| 1028 N Olney St Unit 1030 Indianapolis, IN | 1.0 | 1.0 | 700 | $800 | $1.14 | 24d | 1 | 0.47mi |
| 927 N Chester Ave Indianapolis, IN | 1.0 | 1.0 | 596 | $750 | $1.26 | 44d | 1 | 0.50mi |
| 1036 N Tuxedo St Indianapolis, IN | 1.0 | 1.0 | 646 | $750 | $1.16 | 5d | 1 | 0.51mi |
| 896 N Gladstone Ave Indianapolis, IN | 1.0 | 1.0 | 580 | $775 | $1.34 | 44d | 1 | 0.54mi |
| 821 N Bradley Ave Indianapolis, IN | 1.0 | 1.0 | 663 | $850 | $1.28 | 5d | 1 | 0.60mi |
| 1114 N Dearborn St Indianapolis, IN | 1.0 | 1.0 | 646 | $795 | $1.23 | 45d | 1 | 0.62mi |
| 2030 N Colorado Ave Indianapolis, IN | 2.0 | 1.0 | 728 | $1,150 | $1.58 | 24d | 1 | 0.62mi |
| 833 N Gladstone Ave Indianapolis, IN | 1.0 | 1.0 | 687 | $825 | $1.20 | 24d | 1 | 0.64mi |
| 3058 Brookside Parkway North Dr Indianapolis, IN | 1.0 | 1.0 | 700 | $875 | $1.25 | 13d | 1 | 0.71mi |
| 1951 N Bosart Ave Indianapolis, IN | 2.0 | 1.0 | 728 | $1,000 | $1.37 | 4d | 1 | 0.75mi |
| 2827 E 18th St Indianapolis, IN | 2.0 | 1.0 | 726 | $1,300 | $1.79 | 24d | 1 | 0.81mi |
| 1315 N Rural St Indianapolis, IN | 1.0 | 1.0 | 700 | $1,000 | $1.43 | 5d | 1 | 0.82mi |
| 1931 N Oxford St Indianapolis, IN | 1.0 | 1.0 | 616 | $875 | $1.42 | 4d | 1 | 0.82mi |
| 1824 N Riley Ave Indianapolis, IN | 2.0 | 1.0 | 720 | $1,150 | $1.60 | 44d | 1 | 0.86mi |
| 412 N Bradley Ave Unit 3 Indianapolis, IN | 2.0 | 1.0 | 700 | $950 | $1.36 | 24d | 1 | 0.92mi |
| 320 N Sherman Dr Indianapolis, IN | — | 1.0 | 750 | $525 | $0.70 | 44d | 1 | 0.99mi |
| 320 N Sherman Dr Unit A Indianapolis, IN | — | 1.0 | 450 | $525 | $1.17 | 5d | 1 | 0.99mi |
| 628 N Oxford St Indianapolis, IN | 1.0 | 1.0 | 536 | $775 | $1.45 | 24d | 1 | 1.03mi |
| 830 N Emerson Ave Indianapolis, IN | 1.0 | 1.0 | 560 | $850 | $1.52 | 44d | 1 | 1.05mi |
| 831 N Emerson Ave Indianapolis, IN | 1.0 | 1.0 | 647 | $1,000 | $1.55 | 24d | 1 | 1.08mi |
| 2422 Adams St Unit 2 Indianapolis, IN | 1.0 | 1.0 | 700 | $850 | $1.21 | 44d | 1 | 1.18mi |
| 415 N Oxford St Indianapolis, IN | 1.0 | 1.0 | 580 | $650 | $1.12 | 24d | 1 | 1.18mi |
| 2449 Wheeler St Indianapolis, IN | 1.0 | 1.0 | 600 | $950 | $1.58 | 24d | 1 | 1.28mi |
| 5242 E 20th Pl Indianapolis, IN | 2.0 | 1.0 | 720 | $1,050 | $1.46 | 8d | 1 | 1.30mi |
| 37 S Sherman Dr Indianapolis, IN | 1.0 | 1.0 | 700 | $800 | $1.14 | 24d | 1 | 1.30mi |
| 5322 E 19th Pl Indianapolis, IN | 2.0 | 1.0 | 720 | $945 | $1.31 | 44d | 1 | 1.33mi |
Listing history 32 events
-
2026-06-18days on market $165,000 Active 37 DOM
-
2026-06-17days on market $165,000 Active 36 DOM
-
2026-06-16days on market $165,000 Active 35 DOM
-
2026-06-15days on market $165,000 Active 34 DOM
-
2026-06-13days on market $165,000 Active 32 DOM
-
2026-06-13days on market $165,000 Active 31 DOM
-
2026-06-09days on market $165,000 Active 28 DOM
-
2026-06-08days on market $165,000 Active 27 DOM
-
2026-06-07days on market $165,000 Active 26 DOM
-
2026-06-03days on market $165,000 Active 22 DOM
-
2026-06-02days on market $165,000 Active 21 DOM
-
2026-06-01days on market $165,000 Active 20 DOM
-
2026-05-31days on market $165,000 Active 19 DOM
-
2026-05-12$165,000 Active 241-char remark
-
2025-09-17status Pending
-
2025-09-17historical
-
2025-06-04$159,000 Active
-
2024-01-26historical $850
-
2023-12-23$850
-
2023-02-21soldstatus $145,000 Closed
Show marketing remark (473 chars)
Several updates just completed! Hardwoods throughout just totally refinished and look beautiful! Turnkey 1 bed 1 bath per side duplex with tons of updates. Property was updated in 2015 with new kitchens, bathrooms, tile floors, new furnaces, new water heaters, new appliances including washer and dryer in each unit. 2016 new vinyl siding and roof, 2022 new windows and gutters, 2023 new paint, refinished hardwood floors, new downspout extensions and several more updates!
-
2023-01-23status Pending
Show marketing remark (473 chars)
Several updates just completed! Hardwoods throughout just totally refinished and look beautiful! Turnkey 1 bed 1 bath per side duplex with tons of updates. Property was updated in 2015 with new kitchens, bathrooms, tile floors, new furnaces, new water heaters, new appliances including washer and dryer in each unit. 2016 new vinyl siding and roof, 2022 new windows and gutters, 2023 new paint, refinished hardwood floors, new downspout extensions and several more updates!
-
2023-01-20status Active
Show marketing remark (473 chars)
Several updates just completed! Hardwoods throughout just totally refinished and look beautiful! Turnkey 1 bed 1 bath per side duplex with tons of updates. Property was updated in 2015 with new kitchens, bathrooms, tile floors, new furnaces, new water heaters, new appliances including washer and dryer in each unit. 2016 new vinyl siding and roof, 2022 new windows and gutters, 2023 new paint, refinished hardwood floors, new downspout extensions and several more updates!
-
2023-01-06status Active
Show marketing remark (473 chars)
Several updates just completed! Hardwoods throughout just totally refinished and look beautiful! Turnkey 1 bed 1 bath per side duplex with tons of updates. Property was updated in 2015 with new kitchens, bathrooms, tile floors, new furnaces, new water heaters, new appliances including washer and dryer in each unit. 2016 new vinyl siding and roof, 2022 new windows and gutters, 2023 new paint, refinished hardwood floors, new downspout extensions and several more updates!
-
2022-11-12status Active
Show marketing remark (473 chars)
Several updates just completed! Hardwoods throughout just totally refinished and look beautiful! Turnkey 1 bed 1 bath per side duplex with tons of updates. Property was updated in 2015 with new kitchens, bathrooms, tile floors, new furnaces, new water heaters, new appliances including washer and dryer in each unit. 2016 new vinyl siding and roof, 2022 new windows and gutters, 2023 new paint, refinished hardwood floors, new downspout extensions and several more updates!
-
2022-10-12status Pending
Show marketing remark (473 chars)
Several updates just completed! Hardwoods throughout just totally refinished and look beautiful! Turnkey 1 bed 1 bath per side duplex with tons of updates. Property was updated in 2015 with new kitchens, bathrooms, tile floors, new furnaces, new water heaters, new appliances including washer and dryer in each unit. 2016 new vinyl siding and roof, 2022 new windows and gutters, 2023 new paint, refinished hardwood floors, new downspout extensions and several more updates!
-
2022-10-10$145,000 Active
Show marketing remark (473 chars)
Several updates just completed! Hardwoods throughout just totally refinished and look beautiful! Turnkey 1 bed 1 bath per side duplex with tons of updates. Property was updated in 2015 with new kitchens, bathrooms, tile floors, new furnaces, new water heaters, new appliances including washer and dryer in each unit. 2016 new vinyl siding and roof, 2022 new windows and gutters, 2023 new paint, refinished hardwood floors, new downspout extensions and several more updates!
-
2015-10-14soldstatus $22,000 Sold
-
2015-10-06status Pending
-
2015-09-15historical Active with Contingency
-
2015-08-25$19,500 Active
-
2002-04-18historical
-
2001-08-10$46,500
ⓘ Source: listings_history table (triggers on properties + properties_extension) + one-shot
backfill from property_details.listing_events for pre-trigger history.
Tax reassessment forecast IN · Partial reset (capped growth)
- Current annual tax
- $3,437 · $286/mo
- Projected year-2 tax
- $3,437 · $286/mo
- Expected delta
- $0/yr ($0/mo · -0.0%)
ⓘ Screening estimate from a state-policy table — verify with the county assessor before closing.
Climate risk First Street
- Flood 1/10 Low FEMA zone X (unshaded) · 0% chance over 30 yrs
- Wildfire 1/10 Low
- Heat 4/10 Moderate 7 d/yr ≥102°F today · 18 d/yr by 30 yrs out
- Wind 2/10 Low 0% chance of damaging wind over 30 yrs
- Air quality 4/10 Moderate 5 unhealthy d/yr today · 7 by 30 yrs out
Nearby sold comps map
Loading sold comps map…
Walkable amenities ~0.75 mi
Loading nearby amenities…
Taxation est. · year 1
- Rental income
- $19,752
- − Mortgage interest
- −$9,243
- − Property taxes
- −$3,437
- − Insurance
- −$825
- − Repairs & maintenance
- −$1,580
- − Management
- −$1,580
- − Depreciation
- −$4,800
- Taxable loss
- −$1,713
- Est. tax savings @ 24.0%
- +$411
- After-tax cash flow
- $1,370/yr
For passive investors: Depreciation is non-cash, so a rental often shows a tax loss while cash-flowing — sheltering income. Rental losses are passive: they offset passive income freely, and up to $25,000/yr can offset ordinary (W-2) income if you actively participate and your MAGI is under $100k (phasing out to $0 by $150k); unused losses carry forward. On sale, claimed depreciation is recaptured at up to 25%, and gains may owe capital-gains tax (a 1031 exchange can defer both). Figures are a year-1 estimate at your 24.0% rate — not tax advice; consult a CPA.
Schools (NCES district)
- District
- Indianapolis Public Schools
- NCES district ID
- 1804770
- Math proficiency
- 14% ▼ -7.00%
- Reading proficiency
- 20% ▼ -3.00%
- Median HH income
- $32,034
- Composite
- 13.69/100
- National rank
- #9499
- State rank
- #286 of 301 in IN
Livability — Indianapolis city (balance)
No livability data for this city. (Only ~50 U.S. cities are tracked.)
Census & demographics
- Census place
- Indianapolis city (balance), IN
- County
- Marion County · 998,460 people
- City population
- 881,119
- Metro
- Indianapolis-Carmel-Anderson, IN
- Population (ZIP)
- 30,335
- Household income
- $49,195
- Rent vs Own
- Severe rent burden
- 1906.0
Population outlook (Marion County) Hauer SSP2
- Today (2025)
- 1,025,572 people
- By 2030
- 1,065,727 · +3.9%
- By 2040
- 1,141,577 · +11.3%
- By 2050
- 1,208,920 · +17.9%
- By 2075
- 1,367,288 · +33.3%
- By 2100
- 1,438,201 · +40.2%
Race, ethnicity, and origin ACS 2023
- Neighborhood character
- Diverse neighborhood (Simpson 0.63)
- Race & ethnicity
- White 53% Hispanic / Latino 23% Black 18% Two or more races 9%
- Hispanic origin (detail)
- Mexican 14% Puerto Rican 2%
- Common ancestry
- Slovak 2% Lithuanian 2% Italian 1%
- Foreign-born
- 9% · Canada
- Languages at home
- 81% English-only · Spanish 17%
Political lean MEDSL · Marion
- 2024 margin
- Strong D (+27.7) · D 63.0% · R 35.3% · Other 1.7%
- 2008→2024 swing
- -0.7pp no change · 2008: 28.4pp · 2024: 27.7pp
- All cycles
- 2024: D+27.7 2020: D+29.1 2016: D+22.8 2012: D+22.2 2008: D+28.4
Not yet ingested
- Civics
- —
Market trends
- HPI YoY
- ▼ -192.51%
- Current HPI
- 375.0969
- Rent YoY
- ▲ 7.31%
- Metro
- Indianapolis-Carmel-Anderson, IN
- State GDP YoY
- ▲ 2.90%
- F500 in state
- 18
Industry mix (Fortune 500 HQ in IN)
| Industry | F500 HQs | Revenue |
|---|---|---|
| Industrial Machinery | 2 | $37B |
|
||
| Healthcare | 1 | $177B |
|
||
| Pharmaceuticals | 1 | $45B |
|
||
| Metals / Steel | 1 | $18B |
|
||
| Agriculture | 1 | $17B |
|
||
| Packaging | 1 | $12B |
|
||
Price history
+254.8% since first listed19 events — show timeline
- 2026-05-12 Listed $165,000 MIBOR as Distributed by MLS Grid
- 2025-09-17 Pending — MIBOR as Distributed by MLS Grid
- 2025-09-17 Listing Removed — MIBOR as Distributed by MLS Grid
- 2025-06-04 Listed $159,000 MIBOR as Distributed by MLS Grid
- 2024-01-26 Rental Removed $850 MIBOR
- 2023-12-23 Listed for Rent $850 MIBOR
- 2023-02-21 Sold (MLS) $145,000 MIBOR as Distributed by MLS Grid
- 2023-01-23 Pending — MIBOR as Distributed by MLS Grid
- 2023-01-20 Relisted — MIBOR as Distributed by MLS Grid
- 2023-01-06 Relisted — MIBOR as Distributed by MLS Grid
- 2022-11-12 Relisted — MIBOR as Distributed by MLS Grid
- 2022-10-12 Pending — MIBOR as Distributed by MLS Grid
- 2022-10-10 Listed $145,000 MIBOR as Distributed by MLS Grid
- 2015-10-14 Sold (MLS) $22,000 MIBOR as Distributed by MLS Grid
- 2015-10-06 Pending — MIBOR as Distributed by MLS Grid
- 2015-09-15 Contingent — MIBOR as Distributed by MLS Grid
- 2015-08-25 Listed $19,500 MIBOR as Distributed by MLS Grid
- 2002-04-18 Listing Removed — MIBOR as Distributed by MLS Grid
- 2001-08-10 Listed $46,500 MIBOR as Distributed by MLS Grid
Property tax history
+13.5%/yrLatest (2025): $3,437 · -0.6% YoY. Source: county tax records.
Cash-flow waterfall
monthlySold comps — $/sqft
last 12 mo · ≤1 miLoading sold comps…