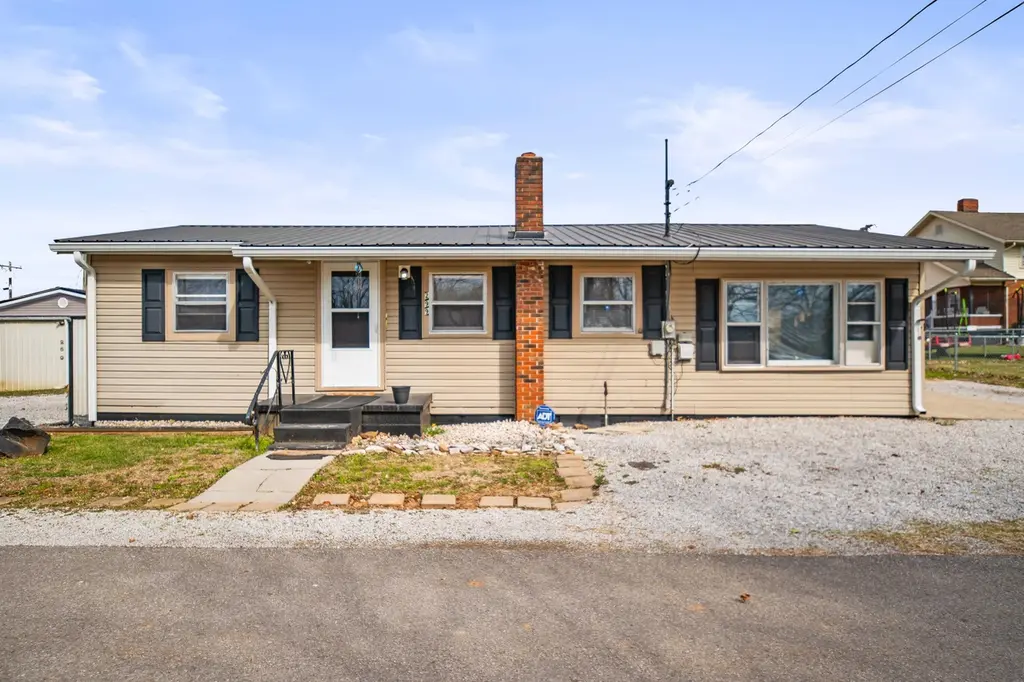
299 Tate Dr · Monticello, KY
Flood risk 1/10 · Minimal
- FEMA flood zone
- X (unshaded)
- Chance of flooding over 30 yrs
- 0.0%
- Est. flood insurance / yr
- $507 – $1,088
Fire risk 5/10 · Moderate
- Est. fire insurance / yr
- $839 – $1,559
Heat risk 5/10 · Moderate
- Hot days now (above 101°F)
- 7 days/yr
- Hot days in 30 yrs
- 21 days/yr
Wind risk 3/10 · Minor
- Chance of severe wind over 30 yrs
- 6.0%
Air-quality risk 1/10 · Minimal
- Unhealthy air days now
- 0 days/yr
- Unhealthy air days in 30 yrs
- 0 days/yr
Risk factors via First Street. Map © Google.
Why this score? — see what drove the D grade
The composite is a weighted blend of 9 inputs, each scored 0–100. Each bar is that input's sub-score; the figure is the points it added to the 100-point composite (weight × sub-score).
- ARV discount +15.0/15.0
- Cash flow +11.2/30.0
- 1% rule +3.3/10.0
- DSCR +3.3/10.0
- Livability +3.2/5.0
- Condition / age +2.8/5.0
- Rent growth +2.5/5.0
- Schools +2.1/10.0
- Appreciation +0.0/10.0
$115,000
🖨 Deal sheet (PDF) 📄 Offer letter ✓ Due diligence
Listing remarks
First time homebuyer, investment or downsizing opportunity in Monticello! This 3 bedroom, 1 bath home, in the city, offers convenient location to town and Highway 90. This property has potential. Inside, you'll find a functional layout with comfortable living spaces and natural light throughout the home. A highlight for this home is the large primary bedroom space. Step outside to enjoy the fenced backyard featuring chain link fencing, perfect for pets, children, or simply enjoying a outdoor setting. The property also offers ample driveway parking with plenty of space for multiple vehicles, guests, or recreational equipment. Conveniently located close to local shopping, dining, schools, and
Key facts
- Nice yard space
- Fenced backyard
- 4,791 sq ft lot
Tags
Property features AI
Finance
- Other: Parcel number 65A-01-013.00
Exterior
- Parking: Driveway
- Utilities: Public sewer; Electricity connected; Water connected; Cable available; Phone available
- Home design: Single-family residence; Rural subdivision
- Construction: Vinyl siding; Block/other foundation; Metal roof; Built area approximately 1,032
- Exterior features: Chain link fencing; Public water
Interior
- Kitchen: Refrigerator; Oven
- Bedrooms: Total rooms: 6
- Flooring: Laminate flooring
- Bathrooms: 1 full bathroom
- Heating & cooling: Propane heating; Electric cooling; Window unit(s)
- Interior features: Refrigerator; Oven
- Laundry & utility: Washer hookup on main level; Electric dryer hookup
Neighborhood map
What this means for you Summary
Snapshot
- This is a 3-bed/1.0-bath single-family listed at $115k. Condition is rated average.
Deal economics
- At list price, monthly cash flow is $-44 ($-531/yr) — negative.
- To cash-flow at today's rent, offer at most $109k (5.6% below list).
- To meet the 1% rule (rent ≥ 1% of price), the offer needs to be $95k (17.4% below list).
- Recommended offer: $95k (17.4% below list) — sets the bar for 1% rule.
- Cap rate 5.8% vs local median 3.6% in Monticello — top-decile yield for the area; either an underpriced asset or a hidden risk that comps aren't pricing in. Stress-test before assuming the spread holds.
Location & tenants
- Location reads 65/100 on livability (#265 in KY) — a middle-class / working-renter tenant base. Strengths: crime A+, cost of living A+, housing A+; Watch: amenities F, commute F, employment F.
- Wayne County (town): math 20% / reading 33% proficiency, ranked #142 of 165 in KY (top 86%) — low school quality limits family demand, transient renter base, plan for 1-2y turnover.
- Zoned schools: Bell Elementary School (476 students, 82% FRL); Wayne County Middle School (math 18% / reading 36%, grade F, #172 of 217 statewide, top 80%, 679 students, 75% FRL); Wayne County High School (math 24% / reading 40%, grade F, #97 of 254 statewide, top 46%, 940 students, 76% FRL) — zoned schools average 78% FRL vs 57% district-wide (20 pts higher); higher-poverty schools than district average — tighter screening recommended.
- Market conditions: 192 active listings in the ZIP; 1 comparable units currently listed for rent nearby.
Forward outlook
- Local home prices are declining (-3.0%/yr); year-one equity from $795 of loan paydown is wiped out by about $3k of value loss. Plan a longer hold.
- Wayne County population projected at -20% by 2050 — secular population decline; favor cash flow + early exit over multi-decade hold.
Negotiation context
- It's been on market 38 days — a 3% lower offer ($112k) is reasonable based on typical stale-listing flexibility.
Risks & watch-outs
- Climate carrying-cost: moderate wildfire risk; extreme-heat days projected 7→21/yr by 2055 (HVAC capex compounding) — expect insurance premiums to compound above CPI over the hold.
Questions for the listing agent
- What do current leases actually rent for vs. the listed asking? Can we see a recent rent roll and the last 12 months of T-12 income?
- It's been on market 38 days. Have you received any prior offers? Is the seller open to a 17% concession, seller financing, or rate buy-down credit?
- Built in 1960 — when were the roof, HVAC, electrical panel, plumbing, and water heater last replaced?
- Is there a deadline driving the sale (1031 exchange, divorce, estate, relocation)? That informs how much negotiation room exists.
- Schools are F-rated, which usually means shorter tenancies and higher turnover. Who's the typical renter profile here, and what's been the actual vacancy rate?
- The area grade is low — what's the realistic commute time and amenity access for the typical tenant pool here? Any planned neighborhood developments (good or bad) we should know about?
- What's the average days-on-market for RENTAL listings here right now (not sales)? A rising rental-DOM trend means longer vacancies and softer asking-rent achievability than the comps imply.
- What's the recent tenant-quality profile in this submarket — average credit score on applications, eviction rate, late-payment / NSF rate, and stable-employment percentage? A property-management company in the area should have these aggregated.
- How much new for-sale + rental construction is in the pipeline within 1–3 miles? Heavy new supply typically softens prices + rents 12–24 months out; constrained supply supports both.
Investment metrics
- 1% rule
- 0.83% ✗
- Cap rate
- 5.83%
- Cash-on-cash
- -1.65%
- DSCR
- 0.93
- GRM
- 10.1
CMA / ARV
- ARV (median comp)
- $160,455
- List price
- $115,000
- Delta
- -28.33%
- Verdict
- UNDERPRICED
- Comps
- 10 within 1.0 mi
Show comp detail 1 sale within ~0.75 mi
| Address | Dist | Beds/Ba | Sqft | Sold | Price | $/sf | Match |
|---|---|---|---|---|---|---|---|
| 145 N Colonial Ave Ave | 0.58mi | 3/1.0 | 1,175 (+14%) | 19mo | $185,000 | $157 | 34 |
Match score weights: distance 35% · size 25% · config 20% · recency 20%. Top-matched comps best support the ARV.
Projected returns pro-forma
-3.0% appreciation · 3.0% rent growth · sell at horizon
- IRR
- -19.0%
- Equity multiple
- 0.33×
- Total profit
- $-21,438
- Equity at exit
- $17,147
- IRR
- -11.5%
- Equity multiple
- 0.31×
- Total profit
- $-22,238
- Equity at exit
- $9,943
Cash invested: $32,200 (down + closing). Projections, not guarantees.
Landlord ↔ Tenant lean methodology
- Overall (STATE)
- 83 Strongly Landlord-Friendly
- State Kentucky
- 83 Strongly Landlord-Friendly · R+16
- County
- — inherits STATE
- City
- — inherits STATE
ZIP-level market 42633
- Home prices YoY
- -11.3%
- Active inventory
- 192
- Price-to-rent
- 10.1×
Monthly cashflow live
- Estimated rent
- $950 medium interval (Pro) →
- Mortgage (P&I)
- −$603
- Tax est. 1.5%
- −$144 /mo · $1,725/yr
- Insurance
- −$48
- HOA
- −$0
- Vacancy / Maint / Mgmt
- −$200
- Net cashflow
- $-44
Break-even live
Sensitivity live
| Price | -10% $35 | -5% $-5 | +0% $-44 | +5% $-84 | +10% $-124 |
|---|---|---|---|---|---|
| Rent | -10% $-119 | -5% $-82 | +0% $-44 | +5% $-7 | +10% $31 |
| Rate | -1.0pp $14 | -0.5pp $-15 | base $-44 | +0.5pp $-74 | +1.0pp $-104 |
UW: 25.0% down · 7.5% · 30yr · 1.5% tax · 5.0% vac · 8.0% maint · 8.0% mgmt
Financing live
Cash to close
- Down payment
- $28,750
- Closing costs
- $3,450
- Reserves months
- —
- Total cash needed
- —
Loan-product check · same deal, 3 products live
Conventional
25% down · 7.5% · 30yr
- Down + closing
- —
- Monthly P&I
- —
- Monthly cashflow
- —
- DSCR
- —
- Eligible?
- —
Personal DTI + credit; lowest rate.
DSCR
20% down · 8.5% · 30yr
- Down + closing
- —
- Monthly P&I
- —
- Monthly cashflow
- —
- DSCR
- —
- Eligible?
- —
No personal income docs; deal must DSCR.
Hard money
10% down · 12.0% · 12mo
- Down + closing
- —
- Monthly P&I
- —
- Monthly cashflow
- —
- DSCR
- —
- Eligible?
- —
Short-term bridge; refi at stabilization.
Rent comps 1 comps
| Address | Beds | Baths | Sqft | Rent | $/sqft | DOM | Units | Dist |
|---|---|---|---|---|---|---|---|---|
| 43 Carter Gregory Unit 11 Monticello, KY | 3.0 | 1.5 | 980 | $950 | $0.97 | 45d | 1 | 1.00mi |
Listing history 18 events
-
2026-06-21days on market $115,000 Active 38 DOM
-
2026-06-21days on market $115,000 Active 37 DOM
-
2026-06-18days on market $115,000 Active 35 DOM
-
2026-06-17days on market $115,000 Active 34 DOM
-
2026-06-16days on market $115,000 Active 33 DOM
-
2026-06-15days on market $115,000 Active 32 DOM
-
2026-06-13days on market $115,000 Active 30 DOM
-
2026-06-12days on market $115,000 Active 29 DOM
-
2026-06-09days on market $115,000 Active 26 DOM
-
2026-06-08days on market $115,000 Active 25 DOM
-
2026-06-07pricedays on market $115,000 Active 24 DOM
-
2026-06-05days on market $124,900 Active 22 DOM
-
2026-06-04days on market $124,900 Active 20 DOM
-
2026-06-02days on market $124,900 Active 19 DOM
-
2026-06-01days on market $124,900 Active 18 DOM
-
2026-05-31days on market $124,900 Active 17 DOM
-
2026-05-31days on market $124,900 Active 16 DOM
-
2026-05-14$124,900 Active 853-char remark
ⓘ Source: listings_history table (triggers on properties + properties_extension) + one-shot
backfill from property_details.listing_events for pre-trigger history.
Climate risk First Street
- Flood 1/10 Low FEMA zone X (unshaded) · 0% chance over 30 yrs
- Wildfire 5/10 Major
- Heat 5/10 Major 7 d/yr ≥101°F today · 21 d/yr by 30 yrs out
- Wind 3/10 Moderate 6% chance of damaging wind over 30 yrs
- Air quality 1/10 Low 0 unhealthy d/yr today · 0 by 30 yrs out
Nearby sold comps map
Loading sold comps map…
Walkable amenities ~0.75 mi
Loading nearby amenities…
Taxation est. · year 1
- Rental income
- $11,400
- − Mortgage interest
- −$6,442
- − Property taxes
- −$1,725
- − Insurance
- −$575
- − Repairs & maintenance
- −$912
- − Management
- −$912
- − Depreciation
- −$3,345
- Taxable loss
- −$2,511
- Est. tax savings @ 24.0%
- +$603
- After-tax cash flow
- $72/yr
For passive investors: Depreciation is non-cash, so a rental often shows a tax loss while cash-flowing — sheltering income. Rental losses are passive: they offset passive income freely, and up to $25,000/yr can offset ordinary (W-2) income if you actively participate and your MAGI is under $100k (phasing out to $0 by $150k); unused losses carry forward. On sale, claimed depreciation is recaptured at up to 25%, and gains may owe capital-gains tax (a 1031 exchange can defer both). Figures are a year-1 estimate at your 24.0% rate — not tax advice; consult a CPA.
Condition & rehab AI · 12 photos
This home requires moderate renovations, including new appliances and fixtures, to improve its resale and rental value.
Repairs flagged
- Major Appliances — Outdated and in need of replacement.
- Major Bathroom fixtures — Dated and in need of replacement.
- Major Landscaping — Basic and could be improved for curb appeal.
Value-add opportunities
- Resale New appliances — Modern appliances will attract more buyers.
- Resale New bathroom fixtures — Up-to-date fixtures will appeal to potential buyers.
- Both Landscaping improvements — Enhanced curb appeal will attract both buyers and renters.
- Rental HVAC upgrade — A new HVAC system will attract renters and improve tenant satisfaction.
Renovation cost estimate screening
| Repair item | Severity | Est. cost |
|---|---|---|
| Appliances · Outdated and in need of replacement. | Major | $15,000–50,000 |
| Bathroom fixtures · Dated and in need of replacement. | Major | $15,000–50,000 |
| Landscaping · Basic and could be improved for curb appeal. | Major | $15,000–50,000 |
| Total estimated repair cost · 3 items | $45,000–150,000 |
Value-add ROI direction
- Resale New appliances — Modern appliances will attract more buyers. ↑
- Resale New bathroom fixtures — Up-to-date fixtures will appeal to potential buyers. ↑
- Both Landscaping improvements — Enhanced curb appeal will attract both buyers and renters. ↑
- Rental HVAC upgrade — A new HVAC system will attract renters and improve tenant satisfaction. ↑
ⓘ Cost ranges are severity-bucket heuristics (US national rule-of-thumb). Get contractor quotes + a written scope before underwriting a rehab budget.
Schools (NCES district)
- District
- Wayne County
- NCES district ID
- 2105790
- Math proficiency
- 20% ▼ -21.00%
- Reading proficiency
- 33% ▼ -21.00%
- Median HH income
- $30,391
- Composite
- 21.38/100
- National rank
- #8358
- State rank
- #142 of 165 in KY
Livability — Monticello
- Score
- 65/100
- State rank
- #265
- US rank
- #12963
Category grades
Schools grade is shown separately in the Schools card above.
Census & demographics
- Census place
- Monticello, KY
- Population (ZIP)
- 18,609
Population outlook (Wayne County) Hauer SSP2
- Today (2025)
- 19,477 people
- By 2030
- 18,776 · -3.6%
- By 2040
- 17,199 · -11.7%
- By 2050
- 15,602 · -19.9%
- By 2075
- 11,883 · -39.0%
- By 2100
- 8,300 · -57.4%
Race, ethnicity, and origin ACS 2023
- Neighborhood character
- Predominantly White (92%)
- Race & ethnicity
- White 92% Hispanic / Latino 5% Two or more races 3% Black 1%
- Common ancestry
- Slovak 1% Iranian 1% Scottish 1%
- Foreign-born
- 2% · Canada
- Languages at home
- 96% English-only · Spanish 3%
Political lean MEDSL · Wayne
- 2024 margin
- Solid R (+66.0) · D 16.5% · R 82.5%
- 2008→2024 swing
- -28.9pp toward R · 2008: -37.1pp · 2024: -66.0pp
- All cycles
- 2024: R+66.0 2020: R+62.0 2016: R+61.8 2012: R+47.6 2008: R+37.1
Not yet ingested
- Civics
- —
Market trends
- HPI YoY
- ▼ -29.14%
- Current HPI
- 227.5936
- Rent YoY
- —
- Metro
- —
- State GDP YoY
- ▲ 1.81%
- F500 in state
- 4
Industry mix (Fortune 500 HQ in KY)
| Industry | F500 HQs | Revenue |
|---|---|---|
| Healthcare | 1 | $118B |
|
||
| Food / Beverage | 1 | $7B |
|
||
Price history
-7.9% since first listed2 events — show timeline
- 2026-06-06 Price Changed $115,000 ImagineMLS
- 2026-05-14 Listed $124,900 ImagineMLS
Cash-flow waterfall
monthlySold comps — $/sqft
last 12 mo · ≤1 miLoading sold comps…