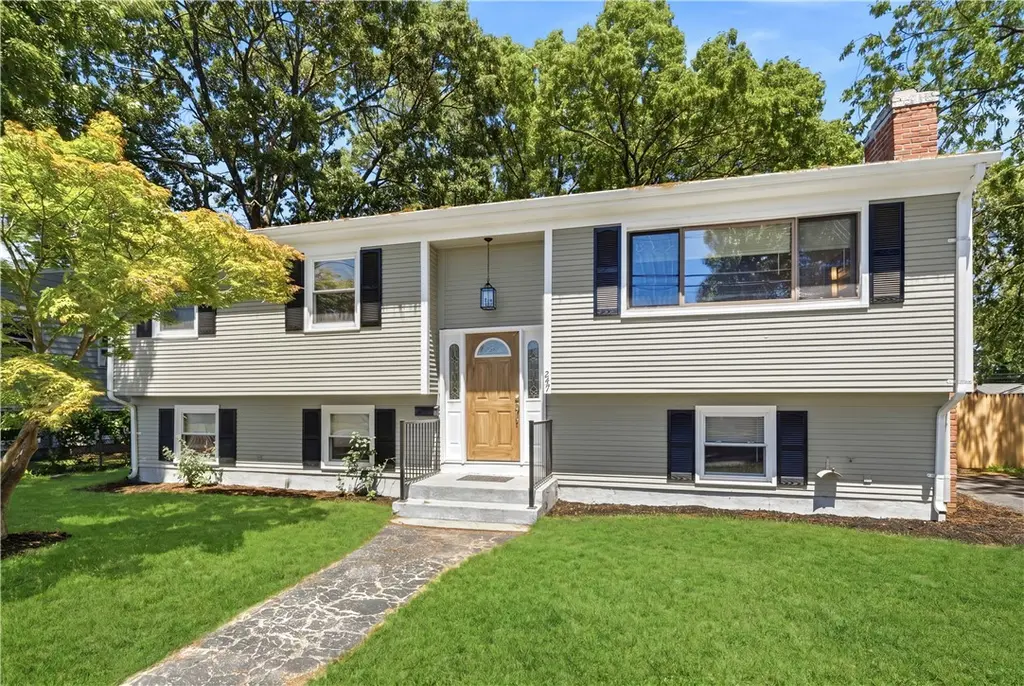
247 Asylum Rd · Warwick, RI
Flood risk 1/10 · Minimal
- FEMA flood zone
- X (unshaded)
- Chance of flooding over 30 yrs
- 0.0%
- Est. flood insurance / yr
- $473 – $860
Fire risk 1/10 · Minimal
- Est. fire insurance / yr
- $835 – $1,551
Heat risk 5/10 · Moderate
- Hot days now (above 95°F)
- 7 days/yr
- Hot days in 30 yrs
- 16 days/yr
Wind risk 6/10 · Moderate
- Chance of severe wind over 30 yrs
- 74.0%
Air-quality risk 2/10 · Minimal
- Unhealthy air days now
- 2 days/yr
- Unhealthy air days in 30 yrs
- 2 days/yr
Risk factors via First Street. Map © Google.
Why this score? — see what drove the F grade
The composite is a weighted blend of 9 inputs, each scored 0–100. Each bar is that input's sub-score; the figure is the points it added to the 100-point composite (weight × sub-score).
- Cash flow +4.5/30.0
- Livability +3.9/5.0
- Rent growth +2.5/5.0
- Condition / age +2.5/5.0
- Schools +2.2/10.0
- 1% rule +0.0/10.0
- DSCR +0.0/10.0
- ARV discount +0.0/15.0
- Appreciation +0.0/10.0
$549,000
🖨 Deal sheet (PDF) 📄 Offer letter ✓ Due diligence
Listing remarks MLS
OFFER DEADLINE FOR HIGHEST AND BEST OFFERS IS SUNDAY, MARCH 1, 2026 AT 1:00 PM. Popular Buttonwoods neighborhood just 6 houses from City Park! City Park is 126 acres offering residents a saltwater beach with bathhouse, paved hiking/bike trail, playground with kiddie area, baseball fields, a basketball court, tennis, pickleball, a picnic area and more! This beloved property is in an estate and needs some updating. .. however. .. already has a brand new roof, kitchen appliances (stove, refrigerator and dishwasher and new carpeting. Some other features include a wood burning fireplace, hardwood floors and central air! The upper level offers 2 oversized bedrooms and a full bath, kitchen, dining room and living room and the lower level (space is above grade) offers an abundance of additional space including a 3rd bedroom with half bath and laundry along with 2 large finished rooms allowing for flexible space. .. could be offices, additional bedrooms, rec rooms, playrooms, etc. .. whatever your needs may be! There is a slider in the dining room leading out to a lovely deck which overlooks the fenced backyard with 2 potting sheds! Don't miss this tremendous opportunity to make this wonderful home your own! Property being sold "as is".
Key facts
- Quartz countertops
- Updated kitchen
- Central air
Tags
Property features AI
Finance
- Other: Lot size about 0.17 acres (7,405 sq ft)
- Financial info: Financial details not provided
- HOA & community: HOA/community details not provided
Exterior
- Parking: No garage; Space for 4 vehicles
- Security: Security details not provided
- Utilities: Water connected; Sewer connected; Electrical service: 100 amps
- Home design: 2-story home; Above-grade finished living area approximately 1,913
- Construction: Drywall interior; Shingle siding; Wood siding; Concrete perimeter foundation
- Exterior features: Walkable to water
Interior
- Kitchen: Gas water heater listed with appliances
- Bedrooms: Bedrooms information not provided
- Flooring: Hardwood
- Bathrooms: 2 full bathrooms
- Heating & cooling: Gas heating; Central air conditioning
- Interior features: Hardwood floors; Tub with shower; Masonry fireplace (1)
- Laundry & utility: Laundry/utility details not provided
Neighborhood map
What this means for you Summary
Snapshot
- This is a 3-bed/1.5-bath single-family listed at $549k.
Deal economics
- At list price, monthly cash flow is $-1k ($-17k/yr) — negative.
- To cash-flow at today's rent, offer at most $300k (45.4% below list).
- To meet the 1% rule (rent ≥ 1% of price), the offer needs to be $263k (52.1% below list).
- Recommended offer: $263k (52.1% below list) — sets the bar for 1% rule.
Location & tenants
- Location reads 78/100 on livability (#6 in RI, #2,425 nationally) — a middle-class / working-renter tenant base. Strengths: crime A+, commute A+, housing A+; Watch: amenities F.
- Warwick (urban): math 15% / reading 32% proficiency, ranked #25 of 39 in RI (top 64%) — low school quality limits family demand, transient renter base, plan for 1-2y turnover.
- Zoned schools: Park School (math 22% / reading 42%, grade F, #67 of 167 statewide, top 46%, 215 students, 31% FRL).
- Market conditions: 120 active listings in the ZIP; 7 comparable units currently listed for rent nearby; rentals at typical pace (median 22d on market — plan ~3-4 weeks tenant-placement turnaround); 471 units permitted in Kent County in 2024 (240 in 5+ unit buildings).
Forward outlook
- Local home prices are declining (-3.0%/yr); year-one equity from $4k of loan paydown is wiped out by about $16k of value loss. Plan a longer hold.
- Kent County population projected at -14% by 2050 — secular population decline; favor cash flow + early exit over multi-decade hold.
Negotiation context
- Only 3 days on market — expect competitive offers; lowballing is unlikely to land.
- 2 sale attempts with the ask held roughly flat each time — persistent listings suggest the price (not the market) is what's stuck; bring a comps-based counter.
- Current owner paid $350k; list at $549k implies a 57% gain — meaningful room to come down on a strong offer.
Risks & watch-outs
- Climate carrying-cost: major wind risk, 74% chance of damaging wind over 30y; extreme-heat days projected 7→16/yr by 2055 (HVAC capex compounding) — expect insurance premiums to compound above CPI over the hold.
Questions for the listing agent
- What do current leases actually rent for vs. the listed asking? Can we see a recent rent roll and the last 12 months of T-12 income?
- Built in 1967 — when were the roof, HVAC, electrical panel, plumbing, and water heater last replaced?
- Is there a deadline driving the sale (1031 exchange, divorce, estate, relocation)? That informs how much negotiation room exists.
- Schools are D-rated, which usually means shorter tenancies and higher turnover. Who's the typical renter profile here, and what's been the actual vacancy rate?
- The area grade is low — what's the realistic commute time and amenity access for the typical tenant pool here? Any planned neighborhood developments (good or bad) we should know about?
- What's the average days-on-market for RENTAL listings here right now (not sales)? A rising rental-DOM trend means longer vacancies and softer asking-rent achievability than the comps imply.
- What's the recent tenant-quality profile in this submarket — average credit score on applications, eviction rate, late-payment / NSF rate, and stable-employment percentage? A property-management company in the area should have these aggregated.
- How much new for-sale + rental construction is in the pipeline within 1–3 miles? Heavy new supply typically softens prices + rents 12–24 months out; constrained supply supports both.
Investment metrics
- 1% rule
- 0.48% ✗
- Cap rate
- 3.21%
- Cash-on-cash
- -11.01%
- DSCR
- 0.51
- GRM
- 17.4
CMA / ARV
- ARV (on-the-fly)
- $436,152
- Comps found
- 12
Show comp detail 12 sales within ~0.75 mi
| Address | Dist | Beds/Ba | Sqft | Sold | Price | $/sf | Match |
|---|---|---|---|---|---|---|---|
| 148 Asylum Rd | 0.15mi | 3/1.0 | 1,008 (-6%) | 1mo | $430,000 | $427 | 81 |
| 288 Cove Ave | 0.26mi | 3/1.0 | 1,004 (-6%) | 4mo | $420,000 | $418 | 72 |
| 48 Wellington Ave | 0.04mi | 3/1.0 | 960 (-10%) | 9mo | $440,000 | $458 | 72 |
| 136 Missouri Dr | 0.31mi | 3/1.0 | 1,152 (+8%) | 1mo | $417,500 | $362 | 70 |
| 71 Macarthur Dr | 0.38mi | 2/1.0 (-1) | 1,080 (+1%) | 7mo | $362,500 | $336 | 68 |
| 11 Midway Dr | 0.25mi | 2/1.0 (-1) | 1,152 (+8%) | 3mo | $417,500 | $362 | 65 |
| 190 White Ave | 0.11mi | 3/1.0 | 912 (-15%) | 10mo | $379,000 | $416 | 60 |
| 65 Almy St | 0.73mi | 3/1.0 | 1,080 (+1%) | 4mo | $390,000 | $361 | 60 |
| 4 Ellsworth St | 0.29mi | 3/1.0 | 1,200 (+12%) | 9mo | $375,000 | $313 | 56 |
| 77 Buttonwoods Ave | 0.67mi | 3/1.0 | 972 (-9%) | 4mo | $397,000 | $408 | 48 |
| 201 Hollis Ave | 0.55mi | 2/1.0 (-1) | 940 (-12%) | 3mo | $335,000 | $356 | 45 |
| 73 Custer St | 0.75mi | 3/1.0 | 960 (-10%) | 7mo | $405,000 | $422 | 40 |
Match score weights: distance 35% · size 25% · config 20% · recency 20%. Top-matched comps best support the ARV.
Projected returns pro-forma
-3.0% appreciation · 3.0% rent growth · sell at horizon
- IRR
- -36.4%
- Equity multiple
- -0.16×
- Total profit
- $-178,932
- Equity at exit
- $81,858
- IRR
- -51.2%
- Equity multiple
- -0.77×
- Total profit
- $-272,073
- Equity at exit
- $47,467
Cash invested: $153,720 (down + closing). Projections, not guarantees.
Landlord ↔ Tenant lean methodology
- Overall (STATE)
- 31 Tenant-Leaning
- State Rhode Island
- 31 Tenant-Leaning · D+8
- County
- — inherits STATE
- City
- — inherits STATE
ZIP-level market 02886
- Active inventory
- 120
- Price-to-rent
- 17.4×
Monthly cashflow live
- Estimated rent
- $2,630 high interval (Pro) →
- Mortgage (P&I)
- −$2,879
- Tax from tax record
- −$380 /mo · $4,563/yr
- Insurance
- −$229
- HOA
- −$0
- Vacancy / Maint / Mgmt
- −$552
- Net cashflow
- $-1,410
Break-even live
Sensitivity live
| Price | -10% $-1,100 | -5% $-1,255 | +0% $-1,410 | +5% $-1,566 | +10% $-1,721 |
|---|---|---|---|---|---|
| Rent | -10% $-1,618 | -5% $-1,514 | +0% $-1,410 | +5% $-1,306 | +10% $-1,203 |
| Rate | -1.0pp $-1,134 | -0.5pp $-1,271 | base $-1,410 | +0.5pp $-1,553 | +1.0pp $-1,697 |
UW: 25.0% down · 7.5% · 30yr · 1.5% tax · 5.0% vac · 8.0% maint · 8.0% mgmt
Financing live
Cash to close
- Down payment
- $137,250
- Closing costs
- $16,470
- Reserves months
- —
- Total cash needed
- —
Loan-product check · same deal, 3 products live
Conventional
25% down · 7.5% · 30yr
- Down + closing
- —
- Monthly P&I
- —
- Monthly cashflow
- —
- DSCR
- —
- Eligible?
- —
Personal DTI + credit; lowest rate.
DSCR
20% down · 8.5% · 30yr
- Down + closing
- —
- Monthly P&I
- —
- Monthly cashflow
- —
- DSCR
- —
- Eligible?
- —
No personal income docs; deal must DSCR.
Hard money
10% down · 12.0% · 12mo
- Down + closing
- —
- Monthly P&I
- —
- Monthly cashflow
- —
- DSCR
- —
- Eligible?
- —
Short-term bridge; refi at stabilization.
Rent comps 7 comps
| Address | Beds | Baths | Sqft | Rent | $/sqft | DOM | Units | Dist |
|---|---|---|---|---|---|---|---|---|
| 5 Moccasin Dr Warwick, RI | 2.0 | 1.0 | 930 | $2,350 | $2.53 | 18d | 1 | 0.47mi |
| 191 Shand Ave Warwick, RI | 2.0 | 1.0 | 900 | $3,000 | $3.33 | 22d | 1 | 0.56mi |
| 168 Main Ave Warwick, RI | 2.0 | 1.0 | 800 | $2,500 | $3.12 | 18d | 1 | 0.66mi |
| 3524 W Shore Rd Warwick, RI | 1.0–2.0 | 1.0–1.5 | 910 | $2,500 | $2.75 | 45d | 2 | 1.16mi |
| 3524 W Shore Rd #505 Warwick, RI | 2.0 | 1.5 | 1100 | $2,500 | $2.27 | 46d | 1 | 1.17mi |
| 185 Ottawa Ave Warwick, RI | 2.0 | 2.0 | 928 | $2,450 | $2.64 | 25d | 1 | 1.27mi |
| 115 Coburn St Warwick, RI | 3.0 | 2.0 | 1416 | $3,395 | $2.40 | 3d | 1 | 1.33mi |
Listing history 4 events
-
2026-06-07statusdays on market $549,000 Pending 3 DOM
-
2026-06-03days on market $549,000 Active 2 DOM
-
2026-06-02remarks 536-char remark
-
2026-06-02$549,000 Active 1 DOM
ⓘ Source: listings_history table (triggers on properties + properties_extension) + one-shot
backfill from property_details.listing_events for pre-trigger history.
Tax reassessment forecast RI · Partial reset (capped growth)
- Current annual tax
- $4,563 · $380/mo
- Projected year-2 tax
- $6,756 · $563/mo
- Expected delta
- +$2,193/yr (+$183/mo · 48.1%)
ⓘ Screening estimate from a state-policy table — verify with the county assessor before closing.
Climate risk First Street
- Flood 1/10 Low FEMA zone X (unshaded) · 0% chance over 30 yrs
- Wildfire 1/10 Low
- Heat 5/10 Major 7 d/yr ≥95°F today · 16 d/yr by 30 yrs out
- Wind 6/10 Major 74% chance of damaging wind over 30 yrs
- Air quality 2/10 Low 2 unhealthy d/yr today · 2 by 30 yrs out
Nearby sold comps map
Loading sold comps map…
Walkable amenities ~0.75 mi
Loading nearby amenities…
Taxation est. · year 1
- Rental income
- $31,560
- − Mortgage interest
- −$30,753
- − Property taxes
- −$4,563
- − Insurance
- −$2,745
- − Repairs & maintenance
- −$2,525
- − Management
- −$2,525
- − Depreciation
- −$15,971
- Taxable loss
- −$27,521
- Est. tax savings @ 24.0%
- +$6,605
- After-tax cash flow
- $-10,318/yr
For passive investors: Depreciation is non-cash, so a rental often shows a tax loss while cash-flowing — sheltering income. Rental losses are passive: they offset passive income freely, and up to $25,000/yr can offset ordinary (W-2) income if you actively participate and your MAGI is under $100k (phasing out to $0 by $150k); unused losses carry forward. On sale, claimed depreciation is recaptured at up to 25%, and gains may owe capital-gains tax (a 1031 exchange can defer both). Figures are a year-1 estimate at your 24.0% rate — not tax advice; consult a CPA.
Schools (NCES district)
- District
- Warwick
- NCES district ID
- 4401110
- Math proficiency
- 15% ▼ -11.00%
- Reading proficiency
- 32% ▼ -7.00%
- Median HH income
- $63,420
- Composite
- 22.03/100
- National rank
- #8203
- State rank
- #25 of 39 in RI
Livability — Warwick
- Score
- 78/100
- State rank
- #6
- US rank
- #2425
Category grades
Schools grade is shown separately in the Schools card above.
Census & demographics
- Census place
- Warwick, RI
- City population
- 108,434
- Population (ZIP)
- 30,925
Population outlook (Kent County) Hauer SSP2
- Today (2025)
- 160,994 people
- By 2030
- 157,428 · -2.2%
- By 2040
- 148,389 · -7.8%
- By 2050
- 137,995 · -14.3%
- By 2075
- 118,536 · -26.4%
- By 2100
- 102,266 · -36.5%
Race, ethnicity, and origin ACS 2023
- Neighborhood character
- Predominantly White (85%)
- Race & ethnicity
- White 85% Two or more races 6% Hispanic / Latino 5% Asian 4% Black 2%
- Common ancestry
- Lithuanian 8% Russian 7% Romanian 3%
- Foreign-born
- 7% · Canada
- Languages at home
- 91% English-only · Spanish 2% Other Asian/Pacific 2% Other Indo-European 2%
Political lean MEDSL · Kent
- 2024 margin
- Toss-up / Even · D 49.9% · R 48.1% · Other 2.0%
- 2008→2024 swing
- -15.6pp toward R · 2008: 17.5pp · 2024: 1.9pp
- All cycles
- 2024: D+1.9 2020: D+7.6 2016: R+0.7 2012: D+18.4 2008: D+17.5
Not yet ingested
- Civics
- —
Market trends
- HPI YoY
- ▼ -425.54%
- Current HPI
- 350.8111
- Rent YoY
- —
- Metro
- —
- State GDP YoY
- ▲ 2.25%
- F500 in state
- 10
Industry mix (Fortune 500 HQ in RI)
| Industry | F500 HQs | Revenue |
|---|---|---|
| Healthcare | 1 | $373B |
|
||
| Food Distribution | 1 | $31B |
|
||
| Aerospace / Defense | 1 | $14B |
|
||
| Financial Services | 1 | $8B |
|
||
| Consumer Goods | 1 | $4B |
|
||
Price history
+40.8% since first listed4 events — show timeline
- 2026-06-01 Listed $549,000 RIS
- 2026-03-24 Sold (MLS) $350,000 RIS
- 2026-03-06 Pending — RIS
- 2026-02-27 Listed $389,900 RIS
Property tax history
+2.2%/yrLatest (2025): $4,563 · +7.2% YoY. Source: county tax records.
Cash-flow waterfall
monthlySold comps — $/sqft
last 12 mo · ≤1 miLoading sold comps…