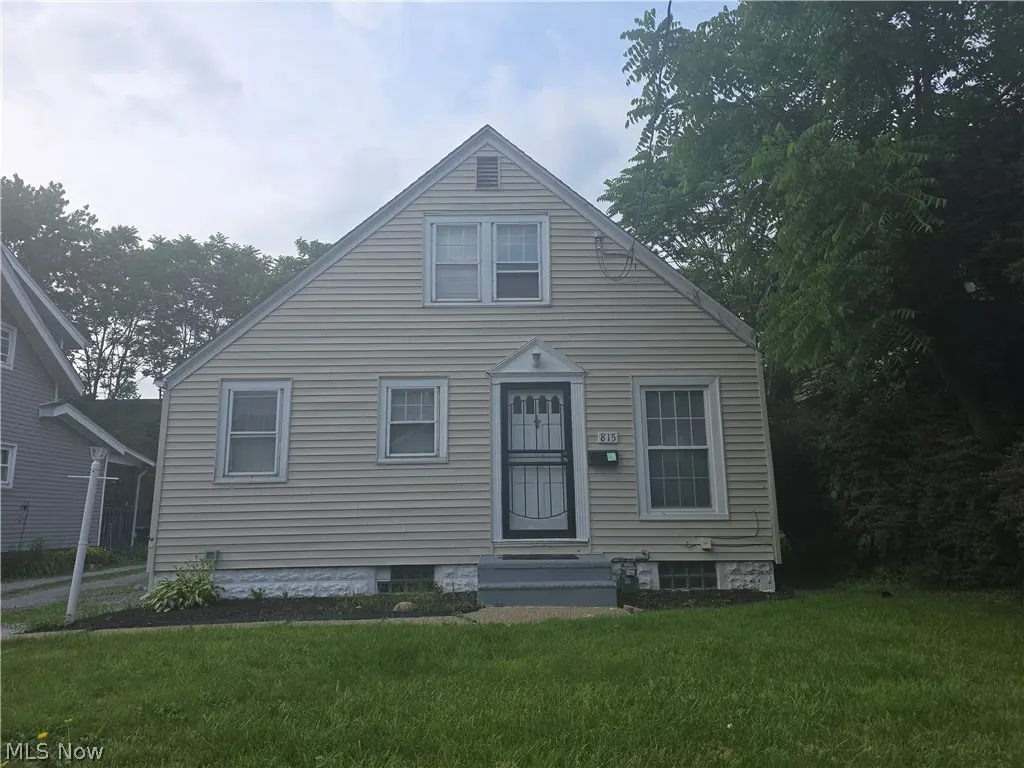
815 Russell Ave · Akron, OH
Flood risk 1/10 · Minimal
- FEMA flood zone
- X (unshaded)
- Chance of flooding over 30 yrs
- 0.0%
- Est. flood insurance / yr
- $473 – $860
Fire risk 1/10 · Minimal
- Est. fire insurance / yr
- $713 – $1,323
Heat risk 3/10 · Minor
- Hot days now (above 96°F)
- 7 days/yr
- Hot days in 30 yrs
- 16 days/yr
Wind risk 1/10 · Minimal
- Chance of severe wind over 30 yrs
- —
Air-quality risk 2/10 · Minimal
- Unhealthy air days now
- 1 days/yr
- Unhealthy air days in 30 yrs
- 2 days/yr
Risk factors via First Street. Map © Google.
Why this score? — see what drove the B- grade
The composite is a weighted blend of 9 inputs, each scored 0–100. Each bar is that input's sub-score; the figure is the points it added to the 100-point composite (weight × sub-score).
- Cash flow +27.7/30.0
- DSCR +9.8/10.0
- ARV discount +9.0/15.0
- 1% rule +7.3/10.0
- Appreciation +4.9/10.0
- Livability +4.0/5.0
- Rent growth +2.5/5.0
- Condition / age +2.5/5.0
- Schools +2.1/10.0
$97,000
🖨 Deal sheet 📄 Offer letter ✓ Due diligence
Listing remarks
Great starter home or perfect investor opportunity! Freshly updated 3 bedroom Cape Cod, includes gas range and brand new refrigerator. Conveniently located near Amazon hub in West Akron. New carpet throughout, updated electric, hot water tank 2026, furnace 2023, large unfinished basement great for storage.
Key facts
- Hot water tank
- Updated electric
- Gas range
Tags
Property features AI
Exterior
- Parking: Off-street parking
- Utilities: Public water; Public sewer; Public power (implied)
- Home design: 2-story house; Above-grade finished area approximately 1,114 (public records)
- Construction: Vinyl siding; Asphalt roof; Unfinished basement
- Exterior features: Off-street parking; Lot recorded at 0.1111 acres
Interior
- Kitchen: Range; Refrigerator
- Bedrooms: 2 main-level bedrooms
- Bathrooms: 1 full bathroom (main level)
- Heating & cooling: Forced air heating; Gas heating
- Interior features: Ceiling fan(s)
- Laundry & utility: Washer hookup in basement; Electric dryer hookup; Gas dryer hookup
Neighborhood map
What this means for you Summary
Snapshot
- This is a 3-bed/1.0-bath single-family listed at $97k.
Deal economics
- At list price, monthly cash flow is $294 ($4k/yr) — positive.
- The deal already cash-flows at list — no discount required.
- Meets the 1% rule at list price ($1k rent vs $97k).
- Cap rate 9.9% vs local median 6.6% in Akron — top-decile yield for the area; either an underpriced asset or a hidden risk that comps aren't pricing in. Stress-test before assuming the spread holds.
Location & tenants
- Location reads 81/100 on livability (#104 in OH, #1,591 nationally) — a professional / high-income tenant draw. Strengths: amenities A+, commute A+, cost of living A+; Watch: crime F, employment F.
- Akron City (urban): math 22% / reading 30% proficiency, ranked #602 of 656 in OH (top 92%) — low school quality limits family demand, transient renter base, plan for 1-2y turnover; 66% free/reduced lunch — lower-income household profile, screen leases tightly.
- Market conditions: 42 active listings in the ZIP; 40 comparable units currently listed for rent nearby; rentals lingering (median 44d on market — plan ~5-8 weeks vacancy on turnover, expect pricing pressure); 50% of comp listings sitting > 30 days — soft ceiling on asking rent; lower-income renter base — watch delinquency; 1,114 units permitted in Summit County in 2024 (397 in 5+ unit buildings).
- At $1,192/mo this rent would consume 52% of the median local household income ($28k/yr) (locally 787% of renters already pay >50% of income on rent) — very limited rent-growth headroom before tenants either downsize or default.
Forward outlook
- In year one you build about $480 of equity ($671 loan paydown + $-191 appreciation (-0.2% local appreciation)).
- Summit County population projected to shrink 6% by 2050 — rents likely to lag national; underwrite the cash flow, not the appreciation.
- At projected returns (-0.2% appreciation + 3.0% rent growth), your $27k cash investment doubles in ~6 years — after that, you're playing with house money.
Negotiation context
- Only 8 days on market — expect competitive offers; lowballing is unlikely to land.
- Current owner paid $24k; list at $97k implies a 304% gain — meaningful room to come down on a strong offer.
Risks & watch-outs
- Watch-outs: built in 1927 — expect roof / HVAC / electrical / plumbing capex.
Questions for the listing agent
- Built in 1927 — when were the roof, HVAC, electrical panel, plumbing, and water heater last replaced?
- Is there a deadline driving the sale (1031 exchange, divorce, estate, relocation)? That informs how much negotiation room exists.
- Crime grade is F in this area — have there been break-ins, vandalism, or insurance claims at this property in the last 3 years? What carrier currently insures it and at what premium?
- What's the average days-on-market for RENTAL listings here right now (not sales)? A rising rental-DOM trend means longer vacancies and softer asking-rent achievability than the comps imply.
- What's the recent tenant-quality profile in this submarket — average credit score on applications, eviction rate, late-payment / NSF rate, and stable-employment percentage? A property-management company in the area should have these aggregated.
- How much new for-sale + rental construction is in the pipeline within 1–3 miles? Heavy new supply typically softens prices + rents 12–24 months out; constrained supply supports both.
Investment metrics
- 1% rule
- 1.23% ✓
- Cap rate
- 9.92%
- Cash-on-cash
- 12.97%
- DSCR
- 1.58
- GRM
- 6.8
CMA / ARV
- ARV (on-the-fly)
- $100,260
- Comps found
- 12
Show comp detail 12 sales within ~0.75 mi
| Address | Dist | Beds/Ba | Sqft | Sold | Price | $/sf | Match |
|---|---|---|---|---|---|---|---|
| 815 Longview Ave | 0.23mi | 3/1.0 | 1,152 (+3%) | 3mo | $53,701 | $47 | 81 |
| 923 Russell Ave | 0.21mi | 3/1.0 | 1,244 (+12%) | 1mo | $142,000 | $114 | 70 |
| 1825 9th St SW | 0.58mi | 3/2.0 | 1,146 (+3%) | 6mo | $118,000 | $103 | 59 |
| 1311 Superior Ave | 0.49mi | 3/1.0 | 1,008 (-10%) | 4mo | $50,000 | $50 | 58 |
| 1352 Diagonal Rd | 0.59mi | 3/1.0 | 1,200 (+8%) | 5mo | $108,500 | $90 | 55 |
| 994 Moeller Ave | 0.73mi | 3/1.0 | 1,047 (-6%) | 1mo | $105,000 | $100 | 55 |
| 1855 W 17th St SW | 0.61mi | 2/1.0 (-1) | 1,050 (-6%) | 5mo | $85,000 | $81 | 53 |
| 966 La Belle Ave | 0.65mi | 2/1.0 (-1) | 1,170 (+5%) | 5mo | $105,000 | $90 | 52 |
| 940 Lakewood Blvd | 0.44mi | 2/1.0 (-1) | 996 (-11%) | 6mo | $96,000 | $96 | 52 |
| 880 Jason Ave | 0.51mi | 3/1.0 | 988 (-11%) | 6mo | $61,000 | $62 | 52 |
| 741 Jason Ave | 0.54mi | 3/1.5 | 1,241 (+11%) | 6mo | $117,500 | $95 | 49 |
| 1011 Laurel Ave | 0.65mi | 2/1.0 (-1) | 972 (-13%) | 3mo | $27,500 | $28 | 41 |
Match score weights: distance 35% · size 25% · config 20% · recency 20%. Top-matched comps best support the ARV.
Projected returns pro-forma
-0.2% appreciation · 3.0% rent growth · sell at horizon
- IRR
- 11.6%
- Equity multiple
- 1.55×
- Total profit
- $14,970
- Equity at exit
- $27,217
- IRR
- 16.7%
- Equity multiple
- 2.80×
- Total profit
- $48,853
- Equity at exit
- $31,968
Cash invested: $27,160 (down + closing). Projections, not guarantees.
Landlord ↔ Tenant lean methodology
- Overall (STATE)
- 73 Landlord-Friendly
- State Ohio
- 73 Landlord-Friendly · R+6
- County
- — inherits STATE
- City
- — inherits STATE
ZIP-level market 44307
- Home prices YoY
- -0.2%
- Active inventory
- 42
- Price-to-rent
- 6.8×
Monthly cashflow live
- Estimated rent
- $1,192 high interval (Pro) →
- Mortgage (P&I)
- −$509
- Tax from tax record
- −$99 /mo · $1,184/yr
- Insurance
- −$40
- HOA
- −$0
- Vacancy / Maint / Mgmt
- −$250
- Net cashflow
- $294
Break-even live
UW: 25.0% down · 7.5% · 30yr · 1.5% tax · 5.0% vac · 8.0% maint · 8.0% mgmt
Financing live
Cash to close
- Down payment
- $24,250
- Closing costs
- $2,910
- Reserves months
- —
- Total cash needed
- —
Loan-product check · same deal, 3 products live
Conventional
25% down · 7.5% · 30yr
- Down + closing
- —
- Monthly P&I
- —
- Monthly cashflow
- —
- DSCR
- —
- Eligible?
- —
Personal DTI + credit; lowest rate.
DSCR
20% down · 8.5% · 30yr
- Down + closing
- —
- Monthly P&I
- —
- Monthly cashflow
- —
- DSCR
- —
- Eligible?
- —
No personal income docs; deal must DSCR.
Hard money
10% down · 12.0% · 12mo
- Down + closing
- —
- Monthly P&I
- —
- Monthly cashflow
- —
- DSCR
- —
- Eligible?
- —
Short-term bridge; refi at stabilization.
Rent comps 40 comps
| Address | Beds | Baths | Sqft | Rent | $/sqft | DOM | Units | Dist |
|---|---|---|---|---|---|---|---|---|
| 899 Rosamond Ave Akron, OH | 1.0–2.0 | 1.0 | 690 | $825 | $1.20 | 23d | 1 | 0.20mi |
| 685 Longview Ave Akron, OH | 3.0 | 1.0 | 1100 | $1,150 | $1.05 | 44d | 1 | 0.33mi |
| 1313 Manchester Rd Akron, OH | 3.0 | 1.0 | 1221 | $1,200 | $0.98 | 21d | 1 | 0.36mi |
| 1171 La Croix Ave Unit 2 Akron, OH | 2.0 | 1.0 | 1267 | $975 | $0.77 | 44d | 1 | 0.41mi |
| 1161 La Croix Ave Akron, OH | 3.0 | 1.0 | 1452 | $1,200 | $0.83 | 23d | 1 | 0.41mi |
| 1032 Andrew St Akron, OH | 3.0 | 1.0 | 960 | $1,097 | $1.14 | 44d | 1 | 0.44mi |
| 760 Lakewood Blvd Akron, OH | 3.0 | 2.0 | 1398 | $1,150 | $0.82 | 23d | 1 | 0.47mi |
| 1069 Fess Ave Akron, OH | 2.0 | 1.0 | 940 | $1,095 | $1.16 | 44d | 1 | 0.47mi |
| 781 Saxon Ave Akron, OH | 2.0 | 1.0 | 800 | $900 | $1.12 | 44d | 1 | 0.48mi |
| 847 Jason Ave Unit 1 Akron, OH | 2.0 | 1.0 | 798 | $825 | $1.03 | 23d | 1 | 0.51mi |
| 783 Leonard St Akron, OH | 3.0 | 1.0 | 1040 | $1,250 | $1.20 | 44d | 1 | 0.55mi |
| 960 Jason Ave Akron, OH | 3.0 | 1.5 | 935 | $1,095 | $1.17 | 21d | 1 | 0.57mi |
| 991 Diana Ave Akron, OH | 3.0 | 2.0 | 1264 | $1,325 | $1.05 | 44d | 1 | 0.61mi |
| 1494 Diagonal Rd Akron, OH | 3.0 | 1.0 | 1064 | $1,495 | $1.41 | 44d | 1 | 0.63mi |
| 527 Brady Ave Akron, OH | 3.0 | 1.5 | 1416 | $1,395 | $0.99 | 44d | 1 | 0.78mi |
| 1092 Peerless Ave Akron, OH | 3.0 | 1.0 | 998 | $1,200 | $1.20 | 44d | 1 | 0.86mi |
| 875 Harrison Ave Akron, OH | 3.0 | 1.0 | 1157 | $1,150 | $0.99 | 14d | 1 | 0.90mi |
| 1040 Mercer Ave Akron, OH | 3.0 | 1.0 | 850 | $1,400 | $1.65 | 21d | 1 | 0.91mi |
| 721 Polk Ave Akron, OH | 3.0 | 1.5 | 1500 | $1,600 | $1.07 | 23d | 1 | 1.02mi |
| 1310 Bellevue Ave Unit Right Akron, OH | 2.0 | 1.0 | 800 | $990 | $1.24 | 44d | 1 | 1.03mi |
| 384 W Bartges St Akron, OH | 2.0 | 1.0 | 1024 | $1,100 | $1.07 | 44d | 1 | 1.06mi |
| 773 Montana Ave Akron, OH | 3.0 | 1.5 | 1128 | $1,195 | $1.06 | 23d | 1 | 1.08mi |
| 730 Noble Ave Akron, OH | 3.0 | 1.0 | 1092 | $1,200 | $1.10 | 23d | 1 | 1.08mi |
| 1127 Victory St Unit 1129 Akron, OH | 3.0 | 1.0 | 1368 | $950 | $0.69 | 44d | 1 | 1.10mi |
| 1090 Hartford Ave Akron, OH | 4.0 | 1.0 | 1328 | $1,125 | $0.85 | 44d | 1 | 1.13mi |
| 1328 Thurston St Unit 1328 Akron, OH | 3.0 | 1.0 | 900 | $925 | $1.03 | 23d | 1 | 1.15mi |
| 1326 Thurston St Unit 1326 Akron, OH | 3.0 | 1.0 | 900 | $925 | $1.03 | 23d | 1 | 1.15mi |
| 783 Boulevard St Akron, OH | 4.0 | 1.0 | 1440 | $999 | $0.69 | 23d | 1 | 1.16mi |
| 2139 18th St SW Akron, OH | 2.0 | 1.0 | 992 | $1,100 | $1.11 | 44d | 1 | 1.17mi |
| 1331 Thurston St Unit 1326 Akron, OH | 3.0 | 1.0 | 900 | $925 | $1.03 | 44d | 1 | 1.18mi |
| 2160 12th St SW Akron, OH | 3.0 | 1.0 | 1445 | $1,300 | $0.90 | 44d | 1 | 1.19mi |
| 1339 Thurston St Unit 1339 Akron, OH | 2.0 | 1.0 | 700 | $825 | $1.18 | 44d | 1 | 1.19mi |
| 1335 Thurston St Unit 1335 Akron, OH | 2.0 | 1.0 | 700 | $825 | $1.18 | 14d | 1 | 1.19mi |
| 2163 13th St SW Akron, OH | 3.0 | 2.5 | 1480 | $1,150 | $0.78 | 44d | 1 | 1.19mi |
| 961 Lawton St Akron, OH | 3.0 | 1.0 | 1144 | $1,450 | $1.27 | 14d | 1 | 1.23mi |
| 844 Lawton St Akron, OH | 4.0 | 2.0 | 1240 | $1,175 | $0.95 | 44d | 1 | 1.23mi |
| 835 Kenmore Blvd Unit UP Akron, OH | 2.0 | 1.0 | 872 | $750 | $0.86 | 21d | 1 | 1.25mi |
| 1029 Harpster Ave Akron, OH | 4.0 | 1.0 | 1403 | $1,250 | $0.89 | 14d | 1 | 1.26mi |
| 931 Trimble Dr Akron, OH | 2.0 | 1.5 | 1448 | $1,495 | $1.03 | 23d | 1 | 1.30mi |
| 2211 18th St SW Akron, OH | 3.0 | 1.0 | 1332 | $1,250 | $0.94 | 14d | 1 | 1.30mi |
Listing history 7 events
-
2026-06-18days on market $97,000 Active 8 DOM
-
2026-06-17days on market $97,000 Active 7 DOM
-
2026-06-16days on market $97,000 Active 6 DOM
-
2026-06-15days on market $97,000 Active 5 DOM
-
2026-06-14days on market $97,000 Active 3 DOM
-
2026-06-13remarks 307-char remark
-
2026-06-13$97,000 Active 2 DOM
ⓘ Source: listings_history table (triggers on properties + properties_extension) + one-shot
backfill from property_details.listing_events for pre-trigger history.
Tax reassessment forecast OH · Partial reset (capped growth)
- Current annual tax
- $1,184 · $99/mo
- Projected year-2 tax
- $1,349 · $112/mo
- Expected delta
- +$164/yr (+$14/mo · 13.9%)
ⓘ Screening estimate from a state-policy table — verify with the county assessor before closing.
Climate risk First Street
- Flood 1/10 Low FEMA zone X (unshaded) · 0% chance over 30 yrs
- Wildfire 1/10 Low
- Heat 3/10 Moderate 7 d/yr ≥96°F today · 16 d/yr by 30 yrs out
- Wind 1/10 Low
- Air quality 2/10 Low 1 unhealthy d/yr today · 2 by 30 yrs out
Nearby sold comps map
Loading sold comps map…
Walkable amenities ~0.75 mi
Loading nearby amenities…
Taxation est. · year 1
- Rental income
- $14,299
- − Mortgage interest
- −$5,434
- − Property taxes
- −$1,184
- − Insurance
- −$485
- − Repairs & maintenance
- −$1,144
- − Management
- −$1,144
- − Depreciation
- −$2,822
- Taxable income
- $2,086
- Est. tax owed @ 24.0%
- −$501
- After-tax cash flow
- $3,022/yr
For passive investors: Depreciation is non-cash, so a rental often shows a tax loss while cash-flowing — sheltering income. Rental losses are passive: they offset passive income freely, and up to $25,000/yr can offset ordinary (W-2) income if you actively participate and your MAGI is under $100k (phasing out to $0 by $150k); unused losses carry forward. On sale, claimed depreciation is recaptured at up to 25%, and gains may owe capital-gains tax (a 1031 exchange can defer both). Figures are a year-1 estimate at your 24.0% rate — not tax advice; consult a CPA.
Schools (NCES district)
- District
- Akron City
- NCES district ID
- 3904348
- Math proficiency
- 22% ▼ -17.00%
- Reading proficiency
- 30% ▼ -12.00%
- Median HH income
- $33,811
- Composite
- 21.31/100
- National rank
- #8383
- State rank
- #602 of 656 in OH
Livability — Akron
- Score
- 81/100
- State rank
- #104
- US rank
- #1591
Category grades
Schools grade is shown separately in the Schools card above.
Census & demographics
- Census place
- Akron, OH
- County
- Summit County · 440,783 people
- City population
- 174,375
- Metro
- Akron, OH
- Population (ZIP)
- 6,653
- Household income
- $27,697
- Rent vs Own
- Severe rent burden
- 787.0
Population outlook (Summit County) Hauer SSP2
- Today (2025)
- 546,583 people
- By 2030
- 544,028 · -0.5%
- By 2040
- 531,363 · -2.8%
- By 2050
- 514,923 · -5.8%
- By 2075
- 481,765 · -11.9%
- By 2100
- 432,265 · -20.9%
Race, ethnicity, and origin ACS 2023
- Neighborhood character
- Predominantly Black (73%)
- Race & ethnicity
- Black 73% White 17% Two or more races 5% Hispanic / Latino 5%
- Common ancestry
- Slovak 1% Romanian 1% Iranian 1%
- Foreign-born
- 2% · Canada
- Languages at home
- 98% English-only · Spanish 2% French/Haitian/Cajun 1%
Political lean MEDSL · Summit
- 2024 margin
- Lean D (+7.0) · D 53.0% · R 46.0%
- 2008→2024 swing
- -9.6pp toward R · 2008: 16.6pp · 2024: 7.0pp
- All cycles
- 2024: D+7.0 2020: D+9.6 2016: D+8.2 2012: D+14.8 2008: D+16.6
Not yet ingested
- Civics
- —
Market trends
- HPI YoY
- ▼ -0.20%
- Current HPI
- 81.3728
- Rent YoY
- —
- Metro
- Akron, OH
- State GDP YoY
- ▲ 1.98%
- F500 in state
- 48
Industry mix (Fortune 500 HQ in OH)
| Industry | F500 HQs | Revenue |
|---|---|---|
| Insurance | 3 | $145B |
|
||
| Industrial Machinery | 3 | $49B |
|
||
| Financial Services | 3 | $24B |
|
||
| Consumer Goods | 2 | $93B |
|
||
| Aerospace / Defense | 2 | $47B |
|
||
| Utilities | 2 | $33B |
|
||
Price history
+304.2% since first listed2 events — show timeline
- 2026-06-10 Listed $97,000 MLSNOW
- 1985-11-07 Sold (Public Records) $24,000 Public Records
Property tax history
+1.7%/yrLatest (2025): $1,184 · +9.5% YoY. Source: county tax records.
Cash-flow waterfall
monthlySold comps — $/sqft
last 12 mo · ≤1 miLoading sold comps…