11 Muleshoe Trl #253 · Lely Resort, FL
Flood risk 9/10 · Severe
- FEMA flood zone
- AE
- Chance of flooding over 30 yrs
- 0.99%
- Est. flood insurance / yr
- $1,737 – $8,500
Fire risk 4/10 · Minor
- Est. fire insurance / yr
- $947 – $1,759
Heat risk 10/10 · Severe
- Hot days now (above 108°F)
- 7 days/yr
- Hot days in 30 yrs
- 29 days/yr
Wind risk 10/10 · Severe
- Chance of severe wind over 30 yrs
- 99.0%
Air-quality risk 2/10 · Minimal
- Unhealthy air days now
- 2 days/yr
- Unhealthy air days in 30 yrs
- 2 days/yr
Risk factors via First Street. Map © Google.
Why this score? — see what drove the B grade
The composite is a weighted blend of 9 inputs, each scored 0–100. Each bar is that input's sub-score; the figure is the points it added to the 100-point composite (weight × sub-score).
- Cash flow +30.0/30.0
- 1% rule +10.0/10.0
- DSCR +10.0/10.0
- ARV discount +7.5/15.0
- Schools +5.0/10.0
- Rent growth +3.9/5.0
- Livability +3.1/5.0
- Condition / age +2.5/5.0
- Appreciation +0.0/10.0
$140,000
🖨 Deal sheet (PDF) 📄 Offer letter ✓ Due diligence
Listing remarks
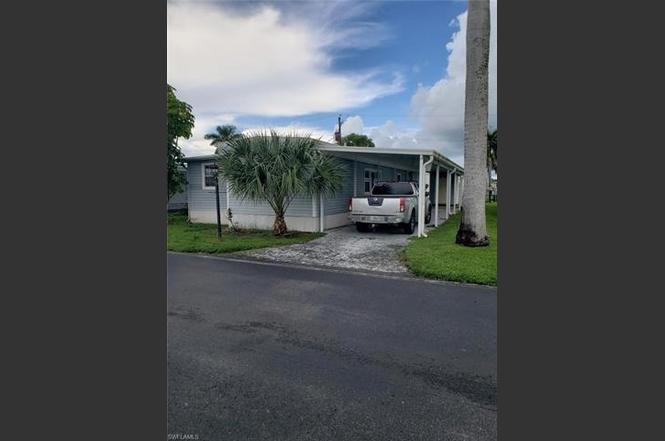
Discover the charm of this well-maintained mobile home located at 11 Muleshoe Trail in Naples, FL. This property offers a spacious layout with 3 bedrooms and 2 bathrooms, providing ample living space. The open-concept design features a bright living area and a fully equipped kitchen. Enjoy outdoor living with a private deck and beautifully landscaped surroundings. Conveniently situated near local amenities and attractions, this home delivers comfort and accessibility in a peaceful setting.
Key facts
- Open-concept design
- Private deck
- Peaceful setting
Tags
Property features AI
Finance
- Other: Complex contains 1 unit; building has 1 unit and 1 floor; Lot described as 3 lots (lot unit 253); total area 732; Partial buildings view; Property measures source: Property Appraiser Office
- HOA & community: Mandatory HOA with on-site management; Monthly HOA fee of $84 (annual recurring fees $1,008); Community amenities include community room, dog park, internet access, and sidewalks; HOA covers lawn/land maintenance, pest control (exterior), sewer, street lights, street maintenance, trash removal, water, recreation facilities, reserves, and manager
Exterior
- Parking: Attached 2-car carport
- Utilities: Central water; Central sewer; Cable available
- Home design: Manufactured residential home; 1 story (ranch); Rear exposure faces south; Located in Hitching Post Mobile Home Park
- Construction: Manufactured construction; Shingle roof; Built in 1973
- Exterior features: Storage; Casement windows; Vinyl siding
Interior
- Kitchen: Electric cooktop; Range; Self-cleaning oven; Refrigerator/freezer
- Bedrooms: 2 bedrooms
- Flooring: Laminate flooring; Terrazzo flooring
- Bathrooms: 2 full bathrooms; Master bath with multiple shower heads
- Heating & cooling: Central electric heat; Central electric cooling; Ceiling fans
- Interior features: Built-in cabinets; Closet cabinets; Dining area in living room; Eat-in kitchen; Florida room; Open porch/lanai; Courtyard floor plan
- Laundry & utility: Washer included
Neighborhood map
What this means for you Summary
Snapshot
- This is a 2-bed/2.0-bath manufactured listed at $140k.
Deal economics
- At list price, monthly cash flow is $1k ($13k/yr) — positive.
- The deal already cash-flows at list — no discount required.
- Meets the 1% rule at list price ($3k rent vs $140k).
- Recommended offer: $123k (12.0% below list) — sets the bar for market timing.
Location & tenants
- Location reads 61/100 on livability (#786 in FL) — a middle-class / working-renter tenant base. Strengths: crime A+, employment A-; Watch: health & safety D, schools F, amenities F.
- Collier (suburban): math 60% / reading 56% proficiency, ranked #16 of 73 in FL (top 22%) — acceptable for families but not a draw, mixed tenant base, ~2y average lease.
- Market conditions: Rents rising fast (+5.6%/yr); 598 active listings in the ZIP; 2 comparable units currently listed for rent nearby; solid renter incomes; 3,520 units permitted in Collier County in 2024 (959 in 5+ unit buildings).
- At $3,163/mo this rent would consume 46% of the median local household income ($82k/yr) (locally 954% of renters already pay >50% of income on rent) — very limited rent-growth headroom before tenants either downsize or default.
Forward outlook
- Local home prices are declining (-3.0%/yr); year-one equity from $968 of loan paydown is wiped out by about $4k of value loss. Plan a longer hold.
- Collier County population projected at +30% by 2050 — long-run rental-demand tailwind backs the buy-and-hold thesis.
- At projected returns (-3.0% appreciation + 5.6% rent growth), your $39k cash investment doubles in ~4 years — after that, you're playing with house money.
Negotiation context
- It's been on market 253 days — a 12% lower offer ($123k) is reasonable based on typical stale-listing flexibility.
- Current owner paid $60k; list at $140k implies a 133% gain — meaningful room to come down on a strong offer.
Risks & watch-outs
- Watch-outs: flood insurance adds $427/mo.
- Climate carrying-cost: in FEMA flood zone AE (mandatory federal flood insurance); severe wind risk, 99% chance of damaging wind over 30y; extreme-heat days projected 7→29/yr by 2055 (HVAC capex compounding) — expect insurance premiums to compound above CPI over the hold.
Questions for the listing agent
- It's been on market 253 days. Have you received any prior offers? Is the seller open to a 12% concession, seller financing, or rate buy-down credit?
- Built in 1973 — when were the roof, HVAC, electrical panel, plumbing, and water heater last replaced?
- What's the actual annual flood-insurance premium (NFIP or private), and is the property in a SFHA with mandatory coverage?
- What does the HOA fee cover, when was the last increase, and are there any pending special assessments or reserve-fund shortfalls?
- Why hasn't it sold? Are there any deal-killer items the seller is aware of (foundation, flood, title, zoning, code violations)?
- Is there a deadline driving the sale (1031 exchange, divorce, estate, relocation)? That informs how much negotiation room exists.
- Schools are F-rated, which usually means shorter tenancies and higher turnover. Who's the typical renter profile here, and what's been the actual vacancy rate?
- What's the average days-on-market for RENTAL listings here right now (not sales)? A rising rental-DOM trend means longer vacancies and softer asking-rent achievability than the comps imply.
- What's the recent tenant-quality profile in this submarket — average credit score on applications, eviction rate, late-payment / NSF rate, and stable-employment percentage? A property-management company in the area should have these aggregated.
- How much new for-sale + rental construction is in the pipeline within 1–3 miles? Heavy new supply typically softens prices + rents 12–24 months out; constrained supply supports both.
Investment metrics
- 1% rule
- 2.26% ✓
- Cap rate
- 19.25%
- Cash-on-cash
- 46.27%
- DSCR
- 3.06
- GRM
- 3.7
CMA / ARV
No comps found within radius.
Projected returns pro-forma
-3.0% appreciation · 5.59% rent growth · sell at horizon
- IRR
- 32.1%
- Equity multiple
- 2.41×
- Total profit
- $55,188
- Equity at exit
- $20,874
- IRR
- 40.9%
- Equity multiple
- 5.46×
- Total profit
- $174,930
- Equity at exit
- $12,105
Cash invested: $39,200 (down + closing). Projections, not guarantees.
Landlord ↔ Tenant lean methodology
- Overall (STATE)
- 87 Strongly Landlord-Friendly
- State Florida
- 87 Strongly Landlord-Friendly · R+3
- County
- — inherits STATE
- City
- — inherits STATE
ZIP-level market 34113
- Rents YoY
- 5.6%
- Active inventory
- 598
- Price-to-rent
- 3.7×
Monthly cashflow live
- Estimated rent
- $3,163 medium interval (Pro) →
- Mortgage (P&I)
- −$734
- Tax from tax record
- −$111 /mo · $1,332/yr
- Insurance
- −$58
- Flood insurance flood zone
- −$427 /mo · $5,118/yr
- HOA
- −$84
- Vacancy / Maint / Mgmt
- −$664
- Net cashflow
- $1,085
Break-even live
Sensitivity live
| Price | -10% $1,164 | -5% $1,124 | +0% $1,085 | +5% $1,045 | +10% $1,006 |
|---|---|---|---|---|---|
| Rent | -10% $835 | -5% $960 | +0% $1,085 | +5% $1,210 | +10% $1,335 |
| Rate | -1.0pp $1,155 | -0.5pp $1,120 | base $1,085 | +0.5pp $1,049 | +1.0pp $1,012 |
UW: 25.0% down · 7.5% · 30yr · 1.5% tax · 5.0% vac · 8.0% maint · 8.0% mgmt
Financing live
Cash to close
- Down payment
- $35,000
- Closing costs
- $4,200
- Reserves months
- —
- Total cash needed
- —
Loan-product check · same deal, 3 products live
Conventional
25% down · 7.5% · 30yr
- Down + closing
- —
- Monthly P&I
- —
- Monthly cashflow
- —
- DSCR
- —
- Eligible?
- —
Personal DTI + credit; lowest rate.
DSCR
20% down · 8.5% · 30yr
- Down + closing
- —
- Monthly P&I
- —
- Monthly cashflow
- —
- DSCR
- —
- Eligible?
- —
No personal income docs; deal must DSCR.
Hard money
10% down · 12.0% · 12mo
- Down + closing
- —
- Monthly P&I
- —
- Monthly cashflow
- —
- DSCR
- —
- Eligible?
- —
Short-term bridge; refi at stabilization.
Rent comps 2 comps
| Address | Beds | Baths | Sqft | Rent | $/sqft | DOM | Units | Dist |
|---|---|---|---|---|---|---|---|---|
| 5222 Treetops Dr Naples, FL | 1.0 | 1.0 | 600 | $1,800 | $3.00 | 24d | 1 | 0.90mi |
| 5314 Gilchrist St Naples, FL | 2.0 | 1.0 | 636 | $2,000 | $3.14 | 15d | 1 | 1.14mi |
HOA detail
- Monthly dues
- $84 · $1,008/yr
Listing history 17 events
-
2026-06-18days on market $140,000 Active 253 DOM
-
2026-06-17days on market $140,000 Active 252 DOM
-
2026-06-16days on market $140,000 Active 251 DOM
-
2026-06-15days on market $140,000 Active 250 DOM
-
2026-06-10days on market $140,000 Active 245 DOM
-
2026-06-09days on market $140,000 Active 244 DOM
-
2026-06-08days on market $140,000 Active 243 DOM
-
2026-06-07days on market $140,000 Active 242 DOM
-
2026-06-03days on market $140,000 Active 238 DOM
-
2026-06-02days on market $140,000 Active 237 DOM
-
2026-06-01days on market $140,000 Active 236 DOM
-
2026-05-31days on market $140,000 Active 235 DOM
-
2026-05-30days on market $140,000 Active 234 DOM
-
2025-11-06price $140,000
-
2025-10-08$150,000 Active
-
2024-08-27soldstatus $60,000
-
2002-03-01soldstatus $25,000
ⓘ Source: listings_history table (triggers on properties + properties_extension) + one-shot
backfill from property_details.listing_events for pre-trigger history.
Tax reassessment forecast FL · Resets to sale price
- Current annual tax
- $1,332 · $111/mo
- Projected year-2 tax
- $1,332 · $111/mo
- Expected delta
- $0/yr ($0/mo · 0.0%)
ⓘ Screening estimate from a state-policy table — verify with the county assessor before closing.
Climate risk First Street
- Flood 9/10 Extreme FEMA zone AE · 99% chance over 30 yrs
- Wildfire 4/10 Moderate
- Heat 10/10 Extreme 7 d/yr ≥108°F today · 29 d/yr by 30 yrs out
- Wind 10/10 Extreme 99% chance of damaging wind over 30 yrs
- Air quality 2/10 Low 2 unhealthy d/yr today · 2 by 30 yrs out
Nearby sold comps map
Loading sold comps map…
Walkable amenities ~0.75 mi
Loading nearby amenities…
Taxation est. · year 1
- Rental income
- $37,958
- − Mortgage interest
- −$7,842
- − Property taxes
- −$1,332
- − Insurance
- −$5,818
- − Repairs & maintenance
- −$3,037
- − Management
- −$3,037
- − HOA
- −$1,008
- − Depreciation
- −$4,073
- Taxable income
- $11,811
- Est. tax owed @ 24.0%
- −$2,835
- After-tax cash flow
- $10,184/yr
For passive investors: Depreciation is non-cash, so a rental often shows a tax loss while cash-flowing — sheltering income. Rental losses are passive: they offset passive income freely, and up to $25,000/yr can offset ordinary (W-2) income if you actively participate and your MAGI is under $100k (phasing out to $0 by $150k); unused losses carry forward. On sale, claimed depreciation is recaptured at up to 25%, and gains may owe capital-gains tax (a 1031 exchange can defer both). Figures are a year-1 estimate at your 24.0% rate — not tax advice; consult a CPA.
Schools (NCES district)
- District
- Collier
- NCES district ID
- 1200330
- Math proficiency
- 60% ▼ -4.00%
- Reading proficiency
- 56% ▼ -2.00%
- Median HH income
- $58,275
- Composite
- 50.23/100
- National rank
- #1892
- State rank
- #16 of 73 in FL
Livability — Lely Resort
- Score
- 61/100
- State rank
- #786
- US rank
- #17981
Category grades
Schools grade is shown separately in the Schools card above.
Census & demographics
- County
- Collier County · 396,295 people
- Metro
- Naples-Marco Island, FL
- Population (ZIP)
- 26,056
- Household income
- $81,674
- Rent vs Own
- Severe rent burden
- 954.0
Population outlook (Collier County) Hauer SSP2
- Today (2025)
- 420,858 people
- By 2030
- 450,054 · +6.9%
- By 2040
- 502,232 · +19.3%
- By 2050
- 544,932 · +29.5%
- By 2075
- 627,203 · +49.0%
- By 2100
- 659,015 · +56.6%
Race, ethnicity, and origin ACS 2023
- Neighborhood character
- Diverse neighborhood (Simpson 0.59)
- Race & ethnicity
- White 56% Hispanic / Latino 28% Black 12% Two or more races 11% Asian 2%
- Hispanic origin (detail)
- Mexican 17% Puerto Rican 3% Cuban 2%
- Common ancestry
- Hispanic 10% Romanian 3% Lithuanian 2%
- Foreign-born
- 26% · Canada, Jamaica, Vietnam
- Languages at home
- 63% English-only · Spanish 24% French/Haitian/Cajun 9% Other Indo-European 2%
Political lean MEDSL · Collier
- 2024 margin
- Solid R (+33.1) · D 33.1% · R 66.2%
- 2008→2024 swing
- -10.6pp toward R · 2008: -22.5pp · 2024: -33.1pp
- All cycles
- 2024: R+33.1 2020: R+24.7 2016: R+26.0 2012: R+30.1 2008: R+22.5
Not yet ingested
- Civics
- —
Market trends
- HPI YoY
- ▼ -194.86%
- Current HPI
- 279.4232
- Rent YoY
- ▲ 5.59%
- Metro
- Naples-Marco Island, FL
- State GDP YoY
- ▲ 3.28%
- F500 in state
- 36
Industry mix (Fortune 500 HQ in FL)
| Industry | F500 HQs | Revenue |
|---|---|---|
| Industrial Technology | 2 | $29B |
|
||
| Insurance | 2 | $17B |
|
||
| Retail | 1 | $60B |
|
||
| Technology Distribution | 1 | $58B |
|
||
| Homebuilding | 1 | $35B |
|
||
| Technology Manufacturing | 1 | $35B |
|
||
Price history
+460.0% since first listed4 events — show timeline
- 2025-11-06 Price Changed $140,000 NAPLESMLS
- 2025-10-08 Listed $150,000 NAPLESMLS
- 2024-08-27 Sold (Public Records) $60,000 Public Records
- 2002-03-01 Sold (Public Records) $25,000 Public Records
Property tax history
+21.8%/yrLatest (2025): $1,332 · +186.1% YoY. Source: county tax records.
Cash-flow waterfall
monthlySold comps — $/sqft
last 12 mo · ≤1 miLoading sold comps…