 Fourplex
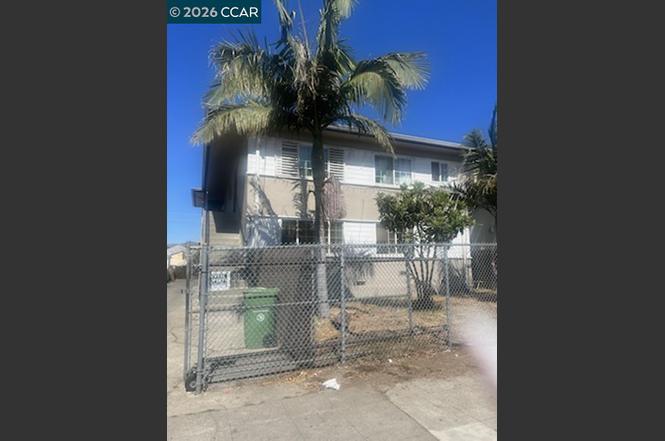
1517 51st Ave · Oakland, CA
Flood risk 1/10 · Minimal
- FEMA flood zone
- X (unshaded)
- Chance of flooding over 30 yrs
- 0.0%
- Est. flood insurance / yr
- $507 – $1,088
Fire risk 1/10 · Minimal
- Est. fire insurance / yr
- $659 – $1,223
Heat risk 4/10 · Minor
- Hot days now (above 83°F)
- 7 days/yr
- Hot days in 30 yrs
- 15 days/yr
Wind risk 1/10 · Minimal
- Chance of severe wind over 30 yrs
- —
Air-quality risk 8/10 · Major
- Unhealthy air days now
- 14 days/yr
- Unhealthy air days in 30 yrs
- 14 days/yr
Risk factors via First Street. Map © Google.
Why this score? — see what drove the F grade
The composite is a weighted blend of 9 inputs, each scored 0–100. Each bar is that input's sub-score; the figure is the points it added to the 100-point composite (weight × sub-score).
- Cash flow +12.1/30.0
- 1% rule +5.1/10.0
- DSCR +3.6/10.0
- Livability +3.6/5.0
- Rent growth +3.5/5.0
- Schools +3.0/10.0
- Condition / age +2.5/5.0
- ARV discount +1.1/15.0
- Appreciation +0.0/10.0
$899,999
🖨 Deal sheet (PDF) 📄 Offer letter ✓ Due diligence
Multi-family units
County records classify this as Multi-Family (2-4 Unit). Listing-text estimate: 4 units. confirmed
Listing remarks MLS
EXCELLENT INVESTMENT OPPORTUNITY, NEWLY PAINTED LOVELY 4-PLEX, 8 BEDROOMS AND 4 BATHS CONTAINS 3232 SQ FT AND WAS BUILT IN 1960 , WITH A 5170 SQ FT LOT SIZE, FOUR CARPORT PARKING SPACE IN THE BACK. SHARED DRIVEWAY. DO NOT DISTURB TENANTS, SUBJECT TO TENANT RIGHTS. NO LOCBOX. SALE AS IS. WRITE OFFER SUBJECT TO INSPECTION.
Key facts
- 5,170 sq ft lot
- Built 1960
- Listed 18 days
Neighborhood map
What this means for you Summary
Snapshot
- This is a 4 × 2-bed/1.0-bath units multifamily listed at $900k.
Deal economics
- At list price, monthly cash flow is $-197 ($-2k/yr) — negative. Per door: $-49/mo.
- To cash-flow at today's rent, offer at most $865k (3.9% below list).
- Meets the 1% rule at list price ($9k rent vs $900k).
- Recommended offer: $865k (3.9% below list) — sets the bar for cash-flow.
- Cap rate 6.0% vs local median 2.5% in Oakland — top-decile yield for the area; either an underpriced asset or a hidden risk that comps aren't pricing in. Stress-test before assuming the spread holds.
Location & tenants
- Location reads 71/100 on livability (#224 in CA) — a middle-class / working-renter tenant base. Strengths: amenities A+, commute A+, employment A+; Watch: schools C-, crime F, cost of living F.
- Oakland Unified (urban): math 27% / reading 33% proficiency, ranked #1,007 of 1,400 in CA (top 72%) — families likely to look elsewhere, expect single-tenant / working-renter base with shorter leases; 68% free/reduced lunch — lower-income household profile, screen leases tightly.
- Market conditions: Rents rising (+3.9%/yr); 118 active listings in the ZIP; 1,742 units permitted in Alameda County in 2024 (856 in 5+ unit buildings).
- At $9,054/mo this rent would consume 150% of the median local household income ($72k/yr) (locally 3603% of renters already pay >50% of income on rent) — very limited rent-growth headroom before tenants either downsize or default.
Forward outlook
- Local home prices are declining (-3.0%/yr); year-one equity from $6k of loan paydown is wiped out by about $27k of value loss. Plan a longer hold.
- Alameda County population projected at +34% by 2050 — long-run rental-demand tailwind backs the buy-and-hold thesis.
Negotiation context
- It's been on market 18 days — a 2% lower offer ($886k) is reasonable based on typical stale-listing flexibility.
- 4 sale attempts since 7y ago with the ask held roughly flat each time — persistent listings suggest the price (not the market) is what's stuck; bring a comps-based counter.
Risks & watch-outs
- Watch-outs: property tax is 3.0% of price.
Questions for the listing agent
- What do current leases actually rent for vs. the listed asking? Can we see a recent rent roll and the last 12 months of T-12 income?
- Can we see the unit-by-unit rent roll, current vacancy, and any below-market leases? What's the average tenancy length?
- What capital expenditures (roof, boiler, parking lot, exteriors) have been made in the last 5 years, and what's planned in the next 2?
- Built in 1960 — when were the roof, HVAC, electrical panel, plumbing, and water heater last replaced?
- Property tax is high relative to price — has the assessment been appealed recently, and will the sale trigger a re-assessment?
- Is there a deadline driving the sale (1031 exchange, divorce, estate, relocation)? That informs how much negotiation room exists.
- Crime grade is F in this area — have there been break-ins, vandalism, or insurance claims at this property in the last 3 years? What carrier currently insures it and at what premium?
- The area grade is low — what's the realistic commute time and amenity access for the typical tenant pool here? Any planned neighborhood developments (good or bad) we should know about?
- What's the average days-on-market for RENTAL listings here right now (not sales)? A rising rental-DOM trend means longer vacancies and softer asking-rent achievability than the comps imply.
- What's the recent tenant-quality profile in this submarket — average credit score on applications, eviction rate, late-payment / NSF rate, and stable-employment percentage? A property-management company in the area should have these aggregated.
- How much new apartment / multifamily construction is in the pipeline within 1–3 miles? Heavy new supply (>2% of stock underway) typically softens rents 12–24 months out; light construction supports rent growth.
Investment metrics
- 1% rule
- 1.01% ✓
- Cap rate
- 6.03%
- Cash-on-cash
- -0.94%
- DSCR
- 0.96
- GRM
- 8.3
CMA / ARV
- ARV (on-the-fly)
- $788,608
- Comps found
- 3
Show comp detail 3 sales within ~0.75 mi
| Address | Dist | Beds/Ba | Sqft | Sold | Price | $/sf | Match |
|---|---|---|---|---|---|---|---|
| 5108 Fairfax Ave | 0.51mi | 7/4.0 (-1) | 2,760 (-15%) | 14mo | $1,131,000 | $410 | 35 |
| 5921 Harmon | 0.70mi | 8/4.0 | 2,903 (-10%) | 22mo | $650,000 | $224 | 32 |
| 1806 41st Ave | 0.54mi | 8/6.0 | 3,692 (+14%) | 13mo | $900,000 | $244 | 32 |
Match score weights: distance 35% · size 25% · config 20% · recency 20%. Top-matched comps best support the ARV.
Projected returns pro-forma
-3.0% appreciation · 3.89% rent growth · sell at horizon
- IRR
- -16.6%
- Equity multiple
- 0.41×
- Total profit
- $-149,364
- Equity at exit
- $134,193
- IRR
- -6.4%
- Equity multiple
- 0.57×
- Total profit
- $-108,652
- Equity at exit
- $77,815
Cash invested: $252,000 (down + closing). Projections, not guarantees.
Landlord ↔ Tenant lean methodology
- Overall (CITY)
- 0 Strongly Tenant-Friendly
- State California
- 18 Strongly Tenant-Friendly · D+13
- County
- — inherits STATE
- City Oakland
- 0 Strongly Tenant-Friendly · D+62
ZIP-level market 94601
- Rents YoY
- 3.9%
- Active inventory
- 118
- Price-to-rent
- 33.1×
Monthly cashflow live
- Estimated rent
- $9,054 high interval (Pro) →
- Mortgage (P&I)
- −$4,720
- Tax from tax record
- −$2,255 /mo · $27,057/yr
- Insurance
- −$375
- HOA
- −$0
- Vacancy / Maint / Mgmt
- −$1,901
- Net cashflow
- $-197
Break-even live
Sensitivity live
| Price | -10% $313 | -5% $58 | +0% $-197 | +5% $-452 | +10% $-706 |
|---|---|---|---|---|---|
| Rent | -10% $-912 | -5% $-554 | +0% $-197 | +5% $161 | +10% $518 |
| Rate | -1.0pp $256 | -0.5pp $32 | base $-197 | +0.5pp $-430 | +1.0pp $-667 |
4-unit breakdown (identical units grouped — click to expand)
| Units | Beds | Baths | Est. rent |
|---|---|---|---|
| 4× units | 2 | 1 | $9,052 |
| #1 | 2 | 1 | $2,263 |
| #2 | 2 | 1 | $2,263 |
| #3 | 2 | 1 | $2,263 |
| #4 | 2 | 1 | $2,263 |
| Total (4 units) | $9,054 | ||
UW: 25.0% down · 7.5% · 30yr · 1.5% tax · 5.0% vac · 8.0% maint · 8.0% mgmt
Financing live
Cash to close
- Down payment
- $225,000
- Closing costs
- $27,000
- Reserves months
- —
- Total cash needed
- —
Loan-product check · same deal, 3 products live
Conventional
25% down · 7.5% · 30yr
- Down + closing
- —
- Monthly P&I
- —
- Monthly cashflow
- —
- DSCR
- —
- Eligible?
- —
Personal DTI + credit; lowest rate.
DSCR
20% down · 8.5% · 30yr
- Down + closing
- —
- Monthly P&I
- —
- Monthly cashflow
- —
- DSCR
- —
- Eligible?
- —
No personal income docs; deal must DSCR.
Hard money
10% down · 12.0% · 12mo
- Down + closing
- —
- Monthly P&I
- —
- Monthly cashflow
- —
- DSCR
- —
- Eligible?
- —
Short-term bridge; refi at stabilization.
Listing history 18 events
-
2026-02-23status Pending
-
2026-02-06$899,999 Active
-
2025-04-05historical
-
2025-02-27price
-
2025-01-17price
-
2025-01-17price
-
2024-08-28Active
-
2021-07-22status Pending 322-char remark
Show marketing remark (322 chars)
EXCELLENT INVESTMENT OPPORTUNITY, NEWLY PAINTED LOVELY 4-PLEX, 8 BEDROOMS AND 4 BATHS CONTAINS 3232 SQ FT AND WAS BUILT IN 1960 , WITH A 5170 SQ FT LOT SIZE, FOUR CARPORT PARKING SPACE IN THE BACK. SHARED DRIVEWAY. DO NOT DISTURB TENANTS, SUBJECT TO TENANT RIGHTS. NO LOCBOX. SALE AS IS. WRITE OFFER SUBJECT TO INSPECTION.
-
2021-07-22soldstatus $900,000 Sold 322-char remark
Show marketing remark (322 chars)
EXCELLENT INVESTMENT OPPORTUNITY, NEWLY PAINTED LOVELY 4-PLEX, 8 BEDROOMS AND 4 BATHS CONTAINS 3232 SQ FT AND WAS BUILT IN 1960 , WITH A 5170 SQ FT LOT SIZE, FOUR CARPORT PARKING SPACE IN THE BACK. SHARED DRIVEWAY. DO NOT DISTURB TENANTS, SUBJECT TO TENANT RIGHTS. NO LOCBOX. SALE AS IS. WRITE OFFER SUBJECT TO INSPECTION.
-
2021-07-22soldstatus $900,000
Show marketing remark (322 chars)
EXCELLENT INVESTMENT OPPORTUNITY, NEWLY PAINTED LOVELY 4-PLEX, 8 BEDROOMS AND 4 BATHS CONTAINS 3232 SQ FT AND WAS BUILT IN 1960 , WITH A 5170 SQ FT LOT SIZE, FOUR CARPORT PARKING SPACE IN THE BACK. SHARED DRIVEWAY. DO NOT DISTURB TENANTS, SUBJECT TO TENANT RIGHTS. NO LOCBOX. SALE AS IS. WRITE OFFER SUBJECT TO INSPECTION.
-
2021-07-12historical 322-char remark
Show marketing remark (322 chars)
EXCELLENT INVESTMENT OPPORTUNITY, NEWLY PAINTED LOVELY 4-PLEX, 8 BEDROOMS AND 4 BATHS CONTAINS 3232 SQ FT AND WAS BUILT IN 1960 , WITH A 5170 SQ FT LOT SIZE, FOUR CARPORT PARKING SPACE IN THE BACK. SHARED DRIVEWAY. DO NOT DISTURB TENANTS, SUBJECT TO TENANT RIGHTS. NO LOCBOX. SALE AS IS. WRITE OFFER SUBJECT TO INSPECTION.
-
2021-04-09status Pending 322-char remark
Show marketing remark (322 chars)
EXCELLENT INVESTMENT OPPORTUNITY, NEWLY PAINTED LOVELY 4-PLEX, 8 BEDROOMS AND 4 BATHS CONTAINS 3232 SQ FT AND WAS BUILT IN 1960 , WITH A 5170 SQ FT LOT SIZE, FOUR CARPORT PARKING SPACE IN THE BACK. SHARED DRIVEWAY. DO NOT DISTURB TENANTS, SUBJECT TO TENANT RIGHTS. NO LOCBOX. SALE AS IS. WRITE OFFER SUBJECT TO INSPECTION.
-
2021-02-17$790,900 New 322-char remark
Show marketing remark (322 chars)
EXCELLENT INVESTMENT OPPORTUNITY, NEWLY PAINTED LOVELY 4-PLEX, 8 BEDROOMS AND 4 BATHS CONTAINS 3232 SQ FT AND WAS BUILT IN 1960 , WITH A 5170 SQ FT LOT SIZE, FOUR CARPORT PARKING SPACE IN THE BACK. SHARED DRIVEWAY. DO NOT DISTURB TENANTS, SUBJECT TO TENANT RIGHTS. NO LOCBOX. SALE AS IS. WRITE OFFER SUBJECT TO INSPECTION.
-
2019-09-30soldstatus $625,000 Sold
-
2019-09-30soldstatus $625,000
-
2019-08-14status Pending
-
2019-08-08$699,000 New
-
1986-01-30soldstatus $120,000
ⓘ Source: listings_history table (triggers on properties + properties_extension) + one-shot
backfill from property_details.listing_events for pre-trigger history.
Tax reassessment forecast CA · Resets to sale price
- Current annual tax
- $27,057 · $2,255/mo
- Projected year-2 tax
- $27,057 · $2,255/mo
- Expected delta
- $0/yr ($0/mo · 0.0%)
ⓘ Screening estimate from a state-policy table — verify with the county assessor before closing.
Climate risk First Street
- Flood 1/10 Low FEMA zone X (unshaded) · 0% chance over 30 yrs
- Wildfire 1/10 Low
- Heat 4/10 Moderate 7 d/yr ≥83°F today · 15 d/yr by 30 yrs out
- Wind 1/10 Low
- Air quality 8/10 Severe 14 unhealthy d/yr today · 14 by 30 yrs out
Nearby sold comps map
Loading sold comps map…
Walkable amenities ~0.75 mi
Loading nearby amenities…
Taxation est. · year 1
- Rental income
- $108,648
- − Mortgage interest
- −$50,414
- − Property taxes
- −$27,057
- − Insurance
- −$4,500
- − Repairs & maintenance
- −$8,692
- − Management
- −$8,692
- − Depreciation
- −$26,182
- Taxable loss
- −$16,889
- Est. tax savings @ 24.0%
- +$4,053
- After-tax cash flow
- $1,692/yr
For passive investors: Depreciation is non-cash, so a rental often shows a tax loss while cash-flowing — sheltering income. Rental losses are passive: they offset passive income freely, and up to $25,000/yr can offset ordinary (W-2) income if you actively participate and your MAGI is under $100k (phasing out to $0 by $150k); unused losses carry forward. On sale, claimed depreciation is recaptured at up to 25%, and gains may owe capital-gains tax (a 1031 exchange can defer both). Figures are a year-1 estimate at your 24.0% rate — not tax advice; consult a CPA.
Schools (NCES district)
- District
- Oakland Unified
- NCES district ID
- 0628050
- Math proficiency
- 27% ▬ 0.00%
- Reading proficiency
- 33% ▬ 0.00%
- Median HH income
- $55,194
- Composite
- 29.52/100
- National rank
- #11769
- State rank
- #1007 of 1400 in CA
Livability — Oakland
- Score
- 71/100
- State rank
- #224
- US rank
- #7245
Category grades
Schools grade is shown separately in the Schools card above.
Census & demographics
- Census place
- Oakland, CA
- County
- Alameda County · 1,614,355 people
- City population
- 385,993
- Metro
- San Francisco-Oakland-Berkeley, CA
- Population (ZIP)
- 53,259
- Household income
- $72,359
- Rent vs Own
- Severe rent burden
- 3603.0
Population outlook (Alameda County) Hauer SSP2
- Today (2025)
- 1,928,884 people
- By 2030
- 2,069,146 · +7.3%
- By 2040
- 2,338,405 · +21.2%
- By 2050
- 2,586,608 · +34.1%
- By 2075
- 3,061,911 · +58.7%
- By 2100
- 3,234,133 · +67.7%
Race, ethnicity, and origin ACS 2023
- Neighborhood character
- Diverse neighborhood (Simpson 0.66)
- Race & ethnicity
- Hispanic / Latino 53% Asian 18% Black 13% White 11% Two or more races 10% Native American 3%
- Hispanic origin (detail)
- Mexican 35%
- Common ancestry
- Italian 1% Scotch-Irish 1%
- Foreign-born
- 40% · Canada, Vietnam, China
- Languages at home
- 35% English-only · Spanish 46% Chinese 5% Vietnamese 4%
Political lean MEDSL · Alameda
- 2024 margin
- Solid D (+53.6) · D 74.6% · R 21.0% · Other 4.4%
- 2008→2024 swing
- -5.9pp toward R · 2008: 59.5pp · 2024: 53.6pp
- All cycles
- 2024: D+53.6 2020: D+62.5 2016: D+64.4 2012: D+59.8 2008: D+59.5
Not yet ingested
- Civics
- —
Market trends
- HPI YoY
- ▼ -1045.52%
- Current HPI
- 347.3256
- Rent YoY
- ▲ 3.89%
- Metro
- San Francisco-Oakland-Berkeley, CA
- State GDP YoY
- ▲ 3.21%
- F500 in state
- 116
Industry mix (Fortune 500 HQ in CA)
| Industry | F500 HQs | Revenue |
|---|---|---|
| Technology | 27 | $1,492B |
|
||
| Financial Services | 3 | $174B |
|
||
| Retail | 3 | $44B |
|
||
| Insurance | 3 | $26B |
|
||
| Media / Entertainment | 2 | $115B |
|
||
| Pharmaceuticals / Biotech | 2 | $62B |
|
||
Price history
+650.0% since first listed18 events — show timeline
- 2026-02-23 Pending — bridgeMLS, Bay East AOR, or Contra Costa AOR
- 2026-02-06 Listed $899,999 bridgeMLS, Bay East AOR, or Contra Costa AOR
- 2025-04-05 Listing Removed — bridgeMLS, Bay East AOR, or Contra Costa AOR
- 2025-02-27 Price Changed — bridgeMLS, Bay East AOR, or Contra Costa AOR
- 2025-01-17 Price Changed — bridgeMLS, Bay East AOR, or Contra Costa AOR
- 2025-01-17 Price Changed — bridgeMLS, Bay East AOR, or Contra Costa AOR
- 2024-08-28 Listed — bridgeMLS, Bay East AOR, or Contra Costa AOR
- 2021-07-22 Pending — bridgeMLS, Bay East AOR, or Contra Costa AOR
- 2021-07-22 Sold (Public Records) $900,000 Public Records
- 2021-07-22 Sold (MLS) $900,000 bridgeMLS, Bay East AOR, or Contra Costa AOR
- 2021-07-12 Listing Removed — bridgeMLS, Bay East AOR, or Contra Costa AOR
- 2021-04-09 Pending — bridgeMLS, Bay East AOR, or Contra Costa AOR
- 2021-02-17 Listed $790,900 bridgeMLS, Bay East AOR, or Contra Costa AOR
- 2019-09-30 Sold (Public Records) $625,000 Public Records
- 2019-09-30 Sold (MLS) $625,000 bridgeMLS, Bay East AOR, or Contra Costa AOR
- 2019-08-14 Pending — bridgeMLS, Bay East AOR, or Contra Costa AOR
- 2019-08-08 Listed $699,000 bridgeMLS, Bay East AOR, or Contra Costa AOR
- 1986-01-30 Sold (Public Records) $120,000 Public Records
Property tax history
+12.1%/yrLatest (2025): $27,057 · +31.3% YoY. Source: county tax records.
Cash-flow waterfall
monthlySold comps — $/sqft
last 12 mo · ≤1 miLoading sold comps…