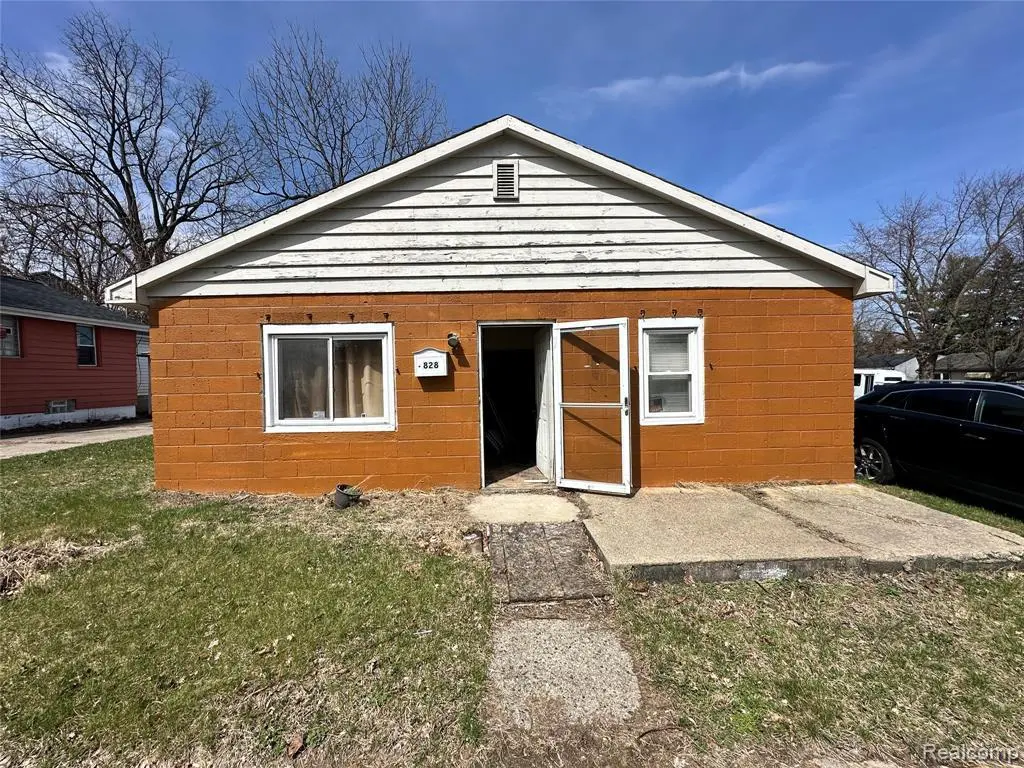
828 Short St · Ypsilanti, MI
Flood risk 1/10 · Minimal
- FEMA flood zone
- X (unshaded)
- Chance of flooding over 30 yrs
- 0.0%
- Est. flood insurance / yr
- $507 – $1,088
Fire risk 2/10 · Minimal
- Est. fire insurance / yr
- $784 – $1,456
Heat risk 3/10 · Minor
- Hot days now (above 99°F)
- 7 days/yr
- Hot days in 30 yrs
- 15 days/yr
Wind risk 2/10 · Minimal
- Chance of severe wind over 30 yrs
- —
Air-quality risk 2/10 · Minimal
- Unhealthy air days now
- 1 days/yr
- Unhealthy air days in 30 yrs
- 2 days/yr
Risk factors via First Street. Map © Google.
Why this score? — see what drove the B+ grade
The composite is a weighted blend of 9 inputs, each scored 0–100. Each bar is that input's sub-score; the figure is the points it added to the 100-point composite (weight × sub-score).
- Cash flow +30.0/30.0
- ARV discount +15.0/15.0
- 1% rule +10.0/10.0
- DSCR +10.0/10.0
- Livability +4.0/5.0
- Rent growth +3.3/5.0
- Condition / age +2.5/5.0
- Schools +1.3/10.0
- Appreciation +0.0/10.0
$77,500
🖨 Deal sheet 📄 Offer letter ✓ Due diligence
Listing remarks MLS
Investor special in a desirable area of Ypsilanti! This spacious 4-bedroom, 3-bath cinder block home was previously configured as a 2-unit property, offering excellent potential for a renovation, rental investment, or possible conversion back to multifamily use (subject to local approvals). The property features generous living space, a cellar area for additional storage, and sits on a strong block with solid surrounding homes. The home will require a full rehabilitation and presents an opportunity for experienced investors to add significant value. Electrical and plumbing systems are in need of updates, and several rear windows would benefit from replacement, though many windows throughout the home remain in serviceable condition. Bring your vision and unlock the potential of this large property in a sought-after Ypsilanti location. Listing broker holds contractual equitable interest in the property and may receive consideration from the transaction. Property is being marketed pursuant to a purchase agreement with the seller. Closing will be conducted via contract assignment or double closing, with preference given to assignment. Seller to provide marketable title at closing. Title commitment available. Seller pays ALL: water bills owed, taxes owed, blight tickets or anything else. Buyer to pay closing costs, including transfer taxes, title insurance, closing fees. Sold AS IS - Buyer to verify all information listed. Room dimensions are just estimates.
Key facts
- Full rehabilitation
- 6,098 sq ft lot
- Built 1939
Tags
Property features AI
Finance
- Other: Lot approximately 0.14 acres (50 x 122); Subdivision: WORDEN GARDENS; Directions: N of Heritage Park / E of 1st Ave
Exterior
- Parking: No garage
- Utilities: Public water; Public sewer
- Home design: Single-family residence; One level; Ground-level entry with steps; Block construction
- Construction: Block foundation; Asphalt roof
- Exterior features: Porch; Back yard fencing; Paved road access
Interior
- Kitchen: No kitchen appliance list provided
- Bedrooms: 4 total rooms (includes bedrooms and living spaces)
- Bathrooms: 3 full bathrooms
- Heating & cooling: Forced air heating (natural gas); No central cooling
- Interior features: Gas water heater; Unfinished basement; Lighting
- Laundry & utility: Washer hookup; Gas dryer hookup
Neighborhood map
What this means for you Summary
Snapshot
- This is a 4-bed/3.0-bath manufactured listed at $78k.
Deal economics
- At list price, monthly cash flow is $895 ($11k/yr) — positive.
- The deal already cash-flows at list — no discount required.
- Meets the 1% rule at list price ($2k rent vs $78k).
- Recommended offer: $76k (1.5% below list) — sets the bar for market timing.
- Cap rate 20.2% vs local median 4.0% in Ypsilanti — top-decile yield for the area; either an underpriced asset or a hidden risk that comps aren't pricing in. Stress-test before assuming the spread holds.
Location & tenants
- Location reads 81/100 on livability (#71 in MI, #1,539 nationally) — a professional / high-income tenant draw. Strengths: amenities A+, commute A+, cost of living A+; Watch: crime F, employment D-.
- Ypsilanti Community Schools (suburban): math 11% / reading 20% proficiency, ranked #501 of 540 in MI (top 93%) — low school quality limits family demand, transient renter base, plan for 1-2y turnover; 69% free/reduced lunch — lower-income household profile, screen leases tightly.
- Market conditions: Rents rising (+3.4%/yr); 239 active listings in the ZIP; 13 comparable units currently listed for rent nearby; rentals at typical pace (median 18d on market — plan ~3-4 weeks tenant-placement turnaround); 996 units permitted in Washtenaw County in 2024 (492 in 5+ unit buildings).
- This rent runs 33% of the median local income ($74k/yr) — at the standard rent-burdened threshold; future hikes will face affordability resistance.
Forward outlook
- Local home prices are declining (-3.0%/yr); year-one equity from $536 of loan paydown is wiped out by about $2k of value loss. Plan a longer hold.
- Washtenaw County population projected at +25% by 2050 — long-run rental-demand tailwind backs the buy-and-hold thesis.
- At projected returns (-3.0% appreciation + 3.4% rent growth), your $22k cash investment doubles in ~3 years — after that, you're playing with house money.
Negotiation context
- It's been on market 17 days — a 2% lower offer ($76k) is reasonable based on typical stale-listing flexibility.
- 2 sale attempts; this cycle's ask has dropped $8k (9%) from the opening price — seller is motivated, your offer sets the floor, not the list.
Risks & watch-outs
- Watch-outs: property tax is 3.8% of price; built in 1939 — expect roof / HVAC / electrical / plumbing capex.
Questions for the listing agent
- Built in 1939 — when were the roof, HVAC, electrical panel, plumbing, and water heater last replaced?
- Property tax is high relative to price — has the assessment been appealed recently, and will the sale trigger a re-assessment?
- Is there a deadline driving the sale (1031 exchange, divorce, estate, relocation)? That informs how much negotiation room exists.
- Crime grade is F in this area — have there been break-ins, vandalism, or insurance claims at this property in the last 3 years? What carrier currently insures it and at what premium?
- What's the average days-on-market for RENTAL listings here right now (not sales)? A rising rental-DOM trend means longer vacancies and softer asking-rent achievability than the comps imply.
- What's the recent tenant-quality profile in this submarket — average credit score on applications, eviction rate, late-payment / NSF rate, and stable-employment percentage? A property-management company in the area should have these aggregated.
- How much new for-sale + rental construction is in the pipeline within 1–3 miles? Heavy new supply typically softens prices + rents 12–24 months out; constrained supply supports both.
Investment metrics
- 1% rule
- 2.58% ✓
- Cap rate
- 20.16%
- Cash-on-cash
- 49.51%
- DSCR
- 3.20
- GRM
- 3.2
CMA / ARV
- ARV (on-the-fly)
- $140,096
- Comps found
- 1
Show comp detail 1 sale within ~0.75 mi
| Address | Dist | Beds/Ba | Sqft | Sold | Price | $/sf | Match |
|---|---|---|---|---|---|---|---|
| 845 Frederick St | 0.09mi | 3/2.0 (-1) | 1,809 (+14%) | 10mo | $159,000 | $88 | 56 |
Match score weights: distance 35% · size 25% · config 20% · recency 20%. Top-matched comps best support the ARV.
Projected returns pro-forma
-3.0% appreciation · 3.36% rent growth · sell at horizon
- IRR
- 47.7%
- Equity multiple
- 3.09×
- Total profit
- $45,311
- Equity at exit
- $11,556
- IRR
- 53.5%
- Equity multiple
- 6.36×
- Total profit
- $116,377
- Equity at exit
- $6,701
Cash invested: $21,700 (down + closing). Projections, not guarantees.
Landlord ↔ Tenant lean methodology
- Overall (STATE)
- 62 Landlord-Friendly
- State Michigan
- 62 Landlord-Friendly · EVEN
- County
- — inherits STATE
- City
- — inherits STATE
ZIP-level market 48197
- Rents YoY
- 3.4%
- Active inventory
- 239
- Price-to-rent
- 3.2×
Monthly cashflow live
- Estimated rent
- $1,999 high interval (Pro) →
- Mortgage (P&I)
- −$406
- Tax from tax record
- −$245 /mo · $2,943/yr
- Insurance
- −$32
- HOA
- −$0
- Vacancy / Maint / Mgmt
- −$420
- Net cashflow
- $895
Break-even live
UW: 25.0% down · 7.5% · 30yr · 1.5% tax · 5.0% vac · 8.0% maint · 8.0% mgmt
Financing live
Cash to close
- Down payment
- $19,375
- Closing costs
- $2,325
- Reserves months
- —
- Total cash needed
- —
Loan-product check · same deal, 3 products live
Conventional
25% down · 7.5% · 30yr
- Down + closing
- —
- Monthly P&I
- —
- Monthly cashflow
- —
- DSCR
- —
- Eligible?
- —
Personal DTI + credit; lowest rate.
DSCR
20% down · 8.5% · 30yr
- Down + closing
- —
- Monthly P&I
- —
- Monthly cashflow
- —
- DSCR
- —
- Eligible?
- —
No personal income docs; deal must DSCR.
Hard money
10% down · 12.0% · 12mo
- Down + closing
- —
- Monthly P&I
- —
- Monthly cashflow
- —
- DSCR
- —
- Eligible?
- —
Short-term bridge; refi at stabilization.
Rent comps 13 comps
| Address | Beds | Baths | Sqft | Rent | $/sqft | DOM | Units | Dist |
|---|---|---|---|---|---|---|---|---|
| 138 Hawkins St Ypsilanti, MI | 4.0 | 2.0 | 1500 | $1,950 | $1.30 | 17d | 1 | 0.16mi |
| 303 W Ainsworth St Ypsilanti, MI | 3.0 | 1.0 | 1221 | $1,900 | $1.56 | 43d | 1 | 0.22mi |
| 804 W Michigan Ave Ypsilanti, MI | 3.0 | 1.0 | 1375 | $1,650 | $1.20 | 1d | 1 | 0.27mi |
| 701 Washtenaw Ave Unit 1 Ypsilanti, MI | 3.0 | 1.0 | 1350 | $2,400 | $1.78 | 11d | 1 | 0.64mi |
| 701 Washtenaw Ave Unit : 2 Ypsilanti, MI | 3.0 | 1.0 | 1350 | $2,400 | $1.78 | 2d | 1 | 0.64mi |
| 701 Washtenaw Ave Unit 1 Ypsilanti, MI | 3.0 | 1.0 | 1350 | $2,500 | $1.85 | 24d | 1 | 0.64mi |
| 222 N Summit St Ypsilanti, MI | 4.0 | 2.0 | 1650 | $2,400 | $1.45 | 17d | 1 | 0.66mi |
| 410 Washtenaw Ave Unit 1 Ypsilanti, MI | 3.0 | 1.0 | 1200 | $695 | $0.58 | 43d | 1 | 0.70mi |
| 312 Ballard St Ypsilanti, MI | 4.0 | 3.0 | 1390 | $1,699 | $1.22 | 12d | 1 | 0.78mi |
| 434 N Hamilton St Ypsilanti, MI | 4.0 | 1.0 | 1228 | $1,700 | $1.38 | 17d | 1 | 0.94mi |
| 2417 Harding Ave Ypsilanti, MI | 3.0 | 2.5 | 1850 | $2,950 | $1.59 | 24d | 1 | 1.34mi |
| 1000 N Huron River Dr Ypsilanti, MI | 1.0–4.0 | 1.0–4.0 | 937 | $2,616 | $2.79 | 1d | 1 | 1.43mi |
| 669 Woburn Dr Ypsilanti, MI | 1.0–3.0 | 1.0–2.0 | 911 | $1,600 | $1.76 | 43d | 1 | 1.49mi |
Listing history 13 events
-
2026-06-18days on market $77,500 Active 17 DOM
-
2026-06-17days on market $77,500 Active 16 DOM
-
2026-06-16days on market $77,500 Active 15 DOM
-
2026-06-15days on market $77,500 Active 14 DOM
-
2026-06-13days on market $77,500 Active 12 DOM
-
2026-06-10price $77,500 Active 8 DOM
-
2026-06-09days on market $85,000 Active 8 DOM
-
2026-06-08days on market $85,000 Active 7 DOM
-
2026-06-07days on market $85,000 Active 6 DOM
-
2026-06-04days on market $85,000 Active 3 DOM
-
2026-06-03days on market $85,000 Active 2 DOM
-
2026-06-02remarks 699-char remark
-
2026-06-02$85,000 Active 1 DOM
ⓘ Source: listings_history table (triggers on properties + properties_extension) + one-shot
backfill from property_details.listing_events for pre-trigger history.
Tax reassessment forecast MI · Partial reset (capped growth)
- Current annual tax
- $2,943 · $245/mo
- Projected year-2 tax
- $2,943 · $245/mo
- Expected delta
- $0/yr ($0/mo · 0.0%)
ⓘ Screening estimate from a state-policy table — verify with the county assessor before closing.
Climate risk First Street
- Flood 1/10 Low FEMA zone X (unshaded) · 0% chance over 30 yrs
- Wildfire 2/10 Low
- Heat 3/10 Moderate 7 d/yr ≥99°F today · 15 d/yr by 30 yrs out
- Wind 2/10 Low
- Air quality 2/10 Low 1 unhealthy d/yr today · 2 by 30 yrs out
Nearby sold comps map
Loading sold comps map…
Walkable amenities ~0.75 mi
Loading nearby amenities…
Taxation est. · year 1
- Rental income
- $23,989
- − Mortgage interest
- −$4,341
- − Property taxes
- −$2,943
- − Insurance
- −$388
- − Repairs & maintenance
- −$1,919
- − Management
- −$1,919
- − Depreciation
- −$2,255
- Taxable income
- $10,224
- Est. tax owed @ 24.0%
- −$2,454
- After-tax cash flow
- $8,290/yr
For passive investors: Depreciation is non-cash, so a rental often shows a tax loss while cash-flowing — sheltering income. Rental losses are passive: they offset passive income freely, and up to $25,000/yr can offset ordinary (W-2) income if you actively participate and your MAGI is under $100k (phasing out to $0 by $150k); unused losses carry forward. On sale, claimed depreciation is recaptured at up to 25%, and gains may owe capital-gains tax (a 1031 exchange can defer both). Figures are a year-1 estimate at your 24.0% rate — not tax advice; consult a CPA.
Schools (NCES district)
- District
- Ypsilanti Community Schools
- NCES district ID
- 2636630
- Math proficiency
- 11% ▼ -8.00%
- Reading proficiency
- 20% ▼ -3.00%
- Median HH income
- $37,759
- Composite
- 12.98/100
- National rank
- #9572
- State rank
- #501 of 540 in MI
Livability — Ypsilanti
- Score
- 81/100
- State rank
- #71
- US rank
- #1539
Category grades
Schools grade is shown separately in the Schools card above.
Census & demographics
- Census place
- Ypsilanti, MI
- County
- Washtenaw County · 306,860 people
- City population
- 105,769
- Metro
- Ann Arbor, MI
- Population (ZIP)
- 66,525
- Household income
- $73,737
- Rent vs Own
- Severe rent burden
- 3134.0
Population outlook (Washtenaw County) Hauer SSP2
- Today (2025)
- 402,878 people
- By 2030
- 424,104 · +5.3%
- By 2040
- 464,633 · +15.3%
- By 2050
- 504,728 · +25.3%
- By 2075
- 614,463 · +52.5%
- By 2100
- 676,181 · +67.8%
Race, ethnicity, and origin ACS 2023
- Neighborhood character
- Diverse neighborhood (Simpson 0.62)
- Race & ethnicity
- White 57% Black 23% Two or more races 9% Hispanic / Latino 8% Asian 6%
- Hispanic origin (detail)
- Mexican 4%
- Common ancestry
- Romanian 5% Slovak 3% Lithuanian 3%
- Foreign-born
- 12% · Canada, China, Vietnam
- Languages at home
- 84% English-only · Spanish 4% Other Indo-European 3% Arabic 3%
Political lean MEDSL · Washtenaw
- 2024 margin
- Solid D (+44.4) · D 71.0% · R 26.6% · Other 2.4%
- 2008→2024 swing
- +3.5pp toward D · 2008: 41.0pp · 2024: 44.4pp
- All cycles
- 2024: D+44.4 2020: D+46.6 2016: D+41.5 2012: D+36.0 2008: D+41.0
Not yet ingested
- Civics
- —
Market trends
- HPI YoY
- ▼ -223.94%
- Current HPI
- 217.0173
- Rent YoY
- ▲ 3.36%
- Metro
- Ann Arbor, MI
- State GDP YoY
- ▲ 1.37%
- F500 in state
- 28
Industry mix (Fortune 500 HQ in MI)
| Industry | F500 HQs | Revenue |
|---|---|---|
| Automotive Parts | 3 | $48B |
|
||
| Automotive | 2 | $372B |
|
||
| Chemicals | 1 | $45B |
|
||
| Automotive Retail | 1 | $29B |
|
||
| Healthcare / Medical Devices | 1 | $23B |
|
||
| Automotive Technology | 1 | $20B |
|
||
Price history
+0.0% since first listed2 events — show timeline
- 2026-06-01 Listed $85,000 MiRealSource-MiMLS
- 2026-06-01 Listed $85,000 REALCOMP
Property tax history
+5.4%/yrLatest (2025): $2,943 · +16.5% YoY. Source: county tax records.
Cash-flow waterfall
monthlySold comps — $/sqft
last 12 mo · ≤1 miLoading sold comps…