 40-Plex
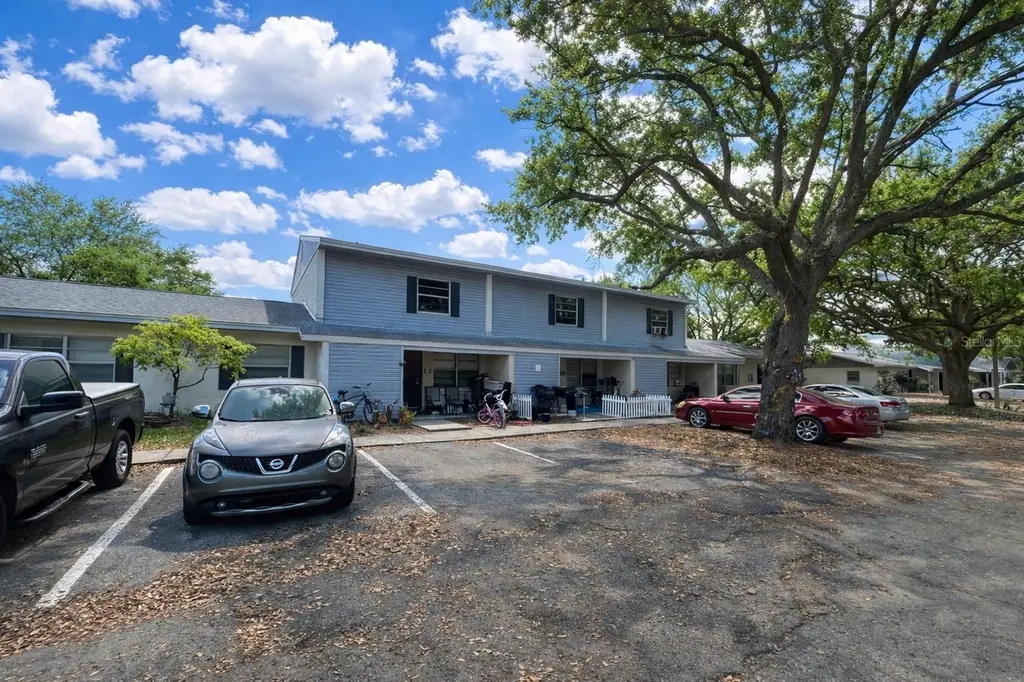
1000 E Caroline St · Tavares, FL
Flood risk 1/10 · Minimal
- FEMA flood zone
- X (unshaded)
- Chance of flooding over 30 yrs
- 0.0%
- Est. flood insurance / yr
- $507 – $1,088
Fire risk 1/10 · Minimal
- Est. fire insurance / yr
- $947 – $1,759
Heat risk 9/10 · Severe
- Hot days now (above 108°F)
- 7 days/yr
- Hot days in 30 yrs
- 22 days/yr
Wind risk 9/10 · Severe
- Chance of severe wind over 30 yrs
- 99.0%
Air-quality risk 2/10 · Minimal
- Unhealthy air days now
- 1 days/yr
- Unhealthy air days in 30 yrs
- 1 days/yr
Risk factors via First Street. Map © Google.
Why this score? — see what drove the B grade
The composite is a weighted blend of 9 inputs, each scored 0–100. Each bar is that input's sub-score; the figure is the points it added to the 100-point composite (weight × sub-score).
- Cash flow +30.0/30.0
- 1% rule +10.0/10.0
- DSCR +10.0/10.0
- ARV discount +7.5/15.0
- Schools +4.2/10.0
- Livability +3.8/5.0
- Rent growth +3.5/5.0
- Condition / age +2.5/5.0
- Appreciation +0.0/10.0
$3,600,000
🖨 Deal sheet (PDF) 📄 Offer letter ✓ Due diligence
Multi-family units
County records classify this as Multi-Family (5+ Unit). Listing-text estimate: 40 units. confirmed
5+ unit building — per-unit beds/baths from public records are typically unavailable; the breakdown below (if shown) is an estimate from the listing text.
Listing remarks
Under contract-accepting backup offers. Exceptional opportunity to acquire Caroline Court, a 40-unit multifamily community in the heart of Tavares, offering immediate scale, stable occupancy, and the security of HUD-backed rental income. Situated on approximately 3.56 acres, this well-established apartment community consists of 8 residential buildings totaling approximately 32,000 square feet, with a desirable mix of 1-bedroom, 2-bedroom, and 3-bedroom floor plans. Built in 1979, the property has maintained strong performance with historically high occupancy and minimal vacancy, supported by consistent demand for affordable housing in the Tavares market. A major investment advantage is that
Key facts
- 3.56 acre lot
- Built 1979
- Listed 33 days
Property features AI
Finance
- Other: Total living area reported: 35,262 square feet; Lot size reported: 3.56 acres (approx. 14,400 sq meters); Zoning: RMF-3
- Financial info: Annual net income reported: $499,296; Pro forma income for Unit Type 1: 41,608; Calculated list price per square foot reported
- HOA & community: No association reported
Exterior
- Utilities: Public water; Other sewer; Other utilities
- Home design: Residential income property; Quadruplex sub-type; Completed condition; 8 buildings on site; Facing and entry details not provided
- Construction: Other construction materials; Other roof type; Other foundation details; Built as part of multiple buildings (8 total)
- Exterior features: Other exterior features; Road surfaces other than typical pavement
Interior
- Bedrooms: 40 total bedrooms
- Bathrooms: 5 total bathrooms (in Unit Type 1 group)
- Heating & cooling: Other heating; Other cooling
- Interior features: Other interior features
- Laundry & utility: Other laundry features
Neighborhood map
What this means for you Summary
Snapshot
- This is a 40 × 40-bed/40.0-bath units multifamily listed at $3.60M.
Deal economics
- At list price, monthly cash flow is $42k ($500k/yr) — positive. Per door: $1k/mo.
- The deal already cash-flows at list — no discount required.
- Meets the 1% rule at list price ($82k rent vs $3.60M).
- Recommended offer: $3.49M (3.0% below list) — sets the bar for market timing.
- Cap rate 20.2% vs local median 4.5% in Tavares — top-decile yield for the area; either an underpriced asset or a hidden risk that comps aren't pricing in. Stress-test before assuming the spread holds.
Location & tenants
- Location reads 76/100 on livability (#220 in FL, #3,464 nationally) — a middle-class / working-renter tenant base. Strengths: crime A+, cost of living A+, housing A+; Watch: employment D, amenities F, commute F.
- Lake (suburban): math 49% / reading 50% proficiency, ranked #37 of 73 in FL (top 51%) — families likely to look elsewhere, expect single-tenant / working-renter base with shorter leases.
- Zoned schools: Tavares Elementary School (math 49% / reading 45%, grade D-, #1,191 of 2,144 statewide, top 57%, 875 students, 61% FRL); Tavares Middle School (math 43% / reading 40%, grade F, #348 of 571 statewide, top 62%, 1,070 students, 58% FRL); Tavares High School (math 32% / reading 40%, grade F, #359 of 667 statewide, top 55%, 1,507 students, 45% FRL).
- Market conditions: Rents rising fast (+4.0%/yr); 507 active listings in the ZIP; 4,799 units permitted in Lake County in 2024 (814 in 5+ unit buildings).
- At $82,289/mo this rent would consume 1556% of the median local household income ($63k/yr) (locally 586% of renters already pay >50% of income on rent) — very limited rent-growth headroom before tenants either downsize or default.
Forward outlook
- Local home prices are declining (-3.0%/yr); year-one equity from $25k of loan paydown is wiped out by about $108k of value loss. Plan a longer hold.
- Lake County population projected at +37% by 2050 — long-run rental-demand tailwind backs the buy-and-hold thesis.
- At projected returns (-3.0% appreciation + 4.0% rent growth), your $1.01M cash investment doubles in ~3 years — after that, you're playing with house money.
Negotiation context
- It's been on market 33 days — a 3% lower offer ($3.49M) is reasonable based on typical stale-listing flexibility.
- Current owner paid $2.31M; list at $3.60M implies a 56% gain — meaningful room to come down on a strong offer.
Risks & watch-outs
- Climate carrying-cost: severe wind risk, 99% chance of damaging wind over 30y; extreme-heat days projected 7→22/yr by 2055 (HVAC capex compounding) — expect insurance premiums to compound above CPI over the hold.
Questions for the listing agent
- It's been on market 33 days. Have you received any prior offers? Is the seller open to a 3% concession, seller financing, or rate buy-down credit?
- Can we see the unit-by-unit rent roll, current vacancy, and any below-market leases? What's the average tenancy length?
- What capital expenditures (roof, boiler, parking lot, exteriors) have been made in the last 5 years, and what's planned in the next 2?
- Built in 1979 — when were the roof, HVAC, electrical panel, plumbing, and water heater last replaced?
- Is there a deadline driving the sale (1031 exchange, divorce, estate, relocation)? That informs how much negotiation room exists.
- What's the average days-on-market for RENTAL listings here right now (not sales)? A rising rental-DOM trend means longer vacancies and softer asking-rent achievability than the comps imply.
- What's the recent tenant-quality profile in this submarket — average credit score on applications, eviction rate, late-payment / NSF rate, and stable-employment percentage? A property-management company in the area should have these aggregated.
- How much new apartment / multifamily construction is in the pipeline within 1–3 miles? Heavy new supply (>2% of stock underway) typically softens rents 12–24 months out; light construction supports rent growth.
Investment metrics
- 1% rule
- 2.29% ✓
- Cap rate
- 20.19%
- Cash-on-cash
- 49.65%
- DSCR
- 3.21
- GRM
- 3.6
CMA / ARV
No comps found within radius.
Projected returns pro-forma
-3.0% appreciation · 4.05% rent growth · sell at horizon
- IRR
- 48.5%
- Equity multiple
- 3.14×
- Total profit
- $2,160,877
- Equity at exit
- $536,772
- IRR
- 54.5%
- Equity multiple
- 6.63×
- Total profit
- $5,671,190
- Equity at exit
- $311,262
Cash invested: $1,008,000 (down + closing). Projections, not guarantees.
Landlord ↔ Tenant lean methodology
- Overall (STATE)
- 87 Strongly Landlord-Friendly
- State Florida
- 87 Strongly Landlord-Friendly · R+3
- County
- — inherits STATE
- City
- — inherits STATE
ZIP-level market 32778
- Home prices YoY
- -23.4%
- Rents YoY
- 4.0%
- Active inventory
- 507
- Price-to-rent
- 145.8×
Monthly cashflow live
- Estimated rent
- $82,289 medium interval (Pro) →
- Mortgage (P&I)
- −$18,879
- Tax from tax record
- −$2,926 /mo · $35,112/yr
- Insurance
- −$1,500
- HOA
- −$0
- Vacancy / Maint / Mgmt
- −$17,281
- Net cashflow
- $41,703
Break-even live
Sensitivity live
| Price | -10% $43,741 | -5% $42,722 | +0% $41,703 | +5% $40,685 | +10% $39,666 |
|---|---|---|---|---|---|
| Rent | -10% $35,203 | -5% $38,453 | +0% $41,703 | +5% $44,954 | +10% $48,204 |
| Rate | -1.0pp $43,516 | -0.5pp $42,619 | base $41,703 | +0.5pp $40,771 | +1.0pp $39,822 |
40-unit breakdown (identical units grouped — click to expand)
| Units | Beds | Baths | Est. rent |
|---|---|---|---|
| 40× units | 40 | 40 | $82,280 |
| #1 | 40 | 40 | $2,057 |
| #2 | 40 | 40 | $2,057 |
| #3 | 40 | 40 | $2,057 |
| #4 | 40 | 40 | $2,057 |
| #5 | 40 | 40 | $2,057 |
| #6 | 40 | 40 | $2,057 |
| #7 | 40 | 40 | $2,057 |
| #8 | 40 | 40 | $2,057 |
| #9 | 40 | 40 | $2,057 |
| #10 | 40 | 40 | $2,057 |
| #11 | 40 | 40 | $2,057 |
| #12 | 40 | 40 | $2,057 |
| #13 | 40 | 40 | $2,057 |
| #14 | 40 | 40 | $2,057 |
| #15 | 40 | 40 | $2,057 |
| #16 | 40 | 40 | $2,057 |
| #17 | 40 | 40 | $2,057 |
| #18 | 40 | 40 | $2,057 |
| #19 | 40 | 40 | $2,057 |
| #20 | 40 | 40 | $2,057 |
| #21 | 40 | 40 | $2,057 |
| #22 | 40 | 40 | $2,057 |
| #23 | 40 | 40 | $2,057 |
| #24 | 40 | 40 | $2,057 |
| #25 | 40 | 40 | $2,057 |
| #26 | 40 | 40 | $2,057 |
| #27 | 40 | 40 | $2,057 |
| #28 | 40 | 40 | $2,057 |
| #29 | 40 | 40 | $2,057 |
| #30 | 40 | 40 | $2,057 |
| #31 | 40 | 40 | $2,057 |
| #32 | 40 | 40 | $2,057 |
| #33 | 40 | 40 | $2,057 |
| #34 | 40 | 40 | $2,057 |
| #35 | 40 | 40 | $2,057 |
| #36 | 40 | 40 | $2,057 |
| #37 | 40 | 40 | $2,057 |
| #38 | 40 | 40 | $2,057 |
| #39 | 40 | 40 | $2,057 |
| #40 | 40 | 40 | $2,057 |
| Total (40 units) | $82,289 | ||
UW: 25.0% down · 7.5% · 30yr · 1.5% tax · 5.0% vac · 8.0% maint · 8.0% mgmt
Financing live
Cash to close
- Down payment
- $900,000
- Closing costs
- $108,000
- Reserves months
- —
- Total cash needed
- —
Loan-product check · same deal, 3 products live
Conventional
25% down · 7.5% · 30yr
- Down + closing
- —
- Monthly P&I
- —
- Monthly cashflow
- —
- DSCR
- —
- Eligible?
- —
Personal DTI + credit; lowest rate.
DSCR
20% down · 8.5% · 30yr
- Down + closing
- —
- Monthly P&I
- —
- Monthly cashflow
- —
- DSCR
- —
- Eligible?
- —
No personal income docs; deal must DSCR.
Hard money
10% down · 12.0% · 12mo
- Down + closing
- —
- Monthly P&I
- —
- Monthly cashflow
- —
- DSCR
- —
- Eligible?
- —
Short-term bridge; refi at stabilization.
Listing history 4 events
-
2026-05-09status Pending
-
2026-04-06$3,600,000 Active
-
2008-02-25soldstatus $2,310,000
-
2001-09-18soldstatus $925,000
ⓘ Source: listings_history table (triggers on properties + properties_extension) + one-shot
backfill from property_details.listing_events for pre-trigger history.
Tax reassessment forecast FL · Resets to sale price
- Current annual tax
- $35,112 · $2,926/mo
- Projected year-2 tax
- $35,112 · $2,926/mo
- Expected delta
- $0/yr ($0/mo · 0.0%)
ⓘ Screening estimate from a state-policy table — verify with the county assessor before closing.
Climate risk First Street
- Flood 1/10 Low FEMA zone X (unshaded) · 0% chance over 30 yrs
- Wildfire 1/10 Low
- Heat 9/10 Extreme 7 d/yr ≥108°F today · 22 d/yr by 30 yrs out
- Wind 9/10 Extreme 99% chance of damaging wind over 30 yrs
- Air quality 2/10 Low 1 unhealthy d/yr today · 1 by 30 yrs out
Nearby sold comps map
Loading sold comps map…
Walkable amenities ~0.75 mi
Loading nearby amenities…
Taxation est. · year 1
- Rental income
- $987,468
- − Mortgage interest
- −$201,656
- − Property taxes
- −$35,112
- − Insurance
- −$18,000
- − Repairs & maintenance
- −$78,997
- − Management
- −$78,997
- − Depreciation
- −$104,727
- Taxable income
- $469,977
- Est. tax owed @ 24.0%
- −$112,795
- After-tax cash flow
- $387,647/yr
For passive investors: Depreciation is non-cash, so a rental often shows a tax loss while cash-flowing — sheltering income. Rental losses are passive: they offset passive income freely, and up to $25,000/yr can offset ordinary (W-2) income if you actively participate and your MAGI is under $100k (phasing out to $0 by $150k); unused losses carry forward. On sale, claimed depreciation is recaptured at up to 25%, and gains may owe capital-gains tax (a 1031 exchange can defer both). Figures are a year-1 estimate at your 24.0% rate — not tax advice; consult a CPA.
Schools (NCES district)
- District
- Lake
- NCES district ID
- 1201050
- Math proficiency
- 49% ▼ -7.00%
- Reading proficiency
- 50% ▼ -4.00%
- Median HH income
- $46,632
- Composite
- 42.05/100
- National rank
- #3327
- State rank
- #37 of 73 in FL
Livability — Tavares
- Score
- 76/100
- State rank
- #220
- US rank
- #3464
Category grades
Schools grade is shown separately in the Schools card above.
Census & demographics
- Census place
- Tavares, FL
- County
- Lake County · 364,602 people
- City population
- 25,042
- Metro
- Orlando-Kissimmee-Sanford, FL
- Population (ZIP)
- 25,042
- Household income
- $63,472
- Rent vs Own
- Severe rent burden
- 586.0
Population outlook (Lake County) Hauer SSP2
- Today (2025)
- 386,640 people
- By 2030
- 417,107 · +7.9%
- By 2040
- 476,676 · +23.3%
- By 2050
- 531,296 · +37.4%
- By 2075
- 648,303 · +67.7%
- By 2100
- 698,530 · +80.7%
Race, ethnicity, and origin ACS 2023
- Neighborhood character
- Predominantly White (72%)
- Race & ethnicity
- White 72% Hispanic / Latino 14% Two or more races 8% Black 8% Asian 2%
- Hispanic origin (detail)
- Mexican 1% Puerto Rican 7% Cuban 2% Dominican 1%
- Common ancestry
- Romanian 4% Italian 3% Slovak 2%
- Foreign-born
- 9% · Canada, Dominican Republic, Jamaica
- Languages at home
- 85% English-only · Spanish 11% Other Indo-European 2% Other Asian/Pacific 1%
Political lean MEDSL · Lake
- 2024 margin
- Strong R (+24.7) · D 37.3% · R 62.0%
- 2008→2024 swing
- -11.2pp toward R · 2008: -13.5pp · 2024: -24.7pp
- All cycles
- 2024: R+24.7 2020: R+20.0 2016: R+23.1 2012: R+17.1 2008: R+13.5
Not yet ingested
- Civics
- —
Market trends
- HPI YoY
- ▼ -88.07%
- Current HPI
- 288.7123
- Rent YoY
- ▲ 4.05%
- Metro
- Orlando-Kissimmee-Sanford, FL
- State GDP YoY
- ▲ 3.28%
- F500 in state
- 36
Industry mix (Fortune 500 HQ in FL)
| Industry | F500 HQs | Revenue |
|---|---|---|
| Industrial Technology | 2 | $29B |
|
||
| Insurance | 2 | $17B |
|
||
| Retail | 1 | $60B |
|
||
| Technology Distribution | 1 | $58B |
|
||
| Homebuilding | 1 | $35B |
|
||
| Technology Manufacturing | 1 | $35B |
|
||
Price history
+289.2% since first listed4 events — show timeline
- 2026-05-09 Pending — Stellar MLS as Distributed by MLS Grid
- 2026-04-06 Listed $3,600,000 Stellar MLS as Distributed by MLS Grid
- 2008-02-25 Sold (Public Records) $2,310,000 Public Records
- 2001-09-18 Sold (Public Records) $925,000 Public Records
Property tax history
+4.6%/yrLatest (2025): $35,112 · +8.2% YoY. Source: county tax records.
Cash-flow waterfall
monthlySold comps — $/sqft
last 12 mo · ≤1 miLoading sold comps…