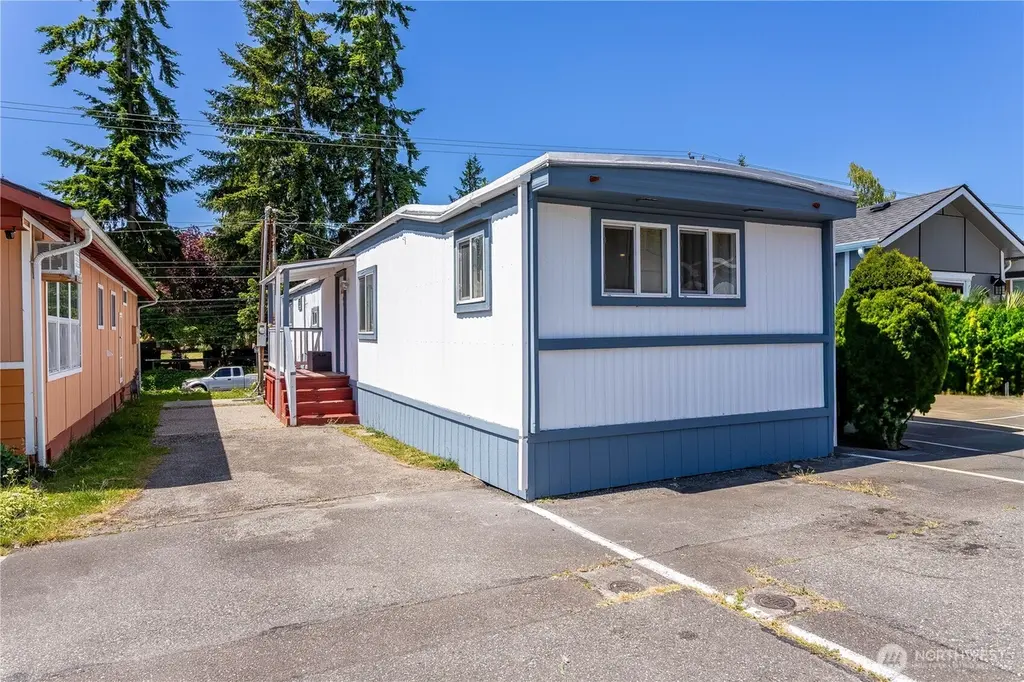
5920 200th St SW #37 · Lynnwood, WA
Flood risk No data
- FEMA flood zone
- —
- Chance of flooding over 30 yrs
- —
- Est. flood insurance / yr
- —
Fire risk No data
- Est. fire insurance / yr
- —
Heat risk No data
- Hot days now (above threshold)
- —
- Hot days in 30 yrs
- —
Wind risk No data
- Chance of severe wind over 30 yrs
- —
Air-quality risk No data
- Unhealthy air days now
- —
- Unhealthy air days in 30 yrs
- —
Risk factors via First Street. Map © Google.
Why this score? — see what drove the B+ grade
The composite is a weighted blend of 9 inputs, each scored 0–100. Each bar is that input's sub-score; the figure is the points it added to the 100-point composite (weight × sub-score).
- Cash flow +30.0/30.0
- ARV discount +15.0/15.0
- 1% rule +10.0/10.0
- DSCR +10.0/10.0
- Schools +5.4/10.0
- Livability +3.9/5.0
- Rent growth +3.1/5.0
- Condition / age +2.5/5.0
- Appreciation +0.0/10.0
$105,000
🖨 Deal sheet 📄 Offer letter ✓ Due diligence
Listing remarks
Charming home at Center Mobile Home Park in Lynnwood with all ages accepted! This home gets lots of natural light with 2 spacious beds and 1.75 baths. Enjoy peace of mind with freshly painted inside and outside & newer flooring. Open floor plan with living room is just off the dining room, kitchen and well maintained throughout. Great home and location. Easy Parking for up to 3 and extra guest parking right next to it. Located just minutes from Alderwood Mall Shopping and Lynnwood Center, restaurants, good schools, parks, I-5 and much more. Low maintenance living in a prime and convenient location. Move-in ready and close to everything you need. Come and tour it!
Key facts
- Guest parking
- Open floor plan
- Newer flooring
Tags
Neighborhood map
What this means for you Summary
Snapshot
- This is a 2-bed/1.5-bath manufactured listed at $105k.
Deal economics
- At list price, monthly cash flow is $841 ($10k/yr) — positive.
- The deal already cash-flows at list — no discount required.
- Meets the 1% rule at list price ($2k rent vs $105k).
- Recommended offer: $92k (12.0% below list) — sets the bar for market timing.
- Cap rate 15.9% vs local median 2.2% in Lynnwood — top-decile yield for the area; either an underpriced asset or a hidden risk that comps aren't pricing in. Stress-test before assuming the spread holds.
Location & tenants
- Location reads 77/100 on livability (#150 in WA, #3,226 nationally) — a middle-class / working-renter tenant base. Strengths: commute A+, health & safety A+, employment A; Watch: crime F, cost of living F.
- Edmonds School District (suburban): math 54% / reading 65% proficiency, ranked #53 of 291 in WA (top 18%) — acceptable for families but not a draw, mixed tenant base, ~2y average lease.
- Market conditions: Rents rising (+2.2%/yr); 184 active listings in the ZIP; 40 comparable units currently listed for rent nearby; rentals leasing fast (median 5d on market — plan ~1-2 weeks tenant-placement turnaround); solid renter incomes; 3,982 units permitted in Snohomish County in 2024 (1,492 in 5+ unit buildings).
Forward outlook
- Local home prices are declining (-3.0%/yr); year-one equity from $726 of loan paydown is wiped out by about $3k of value loss. Plan a longer hold.
- Snohomish County population projected at +30% by 2050 — long-run rental-demand tailwind backs the buy-and-hold thesis.
- At projected returns (-3.0% appreciation + 2.2% rent growth), your $29k cash investment doubles in ~4 years — after that, you're playing with house money.
Negotiation context
- It's been on market 349 days — a 12% lower offer ($92k) is reasonable based on typical stale-listing flexibility.
Questions for the listing agent
- It's been on market 349 days. Have you received any prior offers? Is the seller open to a 12% concession, seller financing, or rate buy-down credit?
- Built in 1969 — when were the roof, HVAC, electrical panel, plumbing, and water heater last replaced?
- Why hasn't it sold? Are there any deal-killer items the seller is aware of (foundation, flood, title, zoning, code violations)?
- Is there a deadline driving the sale (1031 exchange, divorce, estate, relocation)? That informs how much negotiation room exists.
- Crime grade is F in this area — have there been break-ins, vandalism, or insurance claims at this property in the last 3 years? What carrier currently insures it and at what premium?
- What's the average days-on-market for RENTAL listings here right now (not sales)? A rising rental-DOM trend means longer vacancies and softer asking-rent achievability than the comps imply.
- What's the recent tenant-quality profile in this submarket — average credit score on applications, eviction rate, late-payment / NSF rate, and stable-employment percentage? A property-management company in the area should have these aggregated.
- How much new for-sale + rental construction is in the pipeline within 1–3 miles? Heavy new supply typically softens prices + rents 12–24 months out; constrained supply supports both.
Investment metrics
- 1% rule
- 1.89% ✓
- Cap rate
- 15.91%
- Cash-on-cash
- 34.34%
- DSCR
- 2.53
- GRM
- 4.4
CMA / ARV
- ARV (median comp)
- $140,164
- List price
- $105,000
- Delta
- -25.09%
- Verdict
- UNDERPRICED
- Comps
- 5 within 1.0 mi
Projected returns pro-forma
-3.0% appreciation · 2.25% rent growth · sell at horizon
- IRR
- 28.9%
- Equity multiple
- 2.19×
- Total profit
- $35,122
- Equity at exit
- $15,656
- IRR
- 35.9%
- Equity multiple
- 4.19×
- Total profit
- $93,709
- Equity at exit
- $9,078
Cash invested: $29,400 (down + closing). Projections, not guarantees.
Landlord ↔ Tenant lean methodology
- Overall (STATE)
- 28 Tenant-Leaning
- State Washington
- 28 Tenant-Leaning · D+8
- County
- — inherits STATE
- City
- — inherits STATE
ZIP-level market 98036
- Rents YoY
- 2.2%
- Active inventory
- 184
- Price-to-rent
- 4.4×
Monthly cashflow live
- Estimated rent
- $1,984 high interval (Pro) →
- Mortgage (P&I)
- −$551
- Tax est. 1.5%
- −$131 /mo · $1,575/yr
- Insurance
- −$44
- HOA
- −$0
- Vacancy / Maint / Mgmt
- −$417
- Net cashflow
- $841
Break-even live
UW: 25.0% down · 7.5% · 30yr · 1.5% tax · 5.0% vac · 8.0% maint · 8.0% mgmt
Financing live
Cash to close
- Down payment
- $26,250
- Closing costs
- $3,150
- Reserves months
- —
- Total cash needed
- —
Loan-product check · same deal, 3 products live
Conventional
25% down · 7.5% · 30yr
- Down + closing
- —
- Monthly P&I
- —
- Monthly cashflow
- —
- DSCR
- —
- Eligible?
- —
Personal DTI + credit; lowest rate.
DSCR
20% down · 8.5% · 30yr
- Down + closing
- —
- Monthly P&I
- —
- Monthly cashflow
- —
- DSCR
- —
- Eligible?
- —
No personal income docs; deal must DSCR.
Hard money
10% down · 12.0% · 12mo
- Down + closing
- —
- Monthly P&I
- —
- Monthly cashflow
- —
- DSCR
- —
- Eligible?
- —
Short-term bridge; refi at stabilization.
Rent comps 40 comps
| Address | Beds | Baths | Sqft | Rent | $/sqft | DOM | Units | Dist |
|---|---|---|---|---|---|---|---|---|
| 6008 202nd St SW Unit D Lynnwood, WA | 2.0 | 1.0 | 825 | $1,750 | $2.12 | 16d | 1 | 0.04mi |
| 5812 200th St SW Unit B Lynnwood, WA | 2.0 | 2.0 | 942 | $2,300 | $2.44 | 43d | 1 | 0.12mi |
| 19815 Scriber Lake Rd Lynnwood, WA | 1.0 | 1.0 | 495 | $1,634 | $3.30 | 2d | 10 | 0.19mi |
| 5725 200th St SW Lynnwood, WA | 2.0 | 1.0 | 800 | $2,000 | $2.50 | 16d | 1 | 0.20mi |
| 5720 198th St SW Lynnwood, WA | 1.0 | 1.0 | 688 | $1,525 | $2.22 | 43d | 1 | 0.25mi |
| 19900 56th Ave W Unit A33 Lynnwood, WA | 1.0 | 1.0 | 675 | $1,645 | $2.44 | 14d | 1 | 0.27mi |
| 5618 198th St SW Unit 202 Lynnwood, WA | 2.0 | 1.0 | 817 | $1,750 | $2.14 | 3d | 1 | 0.30mi |
| 20620 60th Ave W Unit D Lynnwood, WA | 3.0 | 2.0 | 1111 | $2,400 | $2.16 | 43d | 1 | 0.32mi |
| 6501 208th St SW Lynnwood, WA | 1.0–2.0 | 1.0–2.0 | 850 | $2,119 | $2.49 | 1d | 8 | 0.45mi |
| 20427 68th Ave W Lynnwood, WA | 1.0–2.0 | 1.0 | 875 | $1,899 | $2.17 | 12d | 8 | 0.51mi |
| 6707 196th St SW Lynnwood, WA | 2.0 | 1.5 | 1000 | $2,449 | $2.45 | 3d | 1 | 0.61mi |
| 6601 210th St SW Lynnwood, WA | 1.0–2.0 | 1.0 | 975 | $1,830 | $1.88 | 4d | 2 | 0.62mi |
| 19800 50th Ave W Lynnwood, WA | 2.0 | 1.0 | 854 | $1,790 | $2.10 | 2d | 4 | 0.66mi |
| 21011 67th Ave W Unit 7 Lynnwood, WA | 1.0 | 1.0 | 600 | $1,350 | $2.25 | 24d | 1 | 0.67mi |
| 4807 200th St SW Lynnwood, WA | 2.0–3.0 | 1.0 | 935 | $1,550 | $1.66 | 1d | 12 | 0.70mi |
| 4800 200th St SW Unit E201 Lynnwood, WA | 2.0 | 2.0 | 971 | $2,300 | $2.37 | 4d | 1 | 0.71mi |
| 19801 50th Ave W Lynnwood, WA | 1.0–2.0 | 1.0 | 825 | $1,925 | $2.33 | 4d | 5 | 0.74mi |
| 5424 212th St SW Mountlake Terrace, WA | 1.0–2.0 | 1.0 | 763 | $2,995 | $3.93 | 1d | 6 | 0.81mi |
| 4727 200th St SW Lynnwood, WA | 1.0–2.0 | 1.0–1.5 | 875 | $2,558 | $2.92 | 1d | 12 | 0.83mi |
| 7221 196th St SW Lynnwood, WA | 2.0–3.0 | 2.0–2.5 | 1172 | $2,300 | $1.96 | 1d | 4 | 0.90mi |
| 5024 212th St SW Unit C Mountlake Terrace, WA | 2.0 | 1.0 | 912 | $1,900 | $2.08 | 43d | 1 | 0.93mi |
| 21416 52nd Ave W Mountlake Terrace, WA | 1.0–2.0 | 1.0 | 700 | $1,875 | $2.68 | 1d | 17 | 0.94mi |
| 5311 188th St SW Lynnwood, WA | 2.0 | 1.5 | 1004 | $2,500 | $2.49 | 43d | 1 | 0.97mi |
| 6102 St Albion Way Mountlake Terrace, WA | 1.0–2.0 | 1.0 | 862 | $1,740 | $2.02 | 2d | 6 | 1.00mi |
| 7428 208th St SW Edmonds, WA | 2.0 | 1.0 | 792 | $1,949 | $2.46 | 4d | 8 | 1.03mi |
| 18534 52nd Ave W Lynnwood, WA | 2.0 | 2.0 | 1100 | $2,295 | $2.09 | 1d | 1 | 1.06mi |
| 5707 186th Pl SW Unit 4-PLEX 1 Lynnwood, WA | 2.0 | 2.0 | 1000 | $2,135 | $2.13 | 24d | 1 | 1.08mi |
| 4301 Alderwood Mall Blvd Lynnwood, WA | 2.0 | 1.0 | 440 | $2,100 | $4.77 | 2d | 14 | 1.08mi |
| 4710 212th St SW Mountlake Terrace, WA | 2.0 | 1.0–2.0 | 865 | $2,260 | $2.61 | 3d | 6 | 1.09mi |
| 21412 48th Ave W Mountlake Terrace, WA | 1.0–2.0 | 1.0–2.0 | 760 | $2,287 | $3.01 | 1d | 5 | 1.09mi |
| 21911 58th Ave W Mountlake Terrace, WA | 2.0 | 1.5 | 1100 | $2,295 | $2.09 | 4d | 1 | 1.13mi |
| 4200 Alderwood Mall Blvd Lynnwood, WA | 2.0 | 1.0–2.0 | 702 | $2,820 | $4.01 | 2d | 13 | 1.14mi |
| 21903 58th Ave W Unit 3G Mountlake Terrace, WA | 2.0 | 1.5 | 1100 | $2,295 | $2.09 | 4d | 1 | 1.14mi |
| 20921 44th Ave W Lynnwood, WA | 2.0–4.0 | 2.0 | 1273 | $1,900 | $1.49 | 1d | 3 | 1.16mi |
| 7700 196th St SW Unit A Edmonds, WA | 1.0 | 1.0 | 608 | $1,650 | $2.71 | 43d | 1 | 1.16mi |
| 5624 183rd St SW Lynnwood, WA | 1.0–2.0 | 1.0 | 787 | $2,100 | $2.67 | 4d | 2 | 1.17mi |
| 21521 73rd Pl W Unit 11 Edmonds, WA | 2.0 | 1.0 | 750 | $1,748 | $2.33 | 43d | 1 | 1.18mi |
| 5620 183rd St SW Lynnwood, WA | 1.0–2.0 | 1.0 | 787 | $2,075 | $2.63 | 2d | 2 | 1.19mi |
| 7806 196th St SW Edmonds, WA | 2.0 | 1.0 | 850 | $2,040 | $2.40 | 43d | 1 | 1.19mi |
| 4402 212th St SW Mountlake Terrace, WA | 2.0 | 1.0 | 880 | $2,125 | $2.41 | 4d | 1 | 1.19mi |
Listing history 17 events
-
2026-06-18days on market $105,000 Active 349 DOM
-
2026-06-17days on market $105,000 Active 348 DOM
-
2026-06-16days on market $105,000 Active 347 DOM
-
2026-06-15days on market $105,000 Active 346 DOM
-
2026-06-13days on market $105,000 Active 344 DOM
-
2026-06-13days on market $105,000 Active 343 DOM
-
2026-06-09days on market $105,000 Active 340 DOM
-
2026-06-08days on market $105,000 Active 339 DOM
-
2026-06-07days on market $105,000 Active 338 DOM
-
2026-06-04days on market $105,000 Active 335 DOM
-
2026-06-03days on market $105,000 Active 334 DOM
-
2026-06-02days on market $105,000 Active 333 DOM
-
2026-06-01days on market $105,000 Active 332 DOM
-
2026-05-31days on market $105,000 Active 331 DOM
-
2025-12-17price $105,000
-
2025-08-28price $107,500
-
2025-07-04$115,000 Active
ⓘ Source: listings_history table (triggers on properties + properties_extension) + one-shot
backfill from property_details.listing_events for pre-trigger history.
Nearby sold comps map
Loading sold comps map…
Walkable amenities ~0.75 mi
Loading nearby amenities…
Taxation est. · year 1
- Rental income
- $23,804
- − Mortgage interest
- −$5,882
- − Property taxes
- −$1,575
- − Insurance
- −$525
- − Repairs & maintenance
- −$1,904
- − Management
- −$1,904
- − Depreciation
- −$3,055
- Taxable income
- $8,959
- Est. tax owed @ 24.0%
- −$2,150
- After-tax cash flow
- $7,947/yr
For passive investors: Depreciation is non-cash, so a rental often shows a tax loss while cash-flowing — sheltering income. Rental losses are passive: they offset passive income freely, and up to $25,000/yr can offset ordinary (W-2) income if you actively participate and your MAGI is under $100k (phasing out to $0 by $150k); unused losses carry forward. On sale, claimed depreciation is recaptured at up to 25%, and gains may owe capital-gains tax (a 1031 exchange can defer both). Figures are a year-1 estimate at your 24.0% rate — not tax advice; consult a CPA.
Schools (NCES district)
- District
- Edmonds School District
- NCES district ID
- 5302400
- Math proficiency
- 54% ▼ -1.00%
- Reading proficiency
- 65% ▬ 0.00%
- Median HH income
- $67,451
- Composite
- 53.94/100
- National rank
- #3026
- State rank
- #53 of 291 in WA
Livability — Lynnwood
- Score
- 77/100
- State rank
- #150
- US rank
- #3226
Category grades
Schools grade is shown separately in the Schools card above.
Census & demographics
- Census place
- Lynnwood, WA
- County
- Snohomish County · 786,756 people
- City population
- 152,865
- Metro
- Seattle-Tacoma-Bellevue, WA
- Population (ZIP)
- 42,370
- Household income
- $88,958
- Rent vs Own
- Severe rent burden
- 1781.0
Population outlook (Snohomish County) Hauer SSP2
- Today (2025)
- 899,800 people
- By 2030
- 960,975 · +6.8%
- By 2040
- 1,074,447 · +19.4%
- By 2050
- 1,171,954 · +30.2%
- By 2075
- 1,384,849 · +53.9%
- By 2100
- 1,497,296 · +66.4%
Race, ethnicity, and origin ACS 2023
- Neighborhood character
- Diverse neighborhood (Simpson 0.63)
- Race & ethnicity
- White 56% Asian 18% Hispanic / Latino 11% Two or more races 9% Black 9%
- Hispanic origin (detail)
- Mexican 8%
- Common ancestry
- Portuguese 5% Italian 4% Lithuanian 2%
- Foreign-born
- 27% · Canada, Vietnam, China
- Languages at home
- 65% English-only · Spanish 8% Other Indo-European 4% Other Asian/Pacific 4%
Political lean MEDSL · Snohomish
- 2024 margin
- D (+19.0) · D 57.8% · R 38.9% · Other 3.3%
- 2008→2024 swing
- +0.1pp no change · 2008: 18.9pp · 2024: 19.0pp
- All cycles
- 2024: D+19.0 2020: D+20.6 2016: D+16.6 2012: D+16.2 2008: D+18.9
Not yet ingested
- Civics
- —
Market trends
- HPI YoY
- ▼ -914.47%
- Current HPI
- 354.9913
- Rent YoY
- ▲ 2.25%
- Metro
- Seattle-Tacoma-Bellevue, WA
- State GDP YoY
- ▲ 4.65%
- F500 in state
- 22
Industry mix (Fortune 500 HQ in WA)
| Industry | F500 HQs | Revenue |
|---|---|---|
| Retail | 2 | $269B |
|
||
| Technology / Retail | 1 | $638B |
|
||
| Technology | 1 | $245B |
|
||
| Telecommunications | 1 | $38B |
|
||
| Food / Beverage | 1 | $36B |
|
||
| Automotive / Trucks | 1 | $34B |
|
||
Price history
-8.7% since first listed3 events — show timeline
- 2025-12-17 Price Changed $105,000 NWMLS as Distributed by MLS Grid
- 2025-08-28 Price Changed $107,500 NWMLS as Distributed by MLS Grid
- 2025-07-04 Listed $115,000 NWMLS as Distributed by MLS Grid
Property tax history
+10.8%/yrLatest (2026): $144 · +24.6% YoY. Source: county tax records.
Cash-flow waterfall
monthlySold comps — $/sqft
last 12 mo · ≤1 miLoading sold comps…