 Duplex
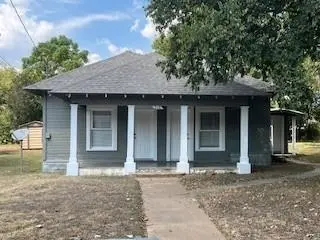
208 Graham St · Cleburne, TX
Flood risk 3/10 · Minor
- FEMA flood zone
- X (unshaded)
- Chance of flooding over 30 yrs
- 0.2%
- Est. flood insurance / yr
- $507 – $1,088
Fire risk 5/10 · Moderate
- Est. fire insurance / yr
- $1,222 – $2,270
Heat risk 7/10 · Major
- Hot days now (above 109°F)
- 7 days/yr
- Hot days in 30 yrs
- 22 days/yr
Wind risk 6/10 · Moderate
- Chance of severe wind over 30 yrs
- 27.0%
Air-quality risk 2/10 · Minimal
- Unhealthy air days now
- 1 days/yr
- Unhealthy air days in 30 yrs
- 2 days/yr
Risk factors via First Street. Map © Google.
Why this score? — see what drove the D- grade
The composite is a weighted blend of 9 inputs, each scored 0–100. Each bar is that input's sub-score; the figure is the points it added to the 100-point composite (weight × sub-score).
- Cash flow +12.9/30.0
- ARV discount +7.1/15.0
- DSCR +3.9/10.0
- 1% rule +3.7/10.0
- Livability +3.4/5.0
- Schools +2.9/10.0
- Condition / age +2.5/5.0
- Rent growth +2.3/5.0
- Appreciation +0.0/10.0
$255,000
🖨 Deal sheet (PDF) 📄 Offer letter ✓ Due diligence
Multi-family units
County records classify this as Multi-Family (2-4 Unit). Listing-text estimate: 2 units. confirmed
Listing remarks MLS
FULL DUPLEX, LARGE ROOMS EACH APARTMENT IS 1 BEDROOM 1 BATH EACH WITH OWN BACK YARD. NO CENTRAL HEAT AND AC. SEPARATE WATER, ELECTRIC. ACTUAL AGE IS UNKNOWN BUYER AND BUYER'S AGENT TO VERIFY TAXES, SCHOOLS, RESTRICTIONS, ZONING, MEASUREMENTS AND INSURANCE. SELLER WILL CONSIDER SLLER FINANCE WITH DOWN PAYMENT AND ACCEPTABLE OFFER FOR SELLER.
Key facts
- 8,843 sq ft lot
- 4 parking spots
- Listed 245 days
Neighborhood map
What this means for you Summary
Snapshot
- This is a 2 × 1-bed/1-bath units multifamily listed at $255k.
Deal economics
- At list price, monthly cash flow is $-18 ($-213/yr) — negative. Per door: $-9/mo.
- To cash-flow at today's rent, offer at most $252k (1.2% below list).
- To meet the 1% rule (rent ≥ 1% of price), the offer needs to be $221k (13.4% below list).
- Recommended offer: $221k (13.4% below list) — sets the bar for 1% rule.
- Cap rate 6.2% vs local median 3.6% in Cleburne — top-decile yield for the area; either an underpriced asset or a hidden risk that comps aren't pricing in. Stress-test before assuming the spread holds.
Location & tenants
- Location reads 68/100 on livability (#460 in TX) — a middle-class / working-renter tenant base. Strengths: cost of living A+, housing A+, health & safety A+; Watch: employment C-, amenities F, commute F.
- Cleburne ISD (town): math 34% / reading 33% proficiency, ranked #537 of 826 in TX (top 65%) — families likely to look elsewhere, expect single-tenant / working-renter base with shorter leases.
- Zoned schools: Cooke El (math 39% / reading 31%, grade F, #1,965 of 4,322 statewide, top 46%, 630 students, 84% FRL); Ad Wheat Middle (math 31% / reading 29%, grade F, #1,056 of 1,662 statewide, top 65%, 703 students, 76% FRL); Cleburne H S (math 46% / reading 38%, grade F, #730 of 1,632 statewide, top 47%, 1,976 students, 67% FRL) — zoned schools average 76% FRL vs 56% district-wide (20 pts higher); higher-poverty schools than district average — tighter screening recommended.
- Market conditions: Rents soft (-0.8%/yr); 665 active listings in the ZIP; 40 comparable units currently listed for rent nearby; rentals at typical pace (median 27d on market — plan ~3-4 weeks tenant-placement turnaround); solid renter incomes; 2,152 units permitted in Johnson County in 2024 (76 in 5+ unit buildings).
- This rent runs 35% of the median local income ($76k/yr) — at the standard rent-burdened threshold; future hikes will face affordability resistance.
Forward outlook
- Local home prices are declining (-3.0%/yr); year-one equity from $2k of loan paydown is wiped out by about $8k of value loss. Plan a longer hold.
- Johnson County population projected at +24% by 2050 — long-run rental-demand tailwind backs the buy-and-hold thesis.
Negotiation context
- It's been on market 245 days — a 12% lower offer ($224k) is reasonable based on typical stale-listing flexibility.
- 6 sale attempts since 16y ago with the ask held roughly flat each time — persistent listings suggest the price (not the market) is what's stuck; bring a comps-based counter.
Risks & watch-outs
- Climate carrying-cost: major wind risk, 27% chance of damaging wind over 30y; moderate wildfire risk; extreme-heat days projected 7→22/yr by 2055 (HVAC capex compounding) — expect insurance premiums to compound above CPI over the hold.
Questions for the listing agent
- What do current leases actually rent for vs. the listed asking? Can we see a recent rent roll and the last 12 months of T-12 income?
- It's been on market 245 days. Have you received any prior offers? Is the seller open to a 13% concession, seller financing, or rate buy-down credit?
- Can we see the unit-by-unit rent roll, current vacancy, and any below-market leases? What's the average tenancy length?
- What capital expenditures (roof, boiler, parking lot, exteriors) have been made in the last 5 years, and what's planned in the next 2?
- Why hasn't it sold? Are there any deal-killer items the seller is aware of (foundation, flood, title, zoning, code violations)?
- Is there a deadline driving the sale (1031 exchange, divorce, estate, relocation)? That informs how much negotiation room exists.
- Schools are F-rated, which usually means shorter tenancies and higher turnover. Who's the typical renter profile here, and what's been the actual vacancy rate?
- The area grade is low — what's the realistic commute time and amenity access for the typical tenant pool here? Any planned neighborhood developments (good or bad) we should know about?
- What's the average days-on-market for RENTAL listings here right now (not sales)? A rising rental-DOM trend means longer vacancies and softer asking-rent achievability than the comps imply.
- What's the recent tenant-quality profile in this submarket — average credit score on applications, eviction rate, late-payment / NSF rate, and stable-employment percentage? A property-management company in the area should have these aggregated.
- How much new apartment / multifamily construction is in the pipeline within 1–3 miles? Heavy new supply (>2% of stock underway) typically softens rents 12–24 months out; light construction supports rent growth.
Investment metrics
- 1% rule
- 0.87% ✗
- Cap rate
- 6.21%
- Cash-on-cash
- -0.30%
- DSCR
- 0.99
- GRM
- 9.6
CMA / ARV
- ARV (median comp)
- $252,754
- List price
- $255,000
- Delta
- 0.89%
- Verdict
- FAIR
- Comps
- 3 within 1.0 mi
Show comp detail 1 sale within ~0.75 mi
| Address | Dist | Beds/Ba | Sqft | Sold | Price | $/sf | Match |
|---|---|---|---|---|---|---|---|
| 122 Ramsey Ave | 0.60mi | 4/2.0 (+1) | 1,660 (+15%) | 22mo | $269,900 | $163 | 25 |
Match score weights: distance 35% · size 25% · config 20% · recency 20%. Top-matched comps best support the ARV.
Projected returns pro-forma
-3.0% appreciation · 0.0% rent growth · sell at horizon
- IRR
- -20.2%
- Equity multiple
- 0.32×
- Total profit
- $-48,894
- Equity at exit
- $38,021
- IRR
- -21.7%
- Equity multiple
- 0.03×
- Total profit
- $-68,916
- Equity at exit
- $22,048
Cash invested: $71,400 (down + closing). Projections, not guarantees.
Landlord ↔ Tenant lean methodology
- Overall (STATE)
- 87 Strongly Landlord-Friendly
- State Texas
- 87 Strongly Landlord-Friendly · R+5
- County
- — inherits STATE
- City
- — inherits STATE
ZIP-level market 76033
- Rents YoY
- -0.8%
- Active inventory
- 665
- Price-to-rent
- 19.2×
Monthly cashflow live
- Estimated rent
- $2,209 high interval (Pro) →
- Mortgage (P&I)
- −$1,337
- Tax from tax record
- −$319 /mo · $3,833/yr
- Insurance
- −$106
- HOA
- −$0
- Vacancy / Maint / Mgmt
- −$464
- Net cashflow
- $-18
Break-even live
Sensitivity live
| Price | -10% $127 | -5% $54 | +0% $-18 | +5% $-90 | +10% $-162 |
|---|---|---|---|---|---|
| Rent | -10% $-192 | -5% $-105 | +0% $-18 | +5% $69 | +10% $157 |
| Rate | -1.0pp $111 | -0.5pp $47 | base $-18 | +0.5pp $-84 | +1.0pp $-151 |
2-unit breakdown (identical units grouped — click to expand)
| Units | Beds | Baths | Est. rent |
|---|---|---|---|
| 2× units | 1 | 1 | $2,210 |
| #1 | 1 | 1 | $1,105 |
| #2 | 1 | 1 | $1,105 |
| Total (2 units) | $2,209 | ||
UW: 25.0% down · 7.5% · 30yr · 1.5% tax · 5.0% vac · 8.0% maint · 8.0% mgmt
Financing live
Cash to close
- Down payment
- $63,750
- Closing costs
- $7,650
- Reserves months
- —
- Total cash needed
- —
Loan-product check · same deal, 3 products live
Conventional
25% down · 7.5% · 30yr
- Down + closing
- —
- Monthly P&I
- —
- Monthly cashflow
- —
- DSCR
- —
- Eligible?
- —
Personal DTI + credit; lowest rate.
DSCR
20% down · 8.5% · 30yr
- Down + closing
- —
- Monthly P&I
- —
- Monthly cashflow
- —
- DSCR
- —
- Eligible?
- —
No personal income docs; deal must DSCR.
Hard money
10% down · 12.0% · 12mo
- Down + closing
- —
- Monthly P&I
- —
- Monthly cashflow
- —
- DSCR
- —
- Eligible?
- —
Short-term bridge; refi at stabilization.
Rent comps 40 comps
| Address | Beds | Baths | Sqft | Rent | $/sqft | DOM | Units | Dist |
|---|---|---|---|---|---|---|---|---|
| 1005 N Buffalo Ave Cleburne, TX | 3.0 | 1.0 | 1146 | $1,500 | $1.31 | 45d | 1 | 0.14mi |
| 1005 N Buffalo Ave Cleburne, TX | 3.0 | 1.0 | 1146 | $1,500 | $1.31 | 5d | 1 | 0.14mi |
| 1005 N Buffalo Ave Cleburne, TX | 3.0 | 1.0 | 1146 | $1,500 | $1.31 | 26d | 1 | 0.14mi |
| 114 Scurlock Ave Cleburne, TX | 4.0 | 2.0 | 1457 | $1,770 | $1.21 | 45d | 1 | 0.21mi |
| 103 May Ave Cleburne, TX | 3.0 | 2.0 | 1262 | $1,795 | $1.42 | 8d | 1 | 0.37mi |
| 104 May Ave Cleburne, TX | 3.0 | 2.0 | 1164 | $1,550 | $1.33 | 45d | 1 | 0.39mi |
| 901 N Border St Unit A Cleburne, TX | 2.0 | 1.0 | 900 | $950 | $1.06 | 45d | 1 | 0.41mi |
| 1005 Granbury St Unit A Cleburne, TX | 3.0 | 2.0 | 1362 | $2,050 | $1.51 | 26d | 1 | 0.49mi |
| 226 Seclusion Dr Cleburne, TX | 3.0–4.0 | 2.0 | 1641 | $2,205 | $1.34 | 0d | 1 | 0.49mi |
| 514 Euclid St Cleburne, TX | 3.0 | 2.0 | 1152 | $1,595 | $1.38 | 45d | 1 | 0.50mi |
| 612 N Robinson St Cleburne, TX | 3.0 | 2.5 | 1311 | $2,200 | $1.68 | 45d | 1 | 0.52mi |
| 112 W Wilson St Cleburne, TX | 2.0 | 1.0 | 1002 | $1,400 | $1.40 | 45d | 1 | 0.54mi |
| 110 E Wilson St Unit B Cleburne, TX | 3.0 | 2.5 | 1400 | $1,900 | $1.36 | 26d | 1 | 0.56mi |
| 122 Ramsey St #124 Cleburne, TX | 2.0 | 1.0 | 880 | $1,050 | $1.19 | 24d | 1 | 0.57mi |
| 122 Ramsey Ave Cleburne, TX | 2.0 | 1.0 | 880 | $1,050 | $1.19 | 1d | 1 | 0.57mi |
| 400 Phillips St Cleburne, TX | 2.0–3.0 | 1.0–1.5 | 1000 | $1,581 | $1.58 | 0d | 4 | 0.57mi |
| 1405 Granbury St Cleburne, TX | 3.0 | 1.0 | 1278 | $1,545 | $1.21 | 26d | 1 | 0.59mi |
| 405 Madison St Unit Na Cleburne, TX | 3.0 | 2.0 | 1645 | $1,975 | $1.20 | 45d | 1 | 0.60mi |
| 1507 Granbury St Cleburne, TX | 3.0 | 2.0 | 1140 | $1,811 | $1.59 | 26d | 1 | 0.63mi |
| 1606 Granbury St Unit A Cleburne, TX | 3.0 | 2.0 | 1289 | $1,650 | $1.28 | 14d | 1 | 0.65mi |
| 404 Rose Ave Cleburne, TX | 4.0 | 2.0 | 1763 | $2,225 | $1.26 | 1d | 1 | 0.71mi |
| 1308 N Brazos Ave Cleburne, TX | 3.0 | 2.0 | 1028 | $1,595 | $1.55 | 26d | 1 | 0.72mi |
| 413 Shaw St Cleburne, TX | 4.0 | 2.0 | 1713 | $2,100 | $1.23 | 45d | 1 | 0.72mi |
| 1610 N Anglin St Cleburne, TX | 3.0 | 1.0 | 900 | $1,500 | $1.67 | 20d | 1 | 0.72mi |
| 414 Rose Ave Cleburne, TX | 4.0 | 2.0 | 1763 | $2,214 | $1.26 | 4d | 1 | 0.73mi |
| 805 N Douglas Ave Cleburne, TX | 3.0 | 2.0 | 1460 | $1,999 | $1.37 | 45d | 1 | 0.77mi |
| 1108 Poindexter Ave Cleburne, TX | 3.0 | 1.0 | 1300 | $1,550 | $1.19 | 45d | 1 | 0.79mi |
| 438 Sabine Ave Cleburne, TX | 3.0 | 2.0 | 1230 | $1,650 | $1.34 | 14d | 1 | 0.82mi |
| 1315 Joslin St Cleburne, TX | 3.0 | 2.0 | 1294 | $1,595 | $1.23 | 9d | 1 | 0.85mi |
| 1705 N Robinson St Cleburne, TX | 3.0 | 1.5 | 1076 | $1,450 | $1.35 | 1d | 1 | 0.87mi |
| 1705 N Robinson St Cleburne, TX | 3.0 | 2.0 | 1076 | $1,450 | $1.35 | 26d | 1 | 0.87mi |
| 521 Woodard Ave Unit One Cleburne, TX | 2.0 | 1.0 | 1350 | $1,000 | $0.74 | 45d | 1 | 0.90mi |
| 1904 Starling Ct Cleburne, TX | 2.0 | 1.0 | 1007 | $1,150 | $1.14 | 45d | 1 | 0.95mi |
| 1904 Starling Ct Unit 1 Cleburne, TX | 2.0 | 1.0 | 1007 | $1,150 | $1.14 | 22d | 1 | 0.95mi |
| 303 Eastland St Cleburne, TX | 3.0 | 3.0 | 1254 | $1,950 | $1.56 | 45d | 1 | 0.96mi |
| 318 College St Unit B Cleburne, TX | 2.0 | 1.0 | 1256 | $1,150 | $0.92 | 26d | 1 | 0.98mi |
| 907 Hodge St Cleburne, TX | 2.0 | 1.0 | 912 | $1,450 | $1.59 | 5d | 1 | 0.99mi |
| 405 College St Cleburne, TX | 3.0 | 2.0 | 1396 | $1,650 | $1.18 | 8d | 1 | 1.01mi |
| 1108 Williams Ave Unit H Cleburne, TX | 2.0 | 1.0 | 900 | $900 | $1.00 | 26d | 1 | 1.02mi |
| 1106 Williams Ave Unit D Cleburne, TX | 2.0 | 1.0 | 900 | $900 | $1.00 | 26d | 1 | 1.02mi |
Listing history 35 events
-
2026-06-21days on market $255,000 Active 245 DOM
-
2026-06-18days on market $255,000 Active 242 DOM
-
2026-06-17days on market $255,000 Active 241 DOM
-
2026-06-16days on market $255,000 Active 240 DOM
-
2026-06-15days on market $255,000 Active 239 DOM
-
2026-06-13days on market $255,000 Active 237 DOM
-
2026-06-09days on market $255,000 Active 233 DOM
-
2026-06-08days on market $255,000 Active 232 DOM
-
2026-06-07days on market $255,000 Active 231 DOM
-
2026-06-04days on market $255,000 Active 228 DOM
-
2026-06-03days on market $255,000 Active 227 DOM
-
2026-06-02days on market $255,000 Active 226 DOM
-
2026-06-01days on market $255,000 Active 225 DOM
-
2026-05-31days on market $255,000 Active 224 DOM
-
2026-04-17price $255,000 345-char remark
Show marketing remark (345 chars)
FULL DUPLEX, LARGE ROOMS EACH APARTMENT IS 1 BEDROOM 1 BATH EACH WITH OWN BACK YARD. NO CENTRAL HEAT AND AC. SEPARATE WATER, ELECTRIC. ACTUAL AGE IS UNKNOWN BUYER AND BUYER'S AGENT TO VERIFY TAXES, SCHOOLS, RESTRICTIONS, ZONING, MEASUREMENTS AND INSURANCE. SELLER WILL CONSIDER SLLER FINANCE WITH DOWN PAYMENT AND ACCEPTABLE OFFER FOR SELLER.
-
2025-10-18$265,000 Active 345-char remark
Show marketing remark (345 chars)
FULL DUPLEX, LARGE ROOMS EACH APARTMENT IS 1 BEDROOM 1 BATH EACH WITH OWN BACK YARD. NO CENTRAL HEAT AND AC. SEPARATE WATER, ELECTRIC. ACTUAL AGE IS UNKNOWN BUYER AND BUYER'S AGENT TO VERIFY TAXES, SCHOOLS, RESTRICTIONS, ZONING, MEASUREMENTS AND INSURANCE. SELLER WILL CONSIDER SLLER FINANCE WITH DOWN PAYMENT AND ACCEPTABLE OFFER FOR SELLER.
-
2014-06-12soldstatus Closed 135-char remark
Show marketing remark (135 chars)
FULL DUPLEX, VERY LARGE ROOMS EACH APARTMENT IS 1 BEDROOM 1 BATH EACH WITH OWN BACK YARD. NO CENTRAL HEAT AND AC. OWNER PAYS WATER BILL
-
2014-03-28status Pending 135-char remark
Show marketing remark (135 chars)
FULL DUPLEX, VERY LARGE ROOMS EACH APARTMENT IS 1 BEDROOM 1 BATH EACH WITH OWN BACK YARD. NO CENTRAL HEAT AND AC. OWNER PAYS WATER BILL
-
2014-03-28price $39,900 135-char remark
Show marketing remark (135 chars)
FULL DUPLEX, VERY LARGE ROOMS EACH APARTMENT IS 1 BEDROOM 1 BATH EACH WITH OWN BACK YARD. NO CENTRAL HEAT AND AC. OWNER PAYS WATER BILL
-
2014-03-15status Active 135-char remark
Show marketing remark (135 chars)
FULL DUPLEX, VERY LARGE ROOMS EACH APARTMENT IS 1 BEDROOM 1 BATH EACH WITH OWN BACK YARD. NO CENTRAL HEAT AND AC. OWNER PAYS WATER BILL
-
2014-02-27historical Active Option Contract 135-char remark
Show marketing remark (135 chars)
FULL DUPLEX, VERY LARGE ROOMS EACH APARTMENT IS 1 BEDROOM 1 BATH EACH WITH OWN BACK YARD. NO CENTRAL HEAT AND AC. OWNER PAYS WATER BILL
-
2013-10-15price $45,000 135-char remark
Show marketing remark (135 chars)
FULL DUPLEX, VERY LARGE ROOMS EACH APARTMENT IS 1 BEDROOM 1 BATH EACH WITH OWN BACK YARD. NO CENTRAL HEAT AND AC. OWNER PAYS WATER BILL
-
2013-06-20$53,900 Active 135-char remark
Show marketing remark (135 chars)
FULL DUPLEX, VERY LARGE ROOMS EACH APARTMENT IS 1 BEDROOM 1 BATH EACH WITH OWN BACK YARD. NO CENTRAL HEAT AND AC. OWNER PAYS WATER BILL
-
2012-10-24soldstatus
-
2012-10-17soldstatus Closed
-
2012-10-04status Pending
-
2012-09-21status Active
-
2012-09-19historical
-
2012-05-16$40,000 Active
-
2011-07-27historical
-
2011-02-11price $49,500
-
2010-08-28$68,000 Active
-
2005-04-11soldstatus
-
2005-04-11soldstatus
-
2003-04-14soldstatus
ⓘ Source: listings_history table (triggers on properties + properties_extension) + one-shot
backfill from property_details.listing_events for pre-trigger history.
Tax reassessment forecast TX · Resets to sale price
- Current annual tax
- $3,833 · $319/mo
- Projected year-2 tax
- $4,666 · $389/mo
- Expected delta
- +$834/yr (+$69/mo · 21.8%)
ⓘ Screening estimate from a state-policy table — verify with the county assessor before closing.
Climate risk First Street
- Flood 3/10 Moderate FEMA zone X (unshaded) · 20% chance over 30 yrs
- Wildfire 5/10 Major
- Heat 7/10 Severe 7 d/yr ≥109°F today · 22 d/yr by 30 yrs out
- Wind 6/10 Major 27% chance of damaging wind over 30 yrs
- Air quality 2/10 Low 1 unhealthy d/yr today · 2 by 30 yrs out
Nearby sold comps map
Loading sold comps map…
Walkable amenities ~0.75 mi
Loading nearby amenities…
Taxation est. · year 1
- Rental income
- $26,508
- − Mortgage interest
- −$14,284
- − Property taxes
- −$3,833
- − Insurance
- −$1,275
- − Repairs & maintenance
- −$2,121
- − Management
- −$2,121
- − Depreciation
- −$7,418
- Taxable loss
- −$4,543
- Est. tax savings @ 24.0%
- +$1,090
- After-tax cash flow
- $877/yr
For passive investors: Depreciation is non-cash, so a rental often shows a tax loss while cash-flowing — sheltering income. Rental losses are passive: they offset passive income freely, and up to $25,000/yr can offset ordinary (W-2) income if you actively participate and your MAGI is under $100k (phasing out to $0 by $150k); unused losses carry forward. On sale, claimed depreciation is recaptured at up to 25%, and gains may owe capital-gains tax (a 1031 exchange can defer both). Figures are a year-1 estimate at your 24.0% rate — not tax advice; consult a CPA.
Schools (NCES district)
- District
- Cleburne ISD
- NCES district ID
- 4814310
- Math proficiency
- 34% ▼ -2.00%
- Reading proficiency
- 33% ▼ -2.00%
- Median HH income
- $48,788
- Composite
- 29.0/100
- National rank
- #6618
- State rank
- #537 of 826 in TX
Livability — Cleburne
- Score
- 68/100
- State rank
- #460
- US rank
- #9292
Category grades
Schools grade is shown separately in the Schools card above.
Census & demographics
- Census place
- Cleburne, TX
- County
- Johnson County · 147,987 people
- City population
- 29,538
- Metro
- Dallas-Fort Worth-Arlington, TX
- Population (ZIP)
- 29,538
- Household income
- $76,292
- Rent vs Own
- Severe rent burden
- 927.0
Population outlook (Johnson County) Hauer SSP2
- Today (2025)
- 179,678 people
- By 2030
- 189,208 · +5.3%
- By 2040
- 207,261 · +15.4%
- By 2050
- 223,064 · +24.1%
- By 2075
- 259,979 · +44.7%
- By 2100
- 275,395 · +53.3%
Race, ethnicity, and origin ACS 2023
- Neighborhood character
- Majority White (64%)
- Race & ethnicity
- White 64% Hispanic / Latino 26% Two or more races 15% Black 4% Native American 1%
- Hispanic origin (detail)
- Mexican 23%
- Common ancestry
- Slovak 2% Italian 2% Portuguese 1%
- Foreign-born
- 8% · Canada, Guatemala, Vietnam
- Languages at home
- 81% English-only · Spanish 17% Other Asian/Pacific 2%
Political lean MEDSL · Johnson
- 2024 margin
- Solid R (+51.4) · D 23.9% · R 75.3%
- 2008→2024 swing
- -3.9pp toward R · 2008: -47.5pp · 2024: -51.4pp
- All cycles
- 2024: R+51.4 2020: R+53.0 2016: R+58.3 2012: R+55.6 2008: R+47.5
Not yet ingested
- Civics
- —
Market trends
- HPI YoY
- ▼ -202.75%
- Current HPI
- 246.0029
- Rent YoY
- ▼ -0.83%
- Metro
- Dallas-Fort Worth-Arlington, TX
- State GDP YoY
- ▲ 3.95%
- F500 in state
- 110
Industry mix (Fortune 500 HQ in TX)
| Industry | F500 HQs | Revenue |
|---|---|---|
| Energy | 16 | $1,198B |
|
||
| Technology | 5 | $198B |
|
||
| Engineering / Construction | 4 | $72B |
|
||
| Energy Services | 3 | $60B |
|
||
| Utilities | 3 | $41B |
|
||
| Healthcare | 2 | $330B |
|
||
Price history
+275.0% since first listed21 events — show timeline
- 2026-04-17 Price Changed $255,000 NTREIS
- 2025-10-18 Listed $265,000 NTREIS
- 2014-06-12 Sold (MLS) — NTREIS
- 2014-03-28 Pending — NTREIS
- 2014-03-28 Price Changed $39,900 NTREIS
- 2014-03-15 Relisted — NTREIS
- 2014-02-27 Contingent — NTREIS
- 2013-10-15 Price Changed $45,000 NTREIS
- 2013-06-20 Listed $53,900 NTREIS
- 2012-10-24 Sold (Public Records) — Public Records
- 2012-10-17 Sold (MLS) — NTREIS
- 2012-10-04 Pending — NTREIS
- 2012-09-21 Relisted — NTREIS
- 2012-09-19 Listing Removed — NTREIS
- 2012-05-16 Listed $40,000 NTREIS
- 2011-07-27 Listing Removed — NTREIS
- 2011-02-11 Price Changed $49,500 NTREIS
- 2010-08-28 Listed $68,000 NTREIS
- 2005-04-11 Sold (Public Records) — Public Records
- 2005-04-11 Sold (Public Records) — Public Records
- 2003-04-14 Sold (Public Records) — Public Records
Property tax history
+12.0%/yrLatest (2025): $3,833 · +21.8% YoY. Source: county tax records.
Cash-flow waterfall
monthlySold comps — $/sqft
last 12 mo · ≤1 miLoading sold comps…