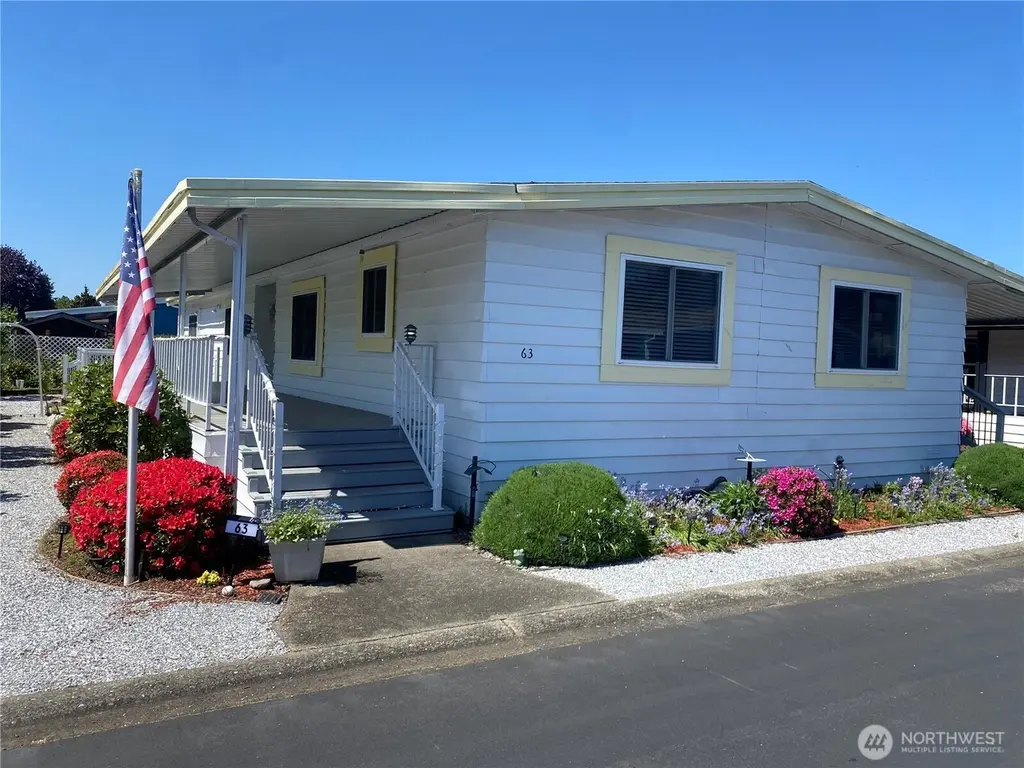
3611 I St NE #63 · Auburn, WA
Flood risk 5/10 · Moderate
- FEMA flood zone
- AH
- Chance of flooding over 30 yrs
- 0.27%
- Est. flood insurance / yr
- $1,142 – $2,507
Fire risk 1/10 · Minimal
- Est. fire insurance / yr
- $604 – $1,122
Heat risk 4/10 · Minor
- Hot days now (above 87°F)
- 7 days/yr
- Hot days in 30 yrs
- 16 days/yr
Wind risk 1/10 · Minimal
- Chance of severe wind over 30 yrs
- —
Air-quality risk 7/10 · Major
- Unhealthy air days now
- 10 days/yr
- Unhealthy air days in 30 yrs
- 11 days/yr
Risk factors via First Street. Map © Google.
Why this score? — see what drove the B grade
The composite is a weighted blend of 9 inputs, each scored 0–100. Each bar is that input's sub-score; the figure is the points it added to the 100-point composite (weight × sub-score).
- Cash flow +30.0/30.0
- DSCR +10.0/10.0
- ARV discount +9.2/15.0
- 1% rule +8.6/10.0
- Schools +4.7/10.0
- Livability +4.0/5.0
- Rent growth +2.9/5.0
- Condition / age +2.5/5.0
- Appreciation +0.0/10.0
$174,500
🖨 Deal sheet 📄 Offer letter ✓ Due diligence
Key facts
- 2 parking spots
- Community pool
- Built 1978
Property features AI
Finance
- Other: Bus line nearby
- Financial info: Listing terms: Cash, Conventional
- HOA & community: Located in The River Mobile Estates (park approved for sale); Senior community; Park amenities include clubhouse, common area, laundry, pool, recreational area, RV parking, sauna, spa/hot tub; Approximately 312 homes in the park; Pets allowed: cats and dogs; Land lease: $1,000
Exterior
- Parking: Carport
- Utilities: Public water (in HOA dues); Public sewer (in HOA dues); Electric service by PSE; Energy sources: Electric and wood
- Home design: Manufactured home (double wide); One story; Model: GOLM 66-28; Make: Golden West Mobile; Tie-down foundation
- Construction: Metal/vinyl construction; Composition roof
- Exterior features: Metal/vinyl exterior; Awnings; Landscaped; Patio/porch/deck; Vaulted ceilings; Walk-in closet
Interior
- Kitchen: Dishwasher; Garbage disposal; Microwave; Refrigerator; Stove/Range
- Bedrooms: 3 bedrooms
- Flooring: Ceramic tile; Laminate
- Bathrooms: 1 full bath; 1 three-quarter bath
- Heating & cooling: High-efficiency heating (90%+); Forced air; Heat pump; Central air
- Interior features: Fireplace (wood burning)
- Laundry & utility: Washer; Dryer; Utility room
Neighborhood map
What this means for you Summary
Snapshot
- This is a 3-bed/2.0-bath manufactured listed at $174k.
Deal economics
- At list price, monthly cash flow is $513 ($6k/yr) — positive.
- The deal already cash-flows at list — no discount required.
- Meets the 1% rule at list price ($2k rent vs $174k).
- Cap rate 10.9% vs local median 2.7% in Auburn — top-decile yield for the area; either an underpriced asset or a hidden risk that comps aren't pricing in. Stress-test before assuming the spread holds.
Location & tenants
- Location reads 81/100 on livability (#75 in WA, #1,371 nationally) — a professional / high-income tenant draw. Strengths: amenities A+, commute A+, employment A+; Watch: crime F, cost of living F.
- Auburn School District (urban): math 47% / reading 56% proficiency, ranked #125 of 291 in WA (top 43%) — acceptable for families but not a draw, mixed tenant base, ~2y average lease.
- Market conditions: Rents rising (+1.5%/yr); 171 active listings in the ZIP; 5 comparable units currently listed for rent nearby; rentals at typical pace (median 22d on market — plan ~3-4 weeks tenant-placement turnaround); solid renter incomes; 10,555 units permitted in King County in 2024 (7,119 in 5+ unit buildings).
- This rent runs 36% of the median local income ($79k/yr) — at the standard rent-burdened threshold; future hikes will face affordability resistance.
Forward outlook
- Local home prices are declining (-3.0%/yr); year-one equity from $1k of loan paydown is wiped out by about $5k of value loss. Plan a longer hold.
- King County population projected at +44% by 2050 — long-run rental-demand tailwind backs the buy-and-hold thesis.
Negotiation context
- Only 1 days on market — expect competitive offers; lowballing is unlikely to land.
- 2 sale attempts since 7y ago with the ask held roughly flat each time — persistent listings suggest the price (not the market) is what's stuck; bring a comps-based counter.
- Current owner paid $95k; list at $174k implies a 84% gain — meaningful room to come down on a strong offer.
Risks & watch-outs
- Watch-outs: flood insurance adds $152/mo.
- Climate carrying-cost: in FEMA flood zone AH (mandatory federal flood insurance) — expect insurance premiums to compound above CPI over the hold.
Questions for the listing agent
- Built in 1978 — when were the roof, HVAC, electrical panel, plumbing, and water heater last replaced?
- What's the actual annual flood-insurance premium (NFIP or private), and is the property in a SFHA with mandatory coverage?
- Is there a deadline driving the sale (1031 exchange, divorce, estate, relocation)? That informs how much negotiation room exists.
- Crime grade is F in this area — have there been break-ins, vandalism, or insurance claims at this property in the last 3 years? What carrier currently insures it and at what premium?
- What's the average days-on-market for RENTAL listings here right now (not sales)? A rising rental-DOM trend means longer vacancies and softer asking-rent achievability than the comps imply.
- What's the recent tenant-quality profile in this submarket — average credit score on applications, eviction rate, late-payment / NSF rate, and stable-employment percentage? A property-management company in the area should have these aggregated.
- How much new for-sale + rental construction is in the pipeline within 1–3 miles? Heavy new supply typically softens prices + rents 12–24 months out; constrained supply supports both.
Investment metrics
- 1% rule
- 1.36% ✓
- Cap rate
- 10.87%
- Cash-on-cash
- 16.33%
- DSCR
- 1.73
- GRM
- 6.1
CMA / ARV
- ARV (on-the-fly)
- $181,500
- Comps found
- 12
Show comp detail 12 sales within ~0.75 mi
| Address | Dist | Beds/Ba | Sqft | Sold | Price | $/sf | Match |
|---|---|---|---|---|---|---|---|
| 3611 I St NE #76 | 0.00mi | 3/2.0 | 1,900 (+5%) | 4mo | $120,000 | $63 | 89 |
| 3611 I St NE #184 | 0.00mi | 3/2.0 | 1,792 (-1%) | 15mo | $180,000 | $100 | 85 |
| 3611 I St NE #424 | 0.15mi | 2/2.0 (-1) | 1,792 (-1%) | 2mo | $210,000 | $117 | 84 |
| 3611 NE I St #257 | 0.00mi | 3/2.0 | 1,749 (-4%) | 13mo | $132,500 | $76 | 83 |
| 3611 I St NE #130 | 0.00mi | 3/2.0 | 1,820 (+0%) | 20mo | $146,000 | $80 | 82 |
| 3611 I St NE #302 | 0.20mi | 3/2.0 | 1,848 (+2%) | 12mo | $228,000 | $123 | 78 |
| 3611 I St NE #225 | 0.20mi | 3/2.0 | 1,800 (-1%) | 18mo | $170,000 | $94 | 74 |
| 3611 I St NE #160 | 0.33mi | 3/2.0 | 1,848 (+2%) | 16mo | $110,000 | $60 | 68 |
| 3611 I St NE #10 | 0.15mi | 3/2.0 | 2,040 (+12%) | 7mo | $183,000 | $90 | 66 |
| 3611 I St NE #133 | 0.33mi | 3/2.0 | 1,920 (+6%) | 15mo | $233,000 | $121 | 62 |
| 3611 I St NE #80 | 0.00mi | 2/2.0 (-1) | 1,612 (-11%) | 18mo | $189,900 | $118 | 62 |
| 3611 I St NE #247 | 0.00mi | 2/2.0 (-1) | 1,560 (-14%) | 14mo | $167,500 | $107 | 60 |
Match score weights: distance 35% · size 25% · config 20% · recency 20%. Top-matched comps best support the ARV.
Projected returns pro-forma
-3.0% appreciation · 1.51% rent growth · sell at horizon
- IRR
- 0.6%
- Equity multiple
- 1.02×
- Total profit
- $1,027
- Equity at exit
- $26,019
- IRR
- 8.5%
- Equity multiple
- 1.60×
- Total profit
- $29,557
- Equity at exit
- $15,088
Cash invested: $48,860 (down + closing). Projections, not guarantees.
Landlord ↔ Tenant lean methodology
- Overall (STATE)
- 28 Tenant-Leaning
- State Washington
- 28 Tenant-Leaning · D+8
- County
- — inherits STATE
- City
- — inherits STATE
ZIP-level market 98002
- Rents YoY
- 1.5%
- Active inventory
- 171
- Price-to-rent
- 6.1×
Monthly cashflow live
- Estimated rent
- $2,368 high interval (Pro) →
- Mortgage (P&I)
- −$915
- Tax est. 1.5%
- −$218 /mo · $2,618/yr
- Insurance
- −$73
- Flood insurance flood zone
- −$152 /mo · $1,824/yr
- HOA
- −$0
- Vacancy / Maint / Mgmt
- −$497
- Net cashflow
- $513
Break-even live
UW: 25.0% down · 7.5% · 30yr · 1.5% tax · 5.0% vac · 8.0% maint · 8.0% mgmt
Financing live
Cash to close
- Down payment
- $43,625
- Closing costs
- $5,235
- Reserves months
- —
- Total cash needed
- —
Loan-product check · same deal, 3 products live
Conventional
25% down · 7.5% · 30yr
- Down + closing
- —
- Monthly P&I
- —
- Monthly cashflow
- —
- DSCR
- —
- Eligible?
- —
Personal DTI + credit; lowest rate.
DSCR
20% down · 8.5% · 30yr
- Down + closing
- —
- Monthly P&I
- —
- Monthly cashflow
- —
- DSCR
- —
- Eligible?
- —
No personal income docs; deal must DSCR.
Hard money
10% down · 12.0% · 12mo
- Down + closing
- —
- Monthly P&I
- —
- Monthly cashflow
- —
- DSCR
- —
- Eligible?
- —
Short-term bridge; refi at stabilization.
Rent comps 5 comps
| Address | Beds | Baths | Sqft | Rent | $/sqft | DOM | Units | Dist |
|---|---|---|---|---|---|---|---|---|
| 4750 Auburn Way N Auburn, WA | 1.0–4.0 | 1.0–2.0 | 1011 | $2,417 | $2.39 | 1d | 10 | 0.70mi |
| 2317 I St NE Unit 2319 Auburn, WA | 3.0 | 2.0 | 1400 | $2,275 | $1.62 | 24d | 1 | 0.84mi |
| 2414 N St NE Unit C Auburn, WA | 3.0 | 1.0 | 1271 | $1,950 | $1.53 | 24d | 1 | 0.86mi |
| 1462 51st Pl NE Auburn, WA | 3.0 | 2.5 | 1539 | $2,900 | $1.88 | 2d | 1 | 0.98mi |
| 2025 M St NE Unit 2045 Auburn, WA | 2.0 | 1.5 | 1248 | $2,095 | $1.68 | 21d | 1 | 1.03mi |
Listing history 5 events
-
2026-04-29status Pending
-
2026-04-29$174,500 Active
-
2019-11-25soldstatus $95,000 Sold
-
2019-11-10status Pending
-
2019-10-11$107,000 Active
ⓘ Source: listings_history table (triggers on properties + properties_extension) + one-shot
backfill from property_details.listing_events for pre-trigger history.
Climate risk First Street
- Flood 5/10 Major FEMA zone AH · 27% chance over 30 yrs
- Wildfire 1/10 Low
- Heat 4/10 Moderate 7 d/yr ≥87°F today · 16 d/yr by 30 yrs out
- Wind 1/10 Low
- Air quality 7/10 Severe 10 unhealthy d/yr today · 11 by 30 yrs out
Nearby sold comps map
Loading sold comps map…
Walkable amenities ~0.75 mi
Loading nearby amenities…
Taxation est. · year 1
- Rental income
- $28,420
- − Mortgage interest
- −$9,775
- − Property taxes
- −$2,618
- − Insurance
- −$2,697
- − Repairs & maintenance
- −$2,274
- − Management
- −$2,274
- − Depreciation
- −$5,076
- Taxable income
- $3,707
- Est. tax owed @ 24.0%
- −$890
- After-tax cash flow
- $5,266/yr
For passive investors: Depreciation is non-cash, so a rental often shows a tax loss while cash-flowing — sheltering income. Rental losses are passive: they offset passive income freely, and up to $25,000/yr can offset ordinary (W-2) income if you actively participate and your MAGI is under $100k (phasing out to $0 by $150k); unused losses carry forward. On sale, claimed depreciation is recaptured at up to 25%, and gains may owe capital-gains tax (a 1031 exchange can defer both). Figures are a year-1 estimate at your 24.0% rate — not tax advice; consult a CPA.
Schools (NCES district)
- District
- Auburn School District
- NCES district ID
- 5300300
- Math proficiency
- 47% ▼ -3.00%
- Reading proficiency
- 56% ▼ -1.00%
- Median HH income
- $58,048
- Composite
- 46.73/100
- National rank
- #5240
- State rank
- #125 of 291 in WA
Livability — Auburn
- Score
- 81/100
- State rank
- #75
- US rank
- #1371
Category grades
Schools grade is shown separately in the Schools card above.
Census & demographics
- Census place
- Auburn, WA
- County
- King County · 2,251,916 people
- City population
- 74,969
- Metro
- Seattle-Tacoma-Bellevue, WA
- Population (ZIP)
- 37,509
- Household income
- $78,684
- Rent vs Own
- Severe rent burden
- 2202.0
Population outlook (King County) Hauer SSP2
- Today (2025)
- 2,576,485 people
- By 2030
- 2,803,316 · +8.8%
- By 2040
- 3,255,921 · +26.4%
- By 2050
- 3,706,444 · +43.9%
- By 2075
- 4,746,063 · +84.2%
- By 2100
- 5,407,730 · +109.9%
Race, ethnicity, and origin ACS 2023
- Neighborhood character
- Highly diverse neighborhood (Simpson 0.72)
- Race & ethnicity
- White 46% Hispanic / Latino 24% Two or more races 13% Black 12% Asian 6% Pacific Islander 4% Native American 2%
- Hispanic origin (detail)
- Mexican 20%
- Common ancestry
- Portuguese 4% Subsaharan African 4% Lithuanian 3%
- Foreign-born
- 24% · Canada, Vietnam
- Languages at home
- 63% English-only · Spanish 19% Russian/Polish/Slavic 6% Other Asian/Pacific 3%
Political lean MEDSL · King
- 2024 margin
- Solid D (+51.7) · D 74.2% · R 22.5% · Other 3.4%
- 2008→2024 swing
- +9.6pp toward D · 2008: 42.1pp · 2024: 51.7pp
- All cycles
- 2024: D+51.7 2020: D+52.7 2016: D+50.4 2012: D+39.9 2008: D+42.1
Not yet ingested
- Civics
- —
Market trends
- HPI YoY
- ▼ -677.96%
- Current HPI
- 298.0849
- Rent YoY
- ▲ 1.51%
- Metro
- Seattle-Tacoma-Bellevue, WA
- State GDP YoY
- ▲ 4.65%
- F500 in state
- 22
Industry mix (Fortune 500 HQ in WA)
| Industry | F500 HQs | Revenue |
|---|---|---|
| Retail | 2 | $269B |
|
||
| Technology / Retail | 1 | $638B |
|
||
| Technology | 1 | $245B |
|
||
| Telecommunications | 1 | $38B |
|
||
| Food / Beverage | 1 | $36B |
|
||
| Automotive / Trucks | 1 | $34B |
|
||
Price history
+63.1% since first listed5 events — show timeline
- 2026-04-29 Pending — NWMLS as Distributed by MLS Grid
- 2026-04-29 Listed $174,500 NWMLS as Distributed by MLS Grid
- 2019-11-25 Sold (MLS) $95,000 NWMLS as Distributed by MLS Grid
- 2019-11-10 Pending — NWMLS as Distributed by MLS Grid
- 2019-10-11 Listed $107,000 NWMLS as Distributed by MLS Grid
Cash-flow waterfall
monthlySold comps — $/sqft
last 12 mo · ≤1 miLoading sold comps…