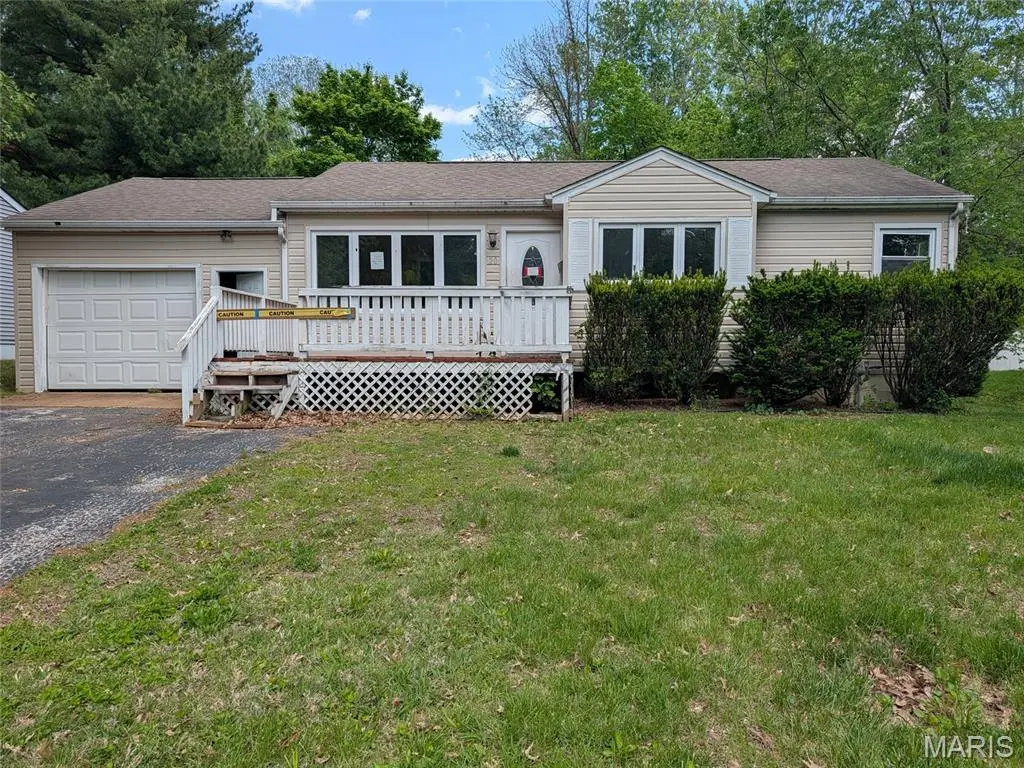
20 Marlo Dr · Belleville, IL
Flood risk 6/10 · Moderate
- FEMA flood zone
- X
- Chance of flooding over 30 yrs
- 0.69%
- Est. flood insurance / yr
- $473 – $860
Fire risk 1/10 · Minimal
- Est. fire insurance / yr
- $804 – $1,492
Heat risk 5/10 · Moderate
- Hot days now (above 107°F)
- 7 days/yr
- Hot days in 30 yrs
- 21 days/yr
Wind risk 2/10 · Minimal
- Chance of severe wind over 30 yrs
- 1.0%
Air-quality risk 4/10 · Minor
- Unhealthy air days now
- 3 days/yr
- Unhealthy air days in 30 yrs
- 6 days/yr
Risk factors via First Street. Map © Google.
Why this score? — see what drove the B grade
The composite is a weighted blend of 9 inputs, each scored 0–100. Each bar is that input's sub-score; the figure is the points it added to the 100-point composite (weight × sub-score).
- Cash flow +27.3/30.0
- ARV discount +13.6/15.0
- DSCR +9.5/10.0
- 1% rule +9.2/10.0
- Livability +3.9/5.0
- Rent growth +3.6/5.0
- Condition / age +2.5/5.0
- Schools +2.2/10.0
- Appreciation +0.0/10.0
$95,000
🖨 Deal sheet 📄 Offer letter ✓ Due diligence
Listing remarks MLS
MOVE RIGHT IN! TOTALLY FURNISHED!This 3 bedroom 2 bath home has lots of room with a large family in the lower level. Close to Scott AFB.
Key facts
- One car garage
- Wood floors
- Covered patio
Tags
Property features AI
Finance
- Financial info: Lease not considered
Exterior
- Parking: One-car garage (total parking for 1 vehicle)
- Utilities: Public water; Lagoon sewer; Electric service (other); Cable available
- Home design: Single family residence; One story
- Construction: Plaster construction
- Exterior features: Infill lot
Interior
- Bedrooms: Three bedrooms on the main level
- Bathrooms: One full bathroom on the main level
- Interior features: Forced air heating; Ceiling fan(s); Central air conditioning; Basement (other)
Neighborhood map
What this means for you Summary
Snapshot
- This is a 3-bed/2.0-bath single-family listed at $95k.
Deal economics
- At list price, monthly cash flow is $275 ($3k/yr) — positive.
- The deal already cash-flows at list — no discount required.
- Meets the 1% rule at list price ($1k rent vs $95k).
- Recommended offer: $92k (3.0% below list) — sets the bar for market timing.
- Cap rate 9.8% vs local median 5.6% in Belleville — top-decile yield for the area; either an underpriced asset or a hidden risk that comps aren't pricing in. Stress-test before assuming the spread holds.
Location & tenants
- Location reads 78/100 on livability (#142 in IL, #2,604 nationally) — a middle-class / working-renter tenant base. Strengths: commute A+, cost of living A+, housing A+; Watch: crime F, amenities D-.
- Belleville Twp Hsd 201 (suburban): math 21% / reading 28% proficiency, ranked #308 of 620 in IL (top 50%) — low school quality limits family demand, transient renter base, plan for 1-2y turnover.
- Zoned schools: Belleville High School-East (math 23% / reading 30%, grade F, #241 of 693 statewide, top 35%, 2,568 students, 0% FRL).
- Market conditions: Rents rising fast (+4.6%/yr); 190 active listings in the ZIP; 11 comparable units currently listed for rent nearby; rentals at typical pace (median 24d on market — plan ~3-4 weeks tenant-placement turnaround); 783 units permitted in St. Clair County in 2024 (378 in 5+ unit buildings).
Forward outlook
- Local home prices are declining (-3.0%/yr); year-one equity from $657 of loan paydown is wiped out by about $3k of value loss. Plan a longer hold.
- St. Clair County population projected at -23% by 2050 — secular population decline; favor cash flow + early exit over multi-decade hold.
- At projected returns (-3.0% appreciation + 4.6% rent growth), your $27k cash investment doubles in ~8 years — after that, you're playing with house money.
Negotiation context
- It's been on market 43 days — a 3% lower offer ($92k) is reasonable based on typical stale-listing flexibility.
- 2 sale attempts since 12y ago with the ask held roughly flat each time — persistent listings suggest the price (not the market) is what's stuck; bring a comps-based counter.
- Current owner paid $66k; 44% above their basis — modest negotiation headroom, anchor on the comps not their cost.
Risks & watch-outs
- Watch-outs: property tax is 3.2% of price; built in 1955 — expect roof / HVAC / electrical / plumbing capex.
- Climate carrying-cost: major flood risk; extreme-heat days projected 7→21/yr by 2055 (HVAC capex compounding) — expect insurance premiums to compound above CPI over the hold.
Questions for the listing agent
- It's been on market 43 days. Have you received any prior offers? Is the seller open to a 3% concession, seller financing, or rate buy-down credit?
- Built in 1955 — when were the roof, HVAC, electrical panel, plumbing, and water heater last replaced?
- Property tax is high relative to price — has the assessment been appealed recently, and will the sale trigger a re-assessment?
- Is there a deadline driving the sale (1031 exchange, divorce, estate, relocation)? That informs how much negotiation room exists.
- Crime grade is F in this area — have there been break-ins, vandalism, or insurance claims at this property in the last 3 years? What carrier currently insures it and at what premium?
- What's the average days-on-market for RENTAL listings here right now (not sales)? A rising rental-DOM trend means longer vacancies and softer asking-rent achievability than the comps imply.
- What's the recent tenant-quality profile in this submarket — average credit score on applications, eviction rate, late-payment / NSF rate, and stable-employment percentage? A property-management company in the area should have these aggregated.
- How much new for-sale + rental construction is in the pipeline within 1–3 miles? Heavy new supply typically softens prices + rents 12–24 months out; constrained supply supports both.
Investment metrics
- 1% rule
- 1.42% ✓
- Cap rate
- 9.77%
- Cash-on-cash
- 12.42%
- DSCR
- 1.55
- GRM
- 5.9
CMA / ARV
- ARV (on-the-fly)
- $110,032
- Comps found
- 12
Show comp detail 12 sales within ~0.75 mi
| Address | Dist | Beds/Ba | Sqft | Sold | Price | $/sf | Match |
|---|---|---|---|---|---|---|---|
| 4 Marlo Dr | 0.10mi | 3/1.0 | 1,128 (+7%) | 1mo | $139,000 | $123 | 80 |
| 1600 W H St | 0.44mi | 3/1.0 | 1,056 (-0%) | 1mo | $109,900 | $104 | 74 |
| 5 Shawn Dr | 0.41mi | 3/1.0 | 1,053 (-0%) | 2mo | $108,000 | $103 | 74 |
| 141 N 31st St | 0.33mi | 2/2.0 (-1) | 1,090 (+3%) | 7mo | $52,000 | $48 | 68 |
| 1637 N 16th St | 0.59mi | 3/1.0 | 1,056 (-0%) | 2mo | $79,900 | $76 | 67 |
| 2709 Sassy Ln | 0.74mi | 2/1.0 (-1) | 1,008 (-5%) | 3mo | $103,000 | $102 | 47 |
| 708 Gilbert St | 0.48mi | 2/1.0 (-1) | 910 (-14%) | 1mo | $94,500 | $104 | 44 |
| 14 Lillian Dr | 0.64mi | 3/1.0 | 925 (-13%) | 3mo | $79,900 | $86 | 43 |
| 206 S 27th St | 0.71mi | 2/2.0 (-1) | 1,168 (+10%) | 5mo | $75,000 | $64 | 41 |
| 324 Gilbert St | 0.72mi | 2/1.0 (-1) | 914 (-14%) | 2mo | $96,900 | $106 | 33 |
| 326 Gilbert St | 0.71mi | 2/1.0 (-1) | 1,212 (+15%) | 2mo | $154,900 | $128 | 32 |
| 404 S 23rd St | 0.71mi | 2/1.0 (-1) | 926 (-12%) | 7mo | $130,000 | $140 | 32 |
Match score weights: distance 35% · size 25% · config 20% · recency 20%. Top-matched comps best support the ARV.
Projected returns pro-forma
-3.0% appreciation · 4.56% rent growth · sell at horizon
- IRR
- 4.2%
- Equity multiple
- 1.17×
- Total profit
- $4,389
- Equity at exit
- $14,165
- IRR
- 15.3%
- Equity multiple
- 2.35×
- Total profit
- $35,899
- Equity at exit
- $8,214
Cash invested: $26,600 (down + closing). Projections, not guarantees.
Landlord ↔ Tenant lean methodology
- Overall (STATE)
- 43 Moderately Tenant-Leaning
- State Illinois
- 43 Moderately Tenant-Leaning · D+7
- County
- — inherits STATE
- City
- — inherits STATE
ZIP-level market 62226
- Rents YoY
- 4.6%
- Active inventory
- 190
- Price-to-rent
- 5.9×
Monthly cashflow live
- Estimated rent
- $1,345 high interval (Pro) →
- Mortgage (P&I)
- −$498
- Tax from tax record
- −$250 /mo · $2,996/yr
- Insurance
- −$40
- HOA
- −$0
- Vacancy / Maint / Mgmt
- −$283
- Net cashflow
- $275
Break-even live
UW: 25.0% down · 7.5% · 30yr · 1.5% tax · 5.0% vac · 8.0% maint · 8.0% mgmt
Financing live
Cash to close
- Down payment
- $23,750
- Closing costs
- $2,850
- Reserves months
- —
- Total cash needed
- —
Loan-product check · same deal, 3 products live
Conventional
25% down · 7.5% · 30yr
- Down + closing
- —
- Monthly P&I
- —
- Monthly cashflow
- —
- DSCR
- —
- Eligible?
- —
Personal DTI + credit; lowest rate.
DSCR
20% down · 8.5% · 30yr
- Down + closing
- —
- Monthly P&I
- —
- Monthly cashflow
- —
- DSCR
- —
- Eligible?
- —
No personal income docs; deal must DSCR.
Hard money
10% down · 12.0% · 12mo
- Down + closing
- —
- Monthly P&I
- —
- Monthly cashflow
- —
- DSCR
- —
- Eligible?
- —
Short-term bridge; refi at stabilization.
Rent comps 11 comps
| Address | Beds | Baths | Sqft | Rent | $/sqft | DOM | Units | Dist |
|---|---|---|---|---|---|---|---|---|
| 31 S 27th St Belleville, IL | 2.0 | 1.0 | 1000 | $915 | $0.92 | 23d | 1 | 0.60mi |
| 1308 Caseyville Ave Swansea, IL | 2.0 | 1.0 | 890 | $1,200 | $1.35 | 4d | 1 | 0.72mi |
| 310 N 10th St Belleville, IL | 2.0 | 1.0 | 1270 | $1,300 | $1.02 | 1d | 1 | 0.77mi |
| 213 Columbus Dr Belleville, IL | 3.0 | 1.0 | 1040 | $1,650 | $1.59 | 23d | 1 | 0.79mi |
| 1912 N 17th St Swansea, IL | 2.0 | 1.0 | 1414 | $1,500 | $1.06 | 17d | 1 | 0.82mi |
| 654 N 39th St Belleville, IL | 3.0 | 1.0 | 984 | $1,400 | $1.42 | 17d | 1 | 1.26mi |
| 1107 Bristow St Belleville, IL | 3.0 | 1.0 | 1238 | $1,500 | $1.21 | 12d | 1 | 1.31mi |
| 54 Ben Louis Dr Belleville, IL | 2.0 | 1.0 | 900 | $1,145 | $1.27 | 23d | 1 | 1.32mi |
| 618 W Monroe St Belleville, IL | 3.0 | 1.0 | 1500 | $1,050 | $0.70 | 23d | 1 | 1.36mi |
| 56 Friendly Dr Belleville, IL | 2.0 | 1.0 | 1000 | $1,550 | $1.55 | 23d | 1 | 1.44mi |
| 1000 Royal Heights Rd Belleville, IL | 2.0 | 1.5 | 1100 | $1,345 | $1.22 | 23d | 1 | 1.46mi |
Listing history 18 events
-
2026-06-18days on market $95,000 Active 43 DOM
-
2026-06-17days on market $95,000 Active 42 DOM
-
2026-06-16days on market $95,000 Active 41 DOM
-
2026-06-15days on market $95,000 Active 40 DOM
-
2026-06-13days on market $95,000 Active 38 DOM
-
2026-06-09days on market $95,000 Active 34 DOM
-
2026-06-08days on market $95,000 Active 33 DOM
-
2026-06-07days on market $95,000 Active 32 DOM
-
2026-06-03days on market $95,000 Active 28 DOM
-
2026-06-02days on market $95,000 Active 27 DOM
-
2026-06-01days on market $95,000 Active 26 DOM
-
2026-05-31days on market $95,000 Active 25 DOM
-
2026-05-07$95,000 Active
-
2014-12-18soldstatus $66,000
-
2014-12-16soldstatus 136-char remark
Show marketing remark (136 chars)
MOVE RIGHT IN! TOTALLY FURNISHED!This 3 bedroom 2 bath home has lots of room with a large family in the lower level. Close to Scott AFB.
-
2014-09-07$74,900 136-char remark
Show marketing remark (136 chars)
MOVE RIGHT IN! TOTALLY FURNISHED!This 3 bedroom 2 bath home has lots of room with a large family in the lower level. Close to Scott AFB.
-
1996-12-24soldstatus $66,000
-
1996-12-24soldstatus $66,000
ⓘ Source: listings_history table (triggers on properties + properties_extension) + one-shot
backfill from property_details.listing_events for pre-trigger history.
Tax reassessment forecast IL · Partial reset (capped growth)
- Current annual tax
- $2,996 · $250/mo
- Projected year-2 tax
- $2,996 · $250/mo
- Expected delta
- $0/yr ($0/mo · 0.0%)
ⓘ Screening estimate from a state-policy table — verify with the county assessor before closing.
Climate risk First Street
- Flood 6/10 Major FEMA zone X · 69% chance over 30 yrs
- Wildfire 1/10 Low
- Heat 5/10 Major 7 d/yr ≥107°F today · 21 d/yr by 30 yrs out
- Wind 2/10 Low 100% chance of damaging wind over 30 yrs
- Air quality 4/10 Moderate 3 unhealthy d/yr today · 6 by 30 yrs out
Nearby sold comps map
Loading sold comps map…
Walkable amenities ~0.75 mi
Loading nearby amenities…
Taxation est. · year 1
- Rental income
- $16,144
- − Mortgage interest
- −$5,321
- − Property taxes
- −$2,996
- − Insurance
- −$475
- − Repairs & maintenance
- −$1,291
- − Management
- −$1,291
- − Depreciation
- −$2,764
- Taxable income
- $2,005
- Est. tax owed @ 24.0%
- −$481
- After-tax cash flow
- $2,823/yr
For passive investors: Depreciation is non-cash, so a rental often shows a tax loss while cash-flowing — sheltering income. Rental losses are passive: they offset passive income freely, and up to $25,000/yr can offset ordinary (W-2) income if you actively participate and your MAGI is under $100k (phasing out to $0 by $150k); unused losses carry forward. On sale, claimed depreciation is recaptured at up to 25%, and gains may owe capital-gains tax (a 1031 exchange can defer both). Figures are a year-1 estimate at your 24.0% rate — not tax advice; consult a CPA.
Schools (NCES district)
- District
- Belleville Twp Hsd 201
- NCES district ID
- 1705640
- Math proficiency
- 21% ▼ -8.00%
- Reading proficiency
- 28% ▼ -3.00%
- Median HH income
- $58,064
- Composite
- 22.39/100
- National rank
- #8115
- State rank
- #308 of 620 in IL
Livability — Belleville
- Score
- 78/100
- State rank
- #142
- US rank
- #2604
Category grades
Schools grade is shown separately in the Schools card above.
Census & demographics
- Census place
- Belleville, IL
- County
- Saint Clair County · 169,691 people
- City population
- 47,407
- Metro
- St. Louis, MO-IL
- Population (ZIP)
- 28,255
- Household income
- $70,797
- Rent vs Own
- Severe rent burden
- 824.0
Population outlook (St. Clair County) Hauer SSP2
- Today (2025)
- 250,366 people
- By 2030
- 240,511 · -3.9%
- By 2040
- 217,391 · -13.2%
- By 2050
- 192,699 · -23.0%
- By 2075
- 140,637 · -43.8%
- By 2100
- 100,499 · -59.9%
Race, ethnicity, and origin ACS 2023
- Neighborhood character
- Majority White (64%)
- Race & ethnicity
- White 64% Black 24% Two or more races 7% Hispanic / Latino 3% Asian 2%
- Common ancestry
- Romanian 4% Lithuanian 2% Slovak 2%
- Foreign-born
- 4% · Canada, China
- Languages at home
- 96% English-only · Chinese 1% Spanish 1%
Political lean MEDSL · St. Clair
- 2024 margin
- Lean D (+7.9) · D 53.0% · R 45.1% · Other 1.8%
- 2008→2024 swing
- -14.6pp toward R · 2008: 22.4pp · 2024: 7.9pp
- All cycles
- 2024: D+7.9 2020: D+8.7 2016: D+5.6 2012: D+14.5 2008: D+22.4
Not yet ingested
- Civics
- —
Market trends
- HPI YoY
- ▼ -83.57%
- Current HPI
- 133.9028
- Rent YoY
- ▲ 4.56%
- Metro
- St. Louis, MO-IL
- State GDP YoY
- ▲ 1.59%
- F500 in state
- 60
Industry mix (Fortune 500 HQ in IL)
| Industry | F500 HQs | Revenue |
|---|---|---|
| Insurance | 4 | $201B |
|
||
| Consumer Goods | 4 | $87B |
|
||
| Industrial Machinery | 3 | $64B |
|
||
| Healthcare | 2 | $55B |
|
||
| Retail / Pharmacy | 1 | $148B |
|
||
| Agriculture / Food | 1 | $86B |
|
||
Price history
+43.9% since first listed6 events — show timeline
- 2026-05-07 Listed $95,000 MARIS as Distributed by MLS Grid
- 2014-12-18 Sold (Public Records) $66,000 Public Records
- 2014-12-16 Sold (MLS) — MARIS as Distributed by MLS Grid
- 2014-09-07 Listed $74,900 MARIS as Distributed by MLS Grid
- 1996-12-24 Sold (Public Records) $66,000 Public Records
- 1996-12-24 Sold (Public Records) $66,000 Public Records
Property tax history
+7.3%/yrLatest (2024): $2,996 · +7.0% YoY. Source: county tax records.
Cash-flow waterfall
monthlySold comps — $/sqft
last 12 mo · ≤1 miLoading sold comps…