1921 Chipper Dr #346 · Edgewood, MD
Flood risk No data
- FEMA flood zone
- —
- Chance of flooding over 30 yrs
- —
- Est. flood insurance / yr
- —
Fire risk No data
- Est. fire insurance / yr
- —
Heat risk No data
- Hot days now (above threshold)
- —
- Hot days in 30 yrs
- —
Wind risk No data
- Chance of severe wind over 30 yrs
- —
Air-quality risk No data
- Unhealthy air days now
- —
- Unhealthy air days in 30 yrs
- —
Risk factors via First Street. Map © Google.
Why this score? — see what drove the C- grade
The composite is a weighted blend of 9 inputs, each scored 0–100. Each bar is that input's sub-score; the figure is the points it added to the 100-point composite (weight × sub-score).
- Cash flow +15.0/30.0
- ARV discount +11.2/15.0
- 1% rule +5.0/10.0
- DSCR +5.0/10.0
- Condition / age +4.0/5.0
- Rent growth +3.7/5.0
- Livability +3.7/5.0
- Schools +2.9/10.0
- Appreciation +0.0/10.0
$34,900
🖨 Deal sheet 📄 Offer letter ✓ Due diligence
Listing remarks MLS
* THIS IS A RESALE LISTING * You'll love living in this 2 bedroom, 2 bathroom home within a wonderful family-friendly community. Check out the awesome amenities your community has to offer such as community events, a playground, a clubhouse, and more! This home won't be on the market long, so call us today for more information or to schedule a tour. Deposits & Fees are subject to change.
Key facts
- Built 2026
- Listed 50 days
Neighborhood map
What this means for you Summary
Snapshot
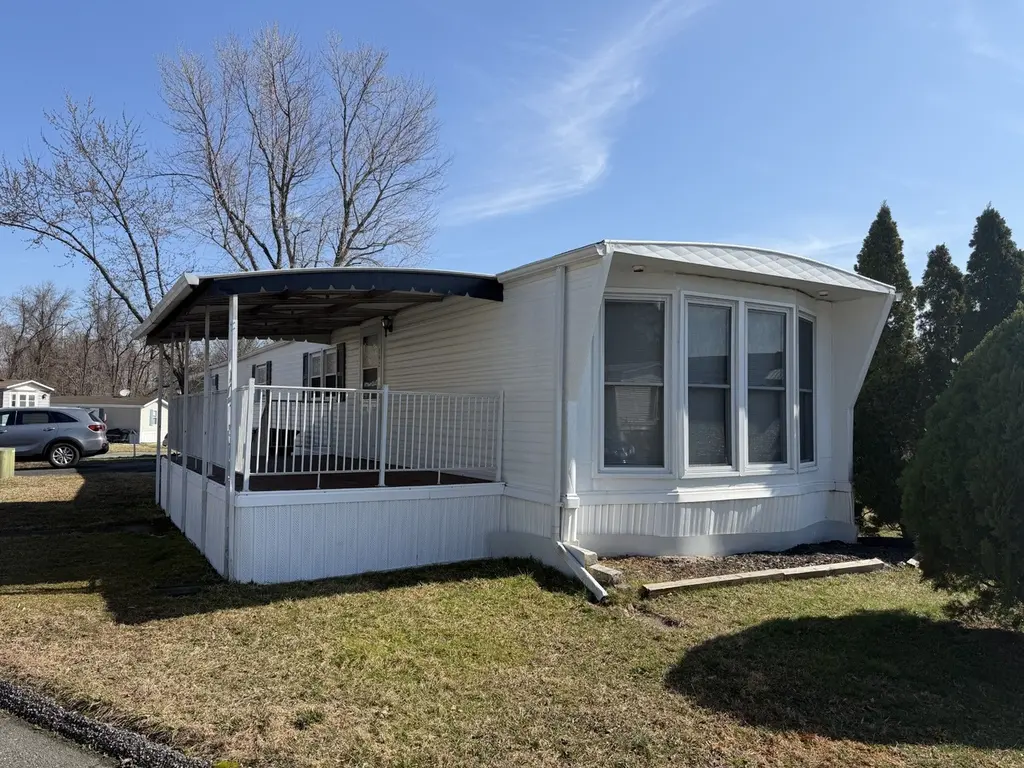
- This is a 2-bed/2.0-bath manufactured listed at $35k. Condition is rated good.
Deal economics
- At list price, monthly cash flow is $1k ($13k/yr) — positive.
- The deal already cash-flows at list — no discount required.
- Meets the 1% rule at list price ($2k rent vs $35k).
- Recommended offer: $34k (3.0% below list) — sets the bar for market timing.
- Cap rate 42.8% vs local median 5.5% in Edgewood — top-decile yield for the area; either an underpriced asset or a hidden risk that comps aren't pricing in. Stress-test before assuming the spread holds.
Location & tenants
- Location reads 73/100 on livability (#118 in MD, #4,991 nationally) — a middle-class / working-renter tenant base. Strengths: commute A+, housing A+, health & safety A+; Watch: schools D, amenities D, crime F.
- Harford County Public Schools (suburban): math 22% / reading 39% proficiency, ranked #9 of 24 in MD (top 38%) — families likely to look elsewhere, expect single-tenant / working-renter base with shorter leases.
- Market conditions: Rents rising fast (+4.9%/yr); 94 active listings in the ZIP; 5 comparable units currently listed for rent nearby; rentals lingering (median 44d on market — plan ~5-8 weeks vacancy on turnover, expect pricing pressure); 60% of comp listings sitting > 30 days — soft ceiling on asking rent; solid renter incomes; 803 units permitted in Harford County in 2024 (26 in 5+ unit buildings).
Forward outlook
- Local home prices are declining (-3.0%/yr); year-one equity from $241 of loan paydown is wiped out by about $1k of value loss. Plan a longer hold.
- At projected returns (-3.0% appreciation + 4.9% rent growth), your $10k cash investment doubles in ~1 year — after that, you're playing with house money.
Negotiation context
- It's been on market 50 days — a 3% lower offer ($34k) is reasonable based on typical stale-listing flexibility.
Questions for the listing agent
- It's been on market 50 days. Have you received any prior offers? Is the seller open to a 3% concession, seller financing, or rate buy-down credit?
- Is there a deadline driving the sale (1031 exchange, divorce, estate, relocation)? That informs how much negotiation room exists.
- Schools are D-rated, which usually means shorter tenancies and higher turnover. Who's the typical renter profile here, and what's been the actual vacancy rate?
- Crime grade is F in this area — have there been break-ins, vandalism, or insurance claims at this property in the last 3 years? What carrier currently insures it and at what premium?
- What's the average days-on-market for RENTAL listings here right now (not sales)? A rising rental-DOM trend means longer vacancies and softer asking-rent achievability than the comps imply.
- What's the recent tenant-quality profile in this submarket — average credit score on applications, eviction rate, late-payment / NSF rate, and stable-employment percentage? A property-management company in the area should have these aggregated.
- How much new for-sale + rental construction is in the pipeline within 1–3 miles? Heavy new supply typically softens prices + rents 12–24 months out; constrained supply supports both.
Investment metrics
- 1% rule
- 4.73% ✓
- Cap rate
- 42.84%
- Cash-on-cash
- 130.51%
- DSCR
- 6.81
- GRM
- 1.8
CMA / ARV
- ARV (median comp)
- $37,981
- List price
- $34,900
- Delta
- -8.11%
- Verdict
- FAIR
- Comps
- 1 within 2.0 mi
Show comp detail 1 sale within ~0.75 mi
| Address | Dist | Beds/Ba | Sqft | Sold | Price | $/sf | Match |
|---|---|---|---|---|---|---|---|
| 1921 Steven Dr | 0.10mi | 2/2.0 | 850 (-13%) | 9mo | $60,000 | $71 | 65 |
Match score weights: distance 35% · size 25% · config 20% · recency 20%. Top-matched comps best support the ARV.
Projected returns pro-forma
-3.0% appreciation · 4.92% rent growth · sell at horizon
- IRR
- —
- Equity multiple
- 7.68×
- Total profit
- $65,309
- Equity at exit
- $5,204
- IRR
- —
- Equity multiple
- 17.17×
- Total profit
- $158,002
- Equity at exit
- $3,018
Cash invested: $9,772 (down + closing). Projections, not guarantees.
Landlord ↔ Tenant lean methodology
- Overall (STATE)
- 27 Tenant-Leaning
- State Maryland
- 27 Tenant-Leaning · D+14
- County
- — inherits STATE
- City
- — inherits STATE
ZIP-level market 21040
- Home prices YoY
- -29.4%
- Rents YoY
- 4.9%
- Active inventory
- 94
- Price-to-rent
- 1.8×
Monthly cashflow live
- Estimated rent
- $1,651 high interval (Pro) →
- Mortgage (P&I)
- −$183
- Tax est. 1.5%
- −$44 /mo · $524/yr
- Insurance
- −$15
- HOA
- −$0
- Vacancy / Maint / Mgmt
- −$347
- Net cashflow
- $1,063
Break-even live
UW: 25.0% down · 7.5% · 30yr · 1.5% tax · 5.0% vac · 8.0% maint · 8.0% mgmt
Financing live
Cash to close
- Down payment
- $8,725
- Closing costs
- $1,047
- Reserves months
- —
- Total cash needed
- —
Loan-product check · same deal, 3 products live
Conventional
25% down · 7.5% · 30yr
- Down + closing
- —
- Monthly P&I
- —
- Monthly cashflow
- —
- DSCR
- —
- Eligible?
- —
Personal DTI + credit; lowest rate.
DSCR
20% down · 8.5% · 30yr
- Down + closing
- —
- Monthly P&I
- —
- Monthly cashflow
- —
- DSCR
- —
- Eligible?
- —
No personal income docs; deal must DSCR.
Hard money
10% down · 12.0% · 12mo
- Down + closing
- —
- Monthly P&I
- —
- Monthly cashflow
- —
- DSCR
- —
- Eligible?
- —
Short-term bridge; refi at stabilization.
Rent comps 5 comps
| Address | Beds | Baths | Sqft | Rent | $/sqft | DOM | Units | Dist |
|---|---|---|---|---|---|---|---|---|
| 1772 Judy Way Edgewood, MD | 3.0 | 1.5 | 1040 | $2,195 | $2.11 | 44d | 1 | 0.42mi |
| 905 Swallow Crest Ct Unit E Edgewood, MD | 2.0 | 1.0 | 990 | $1,495 | $1.51 | 44d | 1 | 0.55mi |
| 1703 Fountain Rock Way Unit 1703-B Edgewood, MD | 2.0 | 1.0 | 882 | $1,250 | $1.42 | 24d | 1 | 0.63mi |
| 814 Windstream Way Unit 814-A Edgewood, MD | 1.0 | 1.0 | 882 | $1,200 | $1.36 | 44d | 1 | 0.85mi |
| 802 Kingston Ct Edgewood, MD | 1.0–3.0 | 1.0–1.5 | 1007 | $1,660 | $1.65 | 2d | 15 | 0.99mi |
Listing history 9 events
-
2026-06-09days on market $34,900 Active 50 DOM
-
2026-06-08days on market $34,900 Active 49 DOM
-
2026-06-07days on market $34,900 Active 48 DOM
-
2026-06-04pricedays on market $34,900 Active 45 DOM
-
2026-06-03days on market $39,900 Active 44 DOM
-
2026-06-02days on market $39,900 Active 43 DOM
-
2026-06-01pricedays on market $39,900 Active 42 DOM
-
2026-05-31days on market $39,400 Active 41 DOM
-
2026-04-20$39,400 Active 399-char remark
Show marketing remark (399 chars)
* THIS IS A RESALE LISTING * You'll love living in this 2 bedroom, 2 bathroom home within a wonderful family-friendly community. Check out the awesome amenities your community has to offer such as community events, a playground, a clubhouse, and more! This home won't be on the market long, so call us today for more information or to schedule a tour. Deposits & Fees are subject to change.
ⓘ Source: listings_history table (triggers on properties + properties_extension) + one-shot
backfill from property_details.listing_events for pre-trigger history.
Nearby sold comps map
Loading sold comps map…
Walkable amenities ~0.75 mi
Loading nearby amenities…
Taxation est. · year 1
- Rental income
- $19,807
- − Mortgage interest
- −$1,955
- − Property taxes
- −$524
- − Insurance
- −$174
- − Repairs & maintenance
- −$1,585
- − Management
- −$1,585
- − Depreciation
- −$1,015
- Taxable income
- $12,970
- Est. tax owed @ 24.0%
- −$3,113
- After-tax cash flow
- $9,641/yr
For passive investors: Depreciation is non-cash, so a rental often shows a tax loss while cash-flowing — sheltering income. Rental losses are passive: they offset passive income freely, and up to $25,000/yr can offset ordinary (W-2) income if you actively participate and your MAGI is under $100k (phasing out to $0 by $150k); unused losses carry forward. On sale, claimed depreciation is recaptured at up to 25%, and gains may owe capital-gains tax (a 1031 exchange can defer both). Figures are a year-1 estimate at your 24.0% rate — not tax advice; consult a CPA.
Condition & rehab AI · 12 photos
This 2-bedroom, 2-bathroom manufactured home is in excellent condition with recent updates, making it move-in ready for both resale and rental.
Value-add opportunities
- Both Paint exterior siding — Fresh paint can enhance curb appeal and value
- Both Replace air conditioning unit — Modern unit improves comfort and energy efficiency
- Both Install new outdoor lighting — Enhances safety and curb appeal
Renovation cost estimate screening
Value-add ROI direction
- Both Paint exterior siding — Fresh paint can enhance curb appeal and value ↑
- Both Replace air conditioning unit — Modern unit improves comfort and energy efficiency ↑
- Both Install new outdoor lighting — Enhances safety and curb appeal ↑
ⓘ Cost ranges are severity-bucket heuristics (US national rule-of-thumb). Get contractor quotes + a written scope before underwriting a rehab budget.
Schools (NCES district)
- District
- Harford County Public Schools
- NCES district ID
- 2400390
- Math proficiency
- 22% ▼ -23.00%
- Reading proficiency
- 39% ▼ -12.00%
- Median HH income
- $79,569
- Composite
- 29.38/100
- National rank
- #6527
- State rank
- #9 of 24 in MD
Livability — Edgewood
- Score
- 73/100
- State rank
- #118
- US rank
- #4991
Category grades
Schools grade is shown separately in the Schools card above.
Census & demographics
- Census place
- Edgewood, MD
- County
- Harford County · 198,512 people
- City population
- 24,960
- Metro
- Baltimore-Columbia-Towson, MD
- Population (ZIP)
- 24,960
- Household income
- $81,704
- Rent vs Own
- Severe rent burden
- 859.0
Population outlook (Harford County) Hauer SSP2
- Today (2025)
- 262,292 people
- By 2030
- 266,437 · +1.6%
- By 2040
- 269,954 · +2.9%
- By 2050
- 265,659 · +1.3%
- By 2075
- 252,886 · -3.6%
- By 2100
- 224,014 · -14.6%
Race, ethnicity, and origin ACS 2023
- Neighborhood character
- Diverse neighborhood (Simpson 0.66)
- Race & ethnicity
- Black 45% White 36% Two or more races 11% Hispanic / Latino 10% Asian 2%
- Hispanic origin (detail)
- Mexican 1% Puerto Rican 2%
- Common ancestry
- Romanian 4% Slovak 1% Italian 1%
- Foreign-born
- 8% · Canada, South Korea
- Languages at home
- 89% English-only · Spanish 5% Russian/Polish/Slavic 2% German/W. Germanic 1%
Political lean MEDSL · Harford
- 2024 margin
- R (+13.8) · D 41.9% · R 55.7% · Other 2.4%
- 2008→2024 swing
- +5.0pp toward D · 2008: -18.8pp · 2024: -13.8pp
- All cycles
- 2024: R+13.8 2020: R+12.0 2016: R+24.5 2012: R+19.5 2008: R+18.8
Not yet ingested
- Civics
- —
Market trends
- HPI YoY
- ▼ -106.14%
- Current HPI
- 254.2305
- Rent YoY
- ▲ 4.92%
- Metro
- Baltimore-Columbia-Towson, MD
- State GDP YoY
- ▲ 2.97%
- F500 in state
- 12
Industry mix (Fortune 500 HQ in MD)
| Industry | F500 HQs | Revenue |
|---|---|---|
| Aerospace / Defense | 1 | $71B |
|
||
| Utilities | 1 | $25B |
|
||
| Hotels | 1 | $24B |
|
||
| Consumer Goods | 1 | $7B |
|
||
| Real Estate | 1 | $6B |
|
||
| Chemicals | 1 | $2B |
|
||
Price history
1 event — show timeline
- 2026-04-20 Listed $39,400 Zillow
Cash-flow waterfall
monthlySold comps — $/sqft
last 12 mo · ≤1 miLoading sold comps…