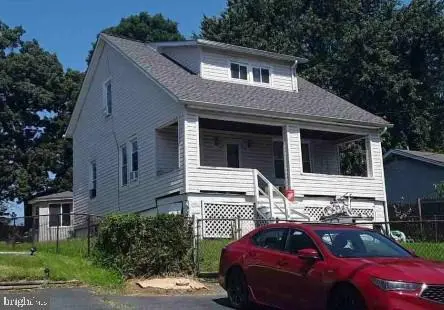
5944 Clayton Ave · Overlea, MD
Flood risk 1/10 · Minimal
- FEMA flood zone
- X (unshaded)
- Chance of flooding over 30 yrs
- 0.0%
- Est. flood insurance / yr
- $473 – $860
Fire risk 1/10 · Minimal
- Est. fire insurance / yr
- $755 – $1,403
Heat risk 7/10 · Major
- Hot days now (above 103°F)
- 7 days/yr
- Hot days in 30 yrs
- 15 days/yr
Wind risk 6/10 · Moderate
- Chance of severe wind over 30 yrs
- 27.0%
Air-quality risk 5/10 · Moderate
- Unhealthy air days now
- 6 days/yr
- Unhealthy air days in 30 yrs
- 8 days/yr
Risk factors via First Street. Map © Google.
Why this score? — see what drove the C- grade
The composite is a weighted blend of 9 inputs, each scored 0–100. Each bar is that input's sub-score; the figure is the points it added to the 100-point composite (weight × sub-score).
- Cash flow +16.4/30.0
- ARV discount +15.0/15.0
- DSCR +5.1/10.0
- 1% rule +4.8/10.0
- Livability +4.0/5.0
- Rent growth +3.6/5.0
- Condition / age +2.5/5.0
- Schools +2.3/10.0
- Appreciation +0.0/10.0
$251,600
🖨 Deal sheet (PDF) 📄 Offer letter ✓ Due diligence
Listing remarks MLS
Great Opportunity to own this single-family home built in 1932 featuring 4 bedrooms and 1.1 bathrooms. * * * SPECIAL NOTES: (1) This is a CASH ONLY transaction. (2) Seller to pay Taxes, HOA, and Municipal/Utility Liens. (3) Please read the Auction disclaimers carefully before placing a bid or submitting an offer. * * * No showings, No access provided. Drive by only. Property is lender-owned, being sold “as-is”, the seller is making no representations or warranties.
Key facts
- 0.24 acre lot
- Built 1932
- Listed 279 days
Neighborhood map
What this means for you Summary
Snapshot
- This is a 4-bed/2.5-bath single-family listed at $252k.
Deal economics
- At list price, monthly cash flow is $144 ($2k/yr) — positive.
- The deal already cash-flows at list — no discount required.
- To meet the 1% rule (rent ≥ 1% of price), the offer needs to be $246k (2.1% below list).
- Recommended offer: $221k (12.0% below list) — sets the bar for market timing.
- Cap rate 7.0% vs local median 5.4% in Overlea — meaningfully above typical; check what's discounted (condition, days-on-market, listing class) to confirm the premium yield is real.
Location & tenants
- Location reads 81/100 on livability (#38 in MD, #1,418 nationally) — a professional / high-income tenant draw. Strengths: amenities A+, commute A+, housing A+; Watch: crime F.
- Baltimore County Public Schools (suburban): math 15% / reading 34% proficiency, ranked #11 of 24 in MD (top 46%) — low school quality limits family demand, transient renter base, plan for 1-2y turnover.
- Market conditions: Rents rising fast (+4.4%/yr); 173 active listings in the ZIP; 24 comparable units currently listed for rent nearby; rentals at typical pace (median 25d on market — plan ~3-4 weeks tenant-placement turnaround); 42% of comp listings sitting > 30 days — soft ceiling on asking rent; 1,511 units permitted in Baltimore County in 2024 (643 in 5+ unit buildings).
- At $2,462/mo this rent would consume 46% of the median local household income ($65k/yr) (locally 2317% of renters already pay >50% of income on rent) — very limited rent-growth headroom before tenants either downsize or default.
Forward outlook
- Local home prices are declining (-3.0%/yr); year-one equity from $2k of loan paydown is wiped out by about $8k of value loss. Plan a longer hold.
- Baltimore County population projected at +12% by 2050 — modest demand growth; plan on rents tracking national, not racing it.
Negotiation context
- It's been on market 279 days — a 12% lower offer ($221k) is reasonable based on typical stale-listing flexibility.
- 3 sale attempts since 8y ago with the ask held roughly flat each time — persistent listings suggest the price (not the market) is what's stuck; bring a comps-based counter.
- Current owner paid $195k; 29% above their basis — modest negotiation headroom, anchor on the comps not their cost.
Risks & watch-outs
- Watch-outs: built in 1932 — expect roof / HVAC / electrical / plumbing capex.
- Climate carrying-cost: major wind risk, 27% chance of damaging wind over 30y; extreme-heat days projected 7→15/yr by 2055 (HVAC capex compounding) — expect insurance premiums to compound above CPI over the hold.
Questions for the listing agent
- It's been on market 279 days. Have you received any prior offers? Is the seller open to a 12% concession, seller financing, or rate buy-down credit?
- Built in 1932 — when were the roof, HVAC, electrical panel, plumbing, and water heater last replaced?
- Why hasn't it sold? Are there any deal-killer items the seller is aware of (foundation, flood, title, zoning, code violations)?
- Is there a deadline driving the sale (1031 exchange, divorce, estate, relocation)? That informs how much negotiation room exists.
- Crime grade is F in this area — have there been break-ins, vandalism, or insurance claims at this property in the last 3 years? What carrier currently insures it and at what premium?
- What's the average days-on-market for RENTAL listings here right now (not sales)? A rising rental-DOM trend means longer vacancies and softer asking-rent achievability than the comps imply.
- What's the recent tenant-quality profile in this submarket — average credit score on applications, eviction rate, late-payment / NSF rate, and stable-employment percentage? A property-management company in the area should have these aggregated.
- How much new for-sale + rental construction is in the pipeline within 1–3 miles? Heavy new supply typically softens prices + rents 12–24 months out; constrained supply supports both.
Investment metrics
- 1% rule
- 0.98% ✗
- Cap rate
- 6.98%
- Cash-on-cash
- 2.45%
- DSCR
- 1.11
- GRM
- 8.5
CMA / ARV
- ARV (median comp)
- $323,257
- List price
- $251,600
- Delta
- -22.17%
- Verdict
- UNDERPRICED
- Comps
- 20 within 1.0 mi
Show comp detail 12 sales within ~0.75 mi
| Address | Dist | Beds/Ba | Sqft | Sold | Price | $/sf | Match |
|---|---|---|---|---|---|---|---|
| 6008 Eurith Ave | 0.40mi | 3/1.5 (-1) | 1,492 (+2%) | 6mo | $235,000 | $158 | 63 |
| 524 Elmwood Rd | 0.32mi | 3/1.5 (-1) | 1,650 (+13%) | 1mo | $319,000 | $193 | 53 |
| 4502 Parkmont Ave | 0.47mi | 4/2.0 | 1,642 (+13%) | 4mo | $325,000 | $198 | 51 |
| 713 Dale Ave | 0.52mi | 4/2.0 | 1,304 (-10%) | 6mo | $371,000 | $285 | 51 |
| 4614 White Ave | 0.69mi | 4/2.5 | 1,370 (-6%) | 9mo | $275,000 | $201 | 51 |
| 4412 Springwood Ave | 0.45mi | 3/1.5 (-1) | 1,624 (+12%) | 3mo | $295,000 | $182 | 48 |
| 4806 Hazelwood Ave | 0.53mi | 4/1.5 | 1,658 (+14%) | 1mo | $222,000 | $134 | 47 |
| 4103 Glenmore Ave | 0.74mi | 4/2.5 | 1,666 (+14%) | 1mo | $280,000 | $168 | 40 |
| 4207 Parkmont Ave | 0.72mi | 5/2.0 (+1) | 1,624 (+12%) | 2mo | $252,500 | $155 | 39 |
| 4313 Forest View Ave | 0.58mi | 3/2.0 (-1) | 1,244 (-15%) | 5mo | $172,000 | $138 | 38 |
| 4603-H Kenwood Ave | 0.58mi | 3/1.0 (-1) | 1,624 (+12%) | 7mo | $187,000 | $115 | 37 |
| 107 E Overlea Ave E | 0.65mi | 5/2.0 (+1) | 1,648 (+13%) | 9mo | $305,000 | $185 | 34 |
Match score weights: distance 35% · size 25% · config 20% · recency 20%. Top-matched comps best support the ARV.
Projected returns pro-forma
-3.0% appreciation · 4.43% rent growth · sell at horizon
- IRR
- -10.7%
- Equity multiple
- 0.60×
- Total profit
- $-27,937
- Equity at exit
- $37,514
- IRR
- 0.6%
- Equity multiple
- 1.04×
- Total profit
- $2,962
- Equity at exit
- $21,754
Cash invested: $70,448 (down + closing). Projections, not guarantees.
Landlord ↔ Tenant lean methodology
- Overall (STATE)
- 27 Tenant-Leaning
- State Maryland
- 27 Tenant-Leaning · D+14
- County
- — inherits STATE
- City
- — inherits STATE
ZIP-level market 21206
- Rents YoY
- 4.4%
- Active inventory
- 173
- Price-to-rent
- 8.5×
Monthly cashflow live
- Estimated rent
- $2,462 high interval (Pro) →
- Mortgage (P&I)
- −$1,319
- Tax from tax record
- −$377 /mo · $4,526/yr
- Insurance
- −$105
- HOA
- −$0
- Vacancy / Maint / Mgmt
- −$517
- Net cashflow
- $144
Break-even live
Sensitivity live
| Price | -10% $286 | -5% $215 | +0% $144 | +5% $73 | +10% $1 |
|---|---|---|---|---|---|
| Rent | -10% $-51 | -5% $47 | +0% $144 | +5% $241 | +10% $338 |
| Rate | -1.0pp $271 | -0.5pp $208 | base $144 | +0.5pp $79 | +1.0pp $12 |
UW: 25.0% down · 7.5% · 30yr · 1.5% tax · 5.0% vac · 8.0% maint · 8.0% mgmt
Financing live
Cash to close
- Down payment
- $62,900
- Closing costs
- $7,548
- Reserves months
- —
- Total cash needed
- —
Loan-product check · same deal, 3 products live
Conventional
25% down · 7.5% · 30yr
- Down + closing
- —
- Monthly P&I
- —
- Monthly cashflow
- —
- DSCR
- —
- Eligible?
- —
Personal DTI + credit; lowest rate.
DSCR
20% down · 8.5% · 30yr
- Down + closing
- —
- Monthly P&I
- —
- Monthly cashflow
- —
- DSCR
- —
- Eligible?
- —
No personal income docs; deal must DSCR.
Hard money
10% down · 12.0% · 12mo
- Down + closing
- —
- Monthly P&I
- —
- Monthly cashflow
- —
- DSCR
- —
- Eligible?
- —
Short-term bridge; refi at stabilization.
Rent comps 24 comps
| Address | Beds | Baths | Sqft | Rent | $/sqft | DOM | Units | Dist |
|---|---|---|---|---|---|---|---|---|
| 5938 Clayton Ave Baltimore, MD | 4.0 | 2.0 | 1296 | $2,872 | $2.22 | 17d | 1 | 0.04mi |
| 5110 Kenwood Ave Baltimore, MD | 3.0 | 1.5 | 1406 | $2,500 | $1.78 | 44d | 1 | 0.83mi |
| 4907 Hamilton Ave Unit B Baltimore, MD | 3.0 | 2.0 | 925 | $1,699 | $1.84 | 44d | 1 | 0.86mi |
| 4905 Hamilton Ave Apt B Baltimore, MD | 3.0 | 2.0 | 925 | $1,550 | $1.68 | 24d | 1 | 0.87mi |
| 4909 Hamilton Ave Baltimore, MD | 2.0–3.0 | 2.0 | 862 | $1,550 | $1.80 | 3d | 5 | 0.87mi |
| 4903 1/2 Hamilton Ave Apt B Baltimore, MD | 3.0 | 2.0 | 925 | $1,550 | $1.68 | 24d | 1 | 0.87mi |
| 8133 Bartholomew Ct Baltimore, MD | 3.0 | 2.5 | 1600 | $2,700 | $1.69 | 24d | 1 | 0.88mi |
| 5904 Arizona Ave Unit B Baltimore, MD | 3.0 | 2.0 | 925 | $1,550 | $1.68 | 24d | 1 | 0.88mi |
| 4111 Century Rd Baltimore, MD | 3.0 | 1.5 | 1432 | $2,500 | $1.75 | 44d | 1 | 0.93mi |
| 3807 Fleetwood Ave Unit 2 Baltimore, MD | 3.0 | 1.0 | 937 | $1,550 | $1.65 | 5d | 1 | 0.96mi |
| 100 Elinor Ave Nottingham, MD | 4.0 | 2.5 | 1800 | $2,800 | $1.56 | 24d | 1 | 1.00mi |
| 101 Elinor Ave Nottingham, MD | 4.0 | 2.0 | 1476 | $2,900 | $1.96 | 44d | 1 | 1.00mi |
| 6042 Barstow Rd Baltimore, MD | 1.0–3.0 | 1.0 | 736 | $1,527 | $2.07 | 3d | 1 | 1.04mi |
| 1732 Chesaco Ave Rosedale, MD | 3.0 | 1.0 | 1260 | $2,295 | $1.82 | 44d | 1 | 1.19mi |
| 5 Belhaven Dr Nottingham, MD | 4.0 | 1.5 | 1554 | $2,000 | $1.29 | 44d | 1 | 1.21mi |
| 5632 Belair Rd Baltimore, MD | 3.0 | 1.5 | 1260 | $2,100 | $1.67 | 24d | 1 | 1.25mi |
| 8212 Dorset Ave Rosedale, MD | 4.0 | 1.5 | 1479 | $2,250 | $1.52 | 44d | 1 | 1.30mi |
| 5248 Darien Rd Baltimore, MD | 3.0 | 1.0 | 1584 | $2,100 | $1.33 | 44d | 1 | 1.32mi |
| 5253 Cedgate Rd Unit 1 Baltimore, MD | 3.0 | 1.5 | 1152 | $2,200 | $1.91 | 44d | 1 | 1.33mi |
| 32 Tameron Pl Rosedale, MD | 3.0 | 2.5 | 1720 | $2,300 | $1.34 | 2d | 1 | 1.34mi |
| 3412 Fleetwood Ave Baltimore, MD | 3.0 | 2.5 | 1620 | $2,195 | $1.35 | 44d | 1 | 1.35mi |
| 6512 Golden Ring Rd Rosedale, MD | 4.0 | 3.0 | 1089 | $2,800 | $2.57 | 17d | 1 | 1.35mi |
| 5313 Todd Ave Baltimore, MD | 3.0 | 1.5 | 1280 | $1,800 | $1.41 | 17d | 1 | 1.44mi |
| 4924 Frankford Ave Baltimore, MD | 4.0 | 2.0 | 1176 | $2,600 | $2.21 | 24d | 1 | 1.47mi |
Listing history 22 events
-
2026-06-18days on market $251,600 Active 279 DOM
-
2026-06-17days on market $251,600 Active 278 DOM
-
2026-06-16days on market $251,600 Active 277 DOM
-
2026-06-15days on market $251,600 Active 276 DOM
-
2026-06-13days on market $251,600 Active 274 DOM
-
2026-06-09days on market $251,600 Active 270 DOM
-
2026-06-08days on market $251,600 Active 269 DOM
-
2026-06-07days on market $251,600 Active 268 DOM
-
2026-06-04days on market $251,600 Active 265 DOM
-
2026-06-03days on market $251,600 Active 264 DOM
-
2026-06-02days on market $251,600 Active 263 DOM
-
2026-06-01days on market $251,600 Active 262 DOM
-
2026-05-31days on market $251,600 Active 261 DOM
-
2025-09-12$251,600 Active 486-char remark
Show marketing remark (486 chars)
Great Opportunity to own this single-family home built in 1932 featuring 4 bedrooms and 1.1 bathrooms. * * * SPECIAL NOTES: (1) This is a CASH ONLY transaction. (2) Seller to pay Taxes, HOA, and Municipal/Utility Liens. (3) Please read the Auction disclaimers carefully before placing a bid or submitting an offer. * * * No showings, No access provided. Drive by only. Property is lender-owned, being sold “as-is”, the seller is making no representations or warranties.
-
2018-09-17soldstatus $195,000
-
2018-08-24soldstatus $195,000 Closed 321-char remark
Show marketing remark (321 chars)
Pride of ownership shows! Awesome 4 bedroom, 2 1/2 baths, neutral decor, separate dinning area, new roof & siding, living area carpet, ceramic and vinyl floors throughout home, 9' ceilings, spacious kitchen cabinets, level fenced yard, seller purchasing AHS Warranty, home selling as-is, schedule your tour today!!!
-
2018-08-24soldstatus $195,000 Sold
Show marketing remark (321 chars)
Pride of ownership shows! Awesome 4 bedroom, 2 1/2 baths, neutral decor, separate dinning area, new roof & siding, living area carpet, ceramic and vinyl floors throughout home, 9' ceilings, spacious kitchen cabinets, level fenced yard, seller purchasing AHS Warranty, home selling as-is, schedule your tour today!!!
-
2018-07-14historical Active Under Contract 321-char remark
Show marketing remark (321 chars)
Pride of ownership shows! Awesome 4 bedroom, 2 1/2 baths, neutral decor, separate dinning area, new roof & siding, living area carpet, ceramic and vinyl floors throughout home, 9' ceilings, spacious kitchen cabinets, level fenced yard, seller purchasing AHS Warranty, home selling as-is, schedule your tour today!!!
-
2018-07-14status Contingent (No Kick Out)
Show marketing remark (321 chars)
Pride of ownership shows! Awesome 4 bedroom, 2 1/2 baths, neutral decor, separate dinning area, new roof & siding, living area carpet, ceramic and vinyl floors throughout home, 9' ceilings, spacious kitchen cabinets, level fenced yard, seller purchasing AHS Warranty, home selling as-is, schedule your tour today!!!
-
2018-06-08$199,999 Active 321-char remark
Show marketing remark (321 chars)
Pride of ownership shows! Awesome 4 bedroom, 2 1/2 baths, neutral decor, separate dinning area, new roof & siding, living area carpet, ceramic and vinyl floors throughout home, 9' ceilings, spacious kitchen cabinets, level fenced yard, seller purchasing AHS Warranty, home selling as-is, schedule your tour today!!!
-
2018-06-08$199,999 Active
Show marketing remark (321 chars)
Pride of ownership shows! Awesome 4 bedroom, 2 1/2 baths, neutral decor, separate dinning area, new roof & siding, living area carpet, ceramic and vinyl floors throughout home, 9' ceilings, spacious kitchen cabinets, level fenced yard, seller purchasing AHS Warranty, home selling as-is, schedule your tour today!!!
-
1976-12-01soldstatus $23,000
ⓘ Source: listings_history table (triggers on properties + properties_extension) + one-shot
backfill from property_details.listing_events for pre-trigger history.
Tax reassessment forecast MD · Partial reset (capped growth)
- Current annual tax
- $4,526 · $377/mo
- Projected year-2 tax
- $4,526 · $377/mo
- Expected delta
- $0/yr ($0/mo · 0.0%)
ⓘ Screening estimate from a state-policy table — verify with the county assessor before closing.
Climate risk First Street
- Flood 1/10 Low FEMA zone X (unshaded) · 0% chance over 30 yrs
- Wildfire 1/10 Low
- Heat 7/10 Severe 7 d/yr ≥103°F today · 15 d/yr by 30 yrs out
- Wind 6/10 Major 27% chance of damaging wind over 30 yrs
- Air quality 5/10 Major 6 unhealthy d/yr today · 8 by 30 yrs out
Nearby sold comps map
Loading sold comps map…
Walkable amenities ~0.75 mi
Loading nearby amenities…
Taxation est. · year 1
- Rental income
- $29,548
- − Mortgage interest
- −$14,094
- − Property taxes
- −$4,526
- − Insurance
- −$1,258
- − Repairs & maintenance
- −$2,364
- − Management
- −$2,364
- − Depreciation
- −$7,319
- Taxable loss
- −$2,376
- Est. tax savings @ 24.0%
- +$570
- After-tax cash flow
- $2,297/yr
For passive investors: Depreciation is non-cash, so a rental often shows a tax loss while cash-flowing — sheltering income. Rental losses are passive: they offset passive income freely, and up to $25,000/yr can offset ordinary (W-2) income if you actively participate and your MAGI is under $100k (phasing out to $0 by $150k); unused losses carry forward. On sale, claimed depreciation is recaptured at up to 25%, and gains may owe capital-gains tax (a 1031 exchange can defer both). Figures are a year-1 estimate at your 24.0% rate — not tax advice; consult a CPA.
Schools (NCES district)
- District
- Baltimore County Public Schools
- NCES district ID
- 2400120
- Math proficiency
- 15% ▼ -16.00%
- Reading proficiency
- 34% ▼ -5.00%
- Median HH income
- $66,746
- Composite
- 23.17/100
- National rank
- #7948
- State rank
- #11 of 24 in MD
Livability — Overlea
- Score
- 81/100
- State rank
- #38
- US rank
- #1418
Category grades
Schools grade is shown separately in the Schools card above.
Census & demographics
- Census place
- Overlea, MD
- County
- Baltimore City · 558,601 people
- Metro
- Baltimore-Columbia-Towson, MD
- Population (ZIP)
- 48,902
- Household income
- $64,531
- Rent vs Own
- Severe rent burden
- 2317.0
Population outlook (Baltimore County) Hauer SSP2
- Today (2025)
- 885,518 people
- By 2030
- 909,272 · +2.7%
- By 2040
- 951,547 · +7.5%
- By 2050
- 990,955 · +11.9%
- By 2075
- 1,086,411 · +22.7%
- By 2100
- 1,135,078 · +28.2%
Race, ethnicity, and origin ACS 2023
- Neighborhood character
- Predominantly Black (73%)
- Race & ethnicity
- Black 73% White 20% Two or more races 3% Hispanic / Latino 3% Asian 2%
- Common ancestry
- Romanian 3% Ukrainian 1%
- Foreign-born
- 8% · Canada
- Languages at home
- 92% English-only · Spanish 2% Arabic 2% Other Indo-European 1%
Political lean MEDSL · Baltimore
- 2024 margin
- Strong D (+24.5) · D 61.0% · R 36.5% · Other 2.5%
- 2008→2024 swing
- +9.9pp toward D · 2008: 14.6pp · 2024: 24.5pp
- All cycles
- 2024: D+24.5 2020: D+27.0 2016: D+17.4 2012: D+16.4 2008: D+14.6
Not yet ingested
- Civics
- —
Market trends
- HPI YoY
- ▼ -191.83%
- Current HPI
- 284.5645
- Rent YoY
- ▲ 4.43%
- Metro
- Baltimore-Columbia-Towson, MD
- State GDP YoY
- ▲ 2.97%
- F500 in state
- 12
Industry mix (Fortune 500 HQ in MD)
| Industry | F500 HQs | Revenue |
|---|---|---|
| Aerospace / Defense | 1 | $71B |
|
||
| Utilities | 1 | $25B |
|
||
| Hotels | 1 | $24B |
|
||
| Consumer Goods | 1 | $7B |
|
||
| Real Estate | 1 | $6B |
|
||
| Chemicals | 1 | $2B |
|
||
Price history
+993.9% since first listed9 events — show timeline
- 2025-09-12 Listed $251,600 BRIGHT MLS
- 2018-09-17 Sold (Public Records) $195,000 Public Records
- 2018-08-24 Sold (MLS) $195,000 MRIS
- 2018-08-24 Sold (MLS) $195,000 BRIGHT MLS
- 2018-07-14 Contingent — BRIGHT MLS
- 2018-07-14 Pending — MRIS
- 2018-06-08 Listed $199,999 MRIS
- 2018-06-08 Listed $199,999 BRIGHT MLS
- 1976-12-01 Sold (Public Records) $23,000 Public Records
Property tax history
+5.5%/yrLatest (2025): $4,526 · +8.2% YoY. Source: county tax records.
Cash-flow waterfall
monthlySold comps — $/sqft
last 12 mo · ≤1 miLoading sold comps…