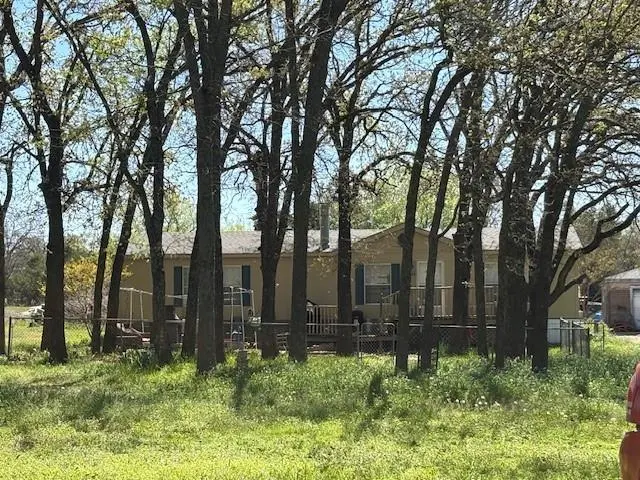
2528 County Road 531 · Burleson, TX
Flood risk 1/10 · Minimal
- FEMA flood zone
- X (unshaded)
- Chance of flooding over 30 yrs
- 0.0%
- Est. flood insurance / yr
- $507 – $1,088
Fire risk 5/10 · Moderate
- Est. fire insurance / yr
- $1,222 – $2,270
Heat risk 7/10 · Major
- Hot days now (above 110°F)
- 7 days/yr
- Hot days in 30 yrs
- 25 days/yr
Wind risk 6/10 · Moderate
- Chance of severe wind over 30 yrs
- 27.0%
Air-quality risk 2/10 · Minimal
- Unhealthy air days now
- 2 days/yr
- Unhealthy air days in 30 yrs
- 2 days/yr
Risk factors via First Street. Map © Google.
Why this score? — see what drove the D+ grade
The composite is a weighted blend of 9 inputs, each scored 0–100. Each bar is that input's sub-score; the figure is the points it added to the 100-point composite (weight × sub-score).
- Cash flow +15.4/30.0
- ARV discount +7.5/15.0
- DSCR +4.7/10.0
- 1% rule +4.4/10.0
- Schools +4.0/10.0
- Livability +4.0/5.0
- Rent growth +2.9/5.0
- Condition / age +2.5/5.0
- Appreciation +0.0/10.0
$213,000
🖨 Deal sheet 📄 Offer letter ✓ Due diligence
Listing remarks
5-26-26 we have an accepted offer. Status will change once contract is executed. Great 4 bedroom, 2 bath home with a fireplace and large kitchen located in a quiet area of the country but still close enough to just about everything. It gas approx 2.5 acres of land with a 1 car detached garage and several large storage buildings. It would make a great retirement home or rental property just bring your imagination. The seller does not accept blind offers or escalation clauses. Buyer to verify all information.
Key facts
- 2.53 acre lot
- Garage
- Built 1982
Property features AI
Finance
- Other: Property type: Residential manufactured home; Lot approximately 2.534 acres (will not subdivide)
- Financial info: Listing accepted for cash or conventional financing; Property listed as real estate owned
- HOA & community: No association
Exterior
- Parking: Covered parking; Driveway; Garage that faces front; 1-car garage (approx. 11' wide x 20' long)
- Utilities: Aerobic septic system; Septic; Cable available
- Home design: Manufactured home (residential); One level
- Construction: Siding exterior; Pillar/post/pier foundation; Built in 1982
- Exterior features: Covered front porch; Covered patio; Exterior storage; Wire fencing; Few trees on the lot
Interior
- Kitchen: Electric range; Dishwasher; Disposal; Water line to refrigerator
- Bedrooms: 4 bedrooms (all on main level); Primary bedroom with ensuite bath, garden tub, separate shower, separate vanities, and walk-in closet; Other bedrooms arranged in a split-bedroom plan
- Flooring: Carpet; Vinyl
- Bathrooms: 2 full bathrooms; Primary bath with dual sinks, garden tub, and separate shower
- Heating & cooling: Central heating (electric); Central air conditioning; Ceiling fans
- Interior features: Open floorplan; Cable TV available; High-speed internet available; Window coverings; Fireplace (wood-burning)
- Laundry & utility: Full-size washer/dryer area; Washer hookup; Electric dryer hookup; Electric water heater
Neighborhood map
What this means for you Summary
Snapshot
- This is a 4-bed/2.0-bath manufactured listed at $213k.
Deal economics
- At list price, monthly cash flow is $83 ($1k/yr) — positive.
- The deal already cash-flows at list — no discount required.
- To meet the 1% rule (rent ≥ 1% of price), the offer needs to be $199k (6.4% below list).
- Recommended offer: $199k (6.4% below list) — sets the bar for 1% rule.
- Cap rate 6.8% vs local median 3.5% in Burleson — top-decile yield for the area; either an underpriced asset or a hidden risk that comps aren't pricing in. Stress-test before assuming the spread holds.
Location & tenants
- Location reads 79/100 on livability (#53 in TX, #2,133 nationally) — a middle-class / working-renter tenant base. Strengths: employment A+, cost of living A+, housing A+; Watch: amenities F, commute F.
- Burleson ISD (suburban): math 41% / reading 48% proficiency, ranked #236 of 826 in TX (top 29%) — families likely to look elsewhere, expect single-tenant / working-renter base with shorter leases.
- Zoned schools: William Stribling El (math 48% / reading 49%, grade D, #950 of 4,322 statewide, top 22%, 476 students, 33% FRL) — zoned schools at 33% FRL track the district average.
- Market conditions: Rents rising (+1.8%/yr); 679 active listings in the ZIP; solid renter incomes; 2,152 units permitted in Johnson County in 2024 (76 in 5+ unit buildings).
Forward outlook
- Local home prices are declining (-3.0%/yr); year-one equity from $1k of loan paydown is wiped out by about $6k of value loss. Plan a longer hold.
- Johnson County population projected at +24% by 2050 — long-run rental-demand tailwind backs the buy-and-hold thesis.
Negotiation context
- It's been on market 18 days — a 2% lower offer ($210k) is reasonable based on typical stale-listing flexibility.
Risks & watch-outs
- Climate carrying-cost: major wind risk, 27% chance of damaging wind over 30y; moderate wildfire risk; extreme-heat days projected 7→25/yr by 2055 (HVAC capex compounding) — expect insurance premiums to compound above CPI over the hold.
Questions for the listing agent
- Is there a deadline driving the sale (1031 exchange, divorce, estate, relocation)? That informs how much negotiation room exists.
- The area grade is low — what's the realistic commute time and amenity access for the typical tenant pool here? Any planned neighborhood developments (good or bad) we should know about?
- What's the average days-on-market for RENTAL listings here right now (not sales)? A rising rental-DOM trend means longer vacancies and softer asking-rent achievability than the comps imply.
- What's the recent tenant-quality profile in this submarket — average credit score on applications, eviction rate, late-payment / NSF rate, and stable-employment percentage? A property-management company in the area should have these aggregated.
- How much new for-sale + rental construction is in the pipeline within 1–3 miles? Heavy new supply typically softens prices + rents 12–24 months out; constrained supply supports both.
Investment metrics
- 1% rule
- 0.94% ✗
- Cap rate
- 6.76%
- Cash-on-cash
- 1.68%
- DSCR
- 1.07
- GRM
- 8.9
CMA / ARV
No comps found within radius.
Projected returns pro-forma
-3.0% appreciation · 1.78% rent growth · sell at horizon
- IRR
- -15.0%
- Equity multiple
- 0.47×
- Total profit
- $-31,586
- Equity at exit
- $31,759
- IRR
- -8.6%
- Equity multiple
- 0.49×
- Total profit
- $-30,184
- Equity at exit
- $18,416
Cash invested: $59,640 (down + closing). Projections, not guarantees.
Landlord ↔ Tenant lean methodology
- Overall (STATE)
- 87 Strongly Landlord-Friendly
- State Texas
- 87 Strongly Landlord-Friendly · R+5
- County
- — inherits STATE
- City
- — inherits STATE
ZIP-level market 76028
- Home prices YoY
- -33.4%
- Rents YoY
- 1.8%
- Active inventory
- 679
- Price-to-rent
- 8.9×
Monthly cashflow live
- Estimated rent
- $1,994 medium interval (Pro) →
- Mortgage (P&I)
- −$1,117
- Tax from tax record
- −$286 /mo · $3,437/yr
- Insurance
- −$89
- HOA
- −$0
- Vacancy / Maint / Mgmt
- −$419
- Net cashflow
- $83
Break-even live
UW: 25.0% down · 7.5% · 30yr · 1.5% tax · 5.0% vac · 8.0% maint · 8.0% mgmt
Financing live
Cash to close
- Down payment
- $53,250
- Closing costs
- $6,390
- Reserves months
- —
- Total cash needed
- —
Loan-product check · same deal, 3 products live
Conventional
25% down · 7.5% · 30yr
- Down + closing
- —
- Monthly P&I
- —
- Monthly cashflow
- —
- DSCR
- —
- Eligible?
- —
Personal DTI + credit; lowest rate.
DSCR
20% down · 8.5% · 30yr
- Down + closing
- —
- Monthly P&I
- —
- Monthly cashflow
- —
- DSCR
- —
- Eligible?
- —
No personal income docs; deal must DSCR.
Hard money
10% down · 12.0% · 12mo
- Down + closing
- —
- Monthly P&I
- —
- Monthly cashflow
- —
- DSCR
- —
- Eligible?
- —
Short-term bridge; refi at stabilization.
Listing history 2 events
-
2026-05-11$213,000 Active
-
1998-10-15soldstatus
ⓘ Source: listings_history table (triggers on properties + properties_extension) + one-shot
backfill from property_details.listing_events for pre-trigger history.
Tax reassessment forecast TX · Resets to sale price
- Current annual tax
- $3,437 · $286/mo
- Projected year-2 tax
- $3,898 · $325/mo
- Expected delta
- +$461/yr (+$38/mo · 13.4%)
ⓘ Screening estimate from a state-policy table — verify with the county assessor before closing.
Climate risk First Street
- Flood 1/10 Low FEMA zone X (unshaded) · 0% chance over 30 yrs
- Wildfire 5/10 Major
- Heat 7/10 Severe 7 d/yr ≥110°F today · 25 d/yr by 30 yrs out
- Wind 6/10 Major 27% chance of damaging wind over 30 yrs
- Air quality 2/10 Low 2 unhealthy d/yr today · 2 by 30 yrs out
Nearby sold comps map
Loading sold comps map…
Walkable amenities ~0.75 mi
Loading nearby amenities…
Taxation est. · year 1
- Rental income
- $23,931
- − Mortgage interest
- −$11,931
- − Property taxes
- −$3,437
- − Insurance
- −$1,065
- − Repairs & maintenance
- −$1,914
- − Management
- −$1,914
- − Depreciation
- −$6,196
- Taxable loss
- −$2,528
- Est. tax savings @ 24.0%
- +$607
- After-tax cash flow
- $1,606/yr
For passive investors: Depreciation is non-cash, so a rental often shows a tax loss while cash-flowing — sheltering income. Rental losses are passive: they offset passive income freely, and up to $25,000/yr can offset ordinary (W-2) income if you actively participate and your MAGI is under $100k (phasing out to $0 by $150k); unused losses carry forward. On sale, claimed depreciation is recaptured at up to 25%, and gains may owe capital-gains tax (a 1031 exchange can defer both). Figures are a year-1 estimate at your 24.0% rate — not tax advice; consult a CPA.
Schools (NCES district)
- District
- Burleson ISD
- NCES district ID
- 4812180
- Math proficiency
- 41% ▼ -8.00%
- Reading proficiency
- 48% ▼ -3.00%
- Median HH income
- $69,349
- Composite
- 40.05/100
- National rank
- #3818
- State rank
- #236 of 826 in TX
Livability — Burleson
- Score
- 79/100
- State rank
- #53
- US rank
- #2133
Category grades
Schools grade is shown separately in the Schools card above.
Census & demographics
- County
- Johnson County · 147,987 people
- City population
- 81,549
- Metro
- Dallas-Fort Worth-Arlington, TX
- Population (ZIP)
- 81,549
- Household income
- $101,138
- Rent vs Own
- Severe rent burden
- 1117.0
Population outlook (Johnson County) Hauer SSP2
- Today (2025)
- 179,678 people
- By 2030
- 189,208 · +5.3%
- By 2040
- 207,261 · +15.4%
- By 2050
- 223,064 · +24.1%
- By 2075
- 259,979 · +44.7%
- By 2100
- 275,395 · +53.3%
Race, ethnicity, and origin ACS 2023
- Neighborhood character
- Predominantly White (69%)
- Race & ethnicity
- White 69% Hispanic / Latino 19% Two or more races 11% Black 6% Asian 1%
- Hispanic origin (detail)
- Mexican 17%
- Common ancestry
- Lithuanian 2% Italian 2% Slovak 2%
- Foreign-born
- 5% · Canada
- Languages at home
- 88% English-only · Spanish 10% Other Indo-European 1%
Political lean MEDSL · Johnson
- 2024 margin
- Solid R (+51.4) · D 23.9% · R 75.3%
- 2008→2024 swing
- -3.9pp toward R · 2008: -47.5pp · 2024: -51.4pp
- All cycles
- 2024: R+51.4 2020: R+53.0 2016: R+58.3 2012: R+55.6 2008: R+47.5
Not yet ingested
- Civics
- —
Market trends
- HPI YoY
- ▼ -141.44%
- Current HPI
- 282.466
- Rent YoY
- ▲ 1.78%
- Metro
- Dallas-Fort Worth-Arlington, TX
- State GDP YoY
- ▲ 3.95%
- F500 in state
- 110
Industry mix (Fortune 500 HQ in TX)
| Industry | F500 HQs | Revenue |
|---|---|---|
| Energy | 16 | $1,198B |
|
||
| Technology | 5 | $198B |
|
||
| Engineering / Construction | 4 | $72B |
|
||
| Energy Services | 3 | $60B |
|
||
| Utilities | 3 | $41B |
|
||
| Healthcare | 2 | $330B |
|
||
Price history
2 events — show timeline
- 2026-05-11 Listed $213,000 NTREIS
- 1998-10-15 Sold (Public Records) — Public Records
Property tax history
+7.2%/yrLatest (2025): $3,437 · +10.6% YoY. Source: county tax records.
Cash-flow waterfall
monthlySold comps — $/sqft
last 12 mo · ≤1 miLoading sold comps…