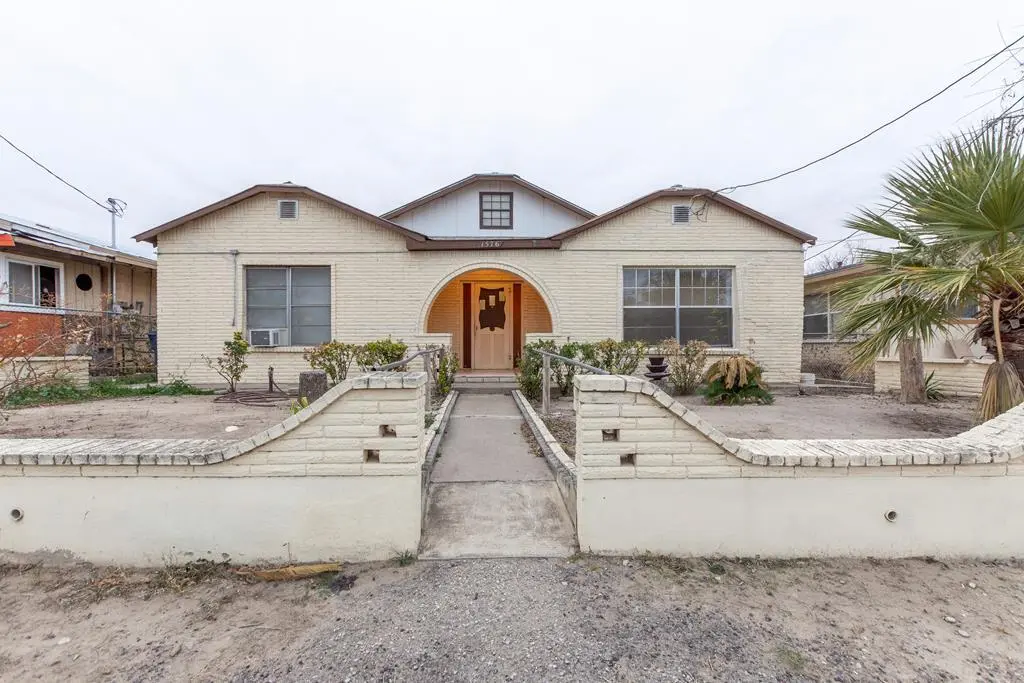
1576 El Indio Hwy · Eagle Pass, TX
Flood risk 1/10 · Minimal
- FEMA flood zone
- X (unshaded)
- Chance of flooding over 30 yrs
- 0.0%
- Est. flood insurance / yr
- $507 – $1,088
Fire risk 4/10 · Minor
- Est. fire insurance / yr
- $1,222 – $2,270
Heat risk 8/10 · Major
- Hot days now (above 111°F)
- 7 days/yr
- Hot days in 30 yrs
- 24 days/yr
Wind risk 6/10 · Moderate
- Chance of severe wind over 30 yrs
- 27.0%
Air-quality risk 1/10 · Minimal
- Unhealthy air days now
- 0 days/yr
- Unhealthy air days in 30 yrs
- 0 days/yr
Risk factors via First Street. Map © Google.
Why this score? — see what drove the C- grade
The composite is a weighted blend of 9 inputs, each scored 0–100. Each bar is that input's sub-score; the figure is the points it added to the 100-point composite (weight × sub-score).
- Cash flow +16.8/30.0
- ARV discount +15.0/15.0
- DSCR +5.2/10.0
- 1% rule +4.4/10.0
- Livability +3.7/5.0
- Rent growth +2.5/5.0
- Condition / age +2.5/5.0
- Schools +1.7/10.0
- Appreciation +0.0/10.0
$155,000
🖨 Deal sheet 📄 Offer letter ✓ Due diligence
Listing remarks
Original MLS#: 73071; Age Range: UNKNOWN; Appraisal District ID: 19226; Apx Bsmt SqFt: 0; Apx Lot Size SqFt: 0.16; Misc Exterior: Fenced; Qualify: No
Key facts
- Fenced
- 6,969 sq ft lot
- Listed 9 days
Tags
Neighborhood map
What this means for you Summary
Snapshot
- This is a 3-bed/2.0-bath single-family listed at $155k.
Deal economics
- At list price, monthly cash flow is $100 ($1k/yr) — positive.
- The deal already cash-flows at list — no discount required.
- To meet the 1% rule (rent ≥ 1% of price), the offer needs to be $146k (5.9% below list).
- Recommended offer: $146k (5.9% below list) — sets the bar for 1% rule.
- Cap rate 7.1% vs local median 3.4% in Eagle Pass — top-decile yield for the area; either an underpriced asset or a hidden risk that comps aren't pricing in. Stress-test before assuming the spread holds.
Location & tenants
- Location reads 73/100 on livability (#227 in TX) — a middle-class / working-renter tenant base. Strengths: cost of living A+, housing A+, health & safety A+; Watch: amenities D+, schools D, commute F.
- Eagle Pass ISD (town): math 15% / reading 28% proficiency, ranked #774 of 826 in TX (top 94%) — low school quality limits family demand, transient renter base, plan for 1-2y turnover.
- Market conditions: 461 active listings in the ZIP; 5 comparable units currently listed for rent nearby; rentals lingering (median 44d on market — plan ~5-8 weeks vacancy on turnover, expect pricing pressure); 100% of comp listings sitting > 30 days — soft ceiling on asking rent; 66 units permitted in Maverick County in 2024 (0 in 5+ unit buildings).
- This rent runs 35% of the median local income ($50k/yr) — at the standard rent-burdened threshold; future hikes will face affordability resistance.
Forward outlook
- Local home prices are declining (-3.0%/yr); year-one equity from $1k of loan paydown is wiped out by about $5k of value loss. Plan a longer hold.
- Maverick County population projected at +18% by 2050 — long-run rental-demand tailwind backs the buy-and-hold thesis.
Negotiation context
- Only 10 days on market — expect competitive offers; lowballing is unlikely to land.
- 4 sale attempts since 4y ago; this cycle's ask has dropped $19k (11%) from the opening price — seller is motivated, your offer sets the floor, not the list.
Risks & watch-outs
- Climate carrying-cost: major wind risk, 27% chance of damaging wind over 30y; extreme-heat days projected 7→24/yr by 2055 (HVAC capex compounding) — expect insurance premiums to compound above CPI over the hold.
Questions for the listing agent
- Is there a deadline driving the sale (1031 exchange, divorce, estate, relocation)? That informs how much negotiation room exists.
- Schools are D-rated, which usually means shorter tenancies and higher turnover. Who's the typical renter profile here, and what's been the actual vacancy rate?
- What's the average days-on-market for RENTAL listings here right now (not sales)? A rising rental-DOM trend means longer vacancies and softer asking-rent achievability than the comps imply.
- What's the recent tenant-quality profile in this submarket — average credit score on applications, eviction rate, late-payment / NSF rate, and stable-employment percentage? A property-management company in the area should have these aggregated.
- How much new for-sale + rental construction is in the pipeline within 1–3 miles? Heavy new supply typically softens prices + rents 12–24 months out; constrained supply supports both.
Investment metrics
- 1% rule
- 0.94% ✗
- Cap rate
- 7.07%
- Cash-on-cash
- 2.77%
- DSCR
- 1.12
- GRM
- 8.9
CMA / ARV
- ARV (median comp)
- $193,621
- List price
- $155,000
- Delta
- -19.95%
- Verdict
- UNDERPRICED
- Comps
- 5 within 2.0 mi
Show comp detail 12 sales within ~0.75 mi
| Address | Dist | Beds/Ba | Sqft | Sold | Price | $/sf | Match |
|---|---|---|---|---|---|---|---|
| 1793 Cox St | 0.30mi | 3/2.0 | 1,420 (+2%) | 8mo | $279,500 | $197 | 76 |
| 1789 Cox St Unit N/A | 0.30mi | 3/2.0 | 1,381 (-1%) | 14mo | $269,500 | $195 | 74 |
| 1923 N Cox St Unit N/A | 0.35mi | 4/2.0 (+1) | 1,400 (+1%) | 15mo | $180,000 | $129 | 65 |
| 1770 Brown St | 0.34mi | 3/1.0 | 1,445 (+4%) | 14mo | $105,000 | $73 | 62 |
| 1895 Wilson St | 0.41mi | 4/2.0 (+1) | 1,410 (+2%) | 16mo | $199,500 | $141 | 60 |
| 325 Trinity St | 0.58mi | 3/1.0 | 1,326 (-4%) | 5mo | $105,000 | $79 | 57 |
| 165 Los Angeles Dr | 0.43mi | 3/2.0 | 1,299 (-6%) | 17mo | $265,900 | $205 | 55 |
| 250 N Blanco | 0.56mi | 3/1.0 | 1,264 (-9%) | 5mo | $90,000 | $71 | 51 |
| — | 0.66mi | 3/2.0 | 1,364 (-2%) | 21mo | $249,900 | $183 | 49 |
| 1598 Bryan St | 0.29mi | 3/1.5 | 1,234 (-11%) | 22mo | $168,000 | $136 | 48 |
| 1009 Kiriaka Dr | 0.69mi | 3/2.0 | 1,327 (-4%) | 19mo | $180,000 | $136 | 45 |
| 1979 NE Hillcrest | 0.66mi | 3/1.0 | 1,300 (-6%) | 13mo | $90,000 | $69 | 43 |
Match score weights: distance 35% · size 25% · config 20% · recency 20%. Top-matched comps best support the ARV.
Projected returns pro-forma
-3.0% appreciation · 3.0% rent growth · sell at horizon
- IRR
- -11.9%
- Equity multiple
- 0.57×
- Total profit
- $-18,737
- Equity at exit
- $23,111
- IRR
- -2.8%
- Equity multiple
- 0.81×
- Total profit
- $-8,072
- Equity at exit
- $13,402
Cash invested: $43,400 (down + closing). Projections, not guarantees.
Landlord ↔ Tenant lean methodology
- Overall (STATE)
- 87 Strongly Landlord-Friendly
- State Texas
- 87 Strongly Landlord-Friendly · R+5
- County
- — inherits STATE
- City
- — inherits STATE
ZIP-level market 78852
- Home prices YoY
- -27.5%
- Active inventory
- 461
- Price-to-rent
- 8.9×
Monthly cashflow live
- Estimated rent
- $1,458 high interval (Pro) →
- Mortgage (P&I)
- −$813
- Tax from tax record
- −$174 /mo · $2,091/yr
- Insurance
- −$65
- HOA
- −$0
- Vacancy / Maint / Mgmt
- −$306
- Net cashflow
- $100
Break-even live
UW: 25.0% down · 7.5% · 30yr · 1.5% tax · 5.0% vac · 8.0% maint · 8.0% mgmt
Financing live
Cash to close
- Down payment
- $38,750
- Closing costs
- $4,650
- Reserves months
- —
- Total cash needed
- —
Loan-product check · same deal, 3 products live
Conventional
25% down · 7.5% · 30yr
- Down + closing
- —
- Monthly P&I
- —
- Monthly cashflow
- —
- DSCR
- —
- Eligible?
- —
Personal DTI + credit; lowest rate.
DSCR
20% down · 8.5% · 30yr
- Down + closing
- —
- Monthly P&I
- —
- Monthly cashflow
- —
- DSCR
- —
- Eligible?
- —
No personal income docs; deal must DSCR.
Hard money
10% down · 12.0% · 12mo
- Down + closing
- —
- Monthly P&I
- —
- Monthly cashflow
- —
- DSCR
- —
- Eligible?
- —
Short-term bridge; refi at stabilization.
Rent comps 5 comps
| Address | Beds | Baths | Sqft | Rent | $/sqft | DOM | Units | Dist |
|---|---|---|---|---|---|---|---|---|
| 1454 E Garrison St Unit 1 Eagle Pass, TX | 2.0 | 1.0 | 1034 | $1,650 | $1.60 | 43d | 1 | 0.33mi |
| 1009 Kiriaka Dr Eagle Pass, TX | 3.0 | 2.0 | 1327 | $1,600 | $1.21 | 43d | 1 | 0.70mi |
| 130 N Adams St Unit 1 Eagle Pass, TX | 2.0 | 2.0 | 1250 | $1,100 | $0.88 | 43d | 1 | 0.71mi |
| 475 Jefferson St Unit 1 Eagle Pass, TX | 2.0 | 2.0 | 900 | $1,200 | $1.33 | 43d | 1 | 0.83mi |
| 889 Tampico Cir Eagle Pass, TX | 4.0 | 2.0 | 1495 | $1,400 | $0.94 | 43d | 1 | 1.25mi |
Listing history 25 events
-
2026-06-19days on market $155,000 Active 10 DOM
-
2026-06-18days on market $155,000 Active 9 DOM
-
2026-06-17days on market $155,000 Active 8 DOM
-
2026-06-16days on market $155,000 Active 7 DOM
-
2026-06-15days on market $155,000 Active 6 DOM
-
2026-06-14days on market $155,000 Active 4 DOM
-
2026-06-13days on market $155,000 Active 3 DOM
-
2026-06-10remarks 149-char remark
-
2026-06-10days on market $155,000 Active 1 DOM
-
2026-06-09days on market $155,000 Active 936 DOM
-
2026-06-08days on market $155,000 Active 935 DOM
-
2026-06-07days on market $155,000 Active 934 DOM
-
2026-06-05days on market $155,000 Active 931 DOM
-
2026-06-02days on market $155,000 Active 929 DOM
-
2026-06-01days on market $155,000 Active 928 DOM
-
2026-05-31days on market $155,000 Active 927 DOM
-
2026-05-30days on market $155,000 Active 926 DOM
-
2026-04-29price $155,000
-
2026-04-02status Active
-
2025-08-16price $160,000
-
2025-03-04status Active
-
2023-11-28price $168,500
-
2023-11-14status Active
-
2022-01-23$174,000
-
2017-02-13soldstatus
ⓘ Source: listings_history table (triggers on properties + properties_extension) + one-shot
backfill from property_details.listing_events for pre-trigger history.
Tax reassessment forecast TX · Resets to sale price
- Current annual tax
- $2,091 · $174/mo
- Projected year-2 tax
- $2,836 · $236/mo
- Expected delta
- +$746/yr (+$62/mo · 35.7%)
ⓘ Screening estimate from a state-policy table — verify with the county assessor before closing.
Climate risk First Street
- Flood 1/10 Low FEMA zone X (unshaded) · 0% chance over 30 yrs
- Wildfire 4/10 Moderate
- Heat 8/10 Severe 7 d/yr ≥111°F today · 24 d/yr by 30 yrs out
- Wind 6/10 Major 27% chance of damaging wind over 30 yrs
- Air quality 1/10 Low 0 unhealthy d/yr today · 0 by 30 yrs out
Nearby sold comps map
Loading sold comps map…
Walkable amenities ~0.75 mi
Loading nearby amenities…
Taxation est. · year 1
- Rental income
- $17,493
- − Mortgage interest
- −$8,682
- − Property taxes
- −$2,091
- − Insurance
- −$775
- − Repairs & maintenance
- −$1,399
- − Management
- −$1,399
- − Depreciation
- −$4,509
- Taxable loss
- −$1,363
- Est. tax savings @ 24.0%
- +$327
- After-tax cash flow
- $1,527/yr
For passive investors: Depreciation is non-cash, so a rental often shows a tax loss while cash-flowing — sheltering income. Rental losses are passive: they offset passive income freely, and up to $25,000/yr can offset ordinary (W-2) income if you actively participate and your MAGI is under $100k (phasing out to $0 by $150k); unused losses carry forward. On sale, claimed depreciation is recaptured at up to 25%, and gains may owe capital-gains tax (a 1031 exchange can defer both). Figures are a year-1 estimate at your 24.0% rate — not tax advice; consult a CPA.
Schools (NCES district)
- District
- Eagle Pass ISD
- NCES district ID
- 4817730
- Math proficiency
- 15% ▼ -41.00%
- Reading proficiency
- 28% ▼ -18.00%
- Median HH income
- $32,967
- Composite
- 17.48/100
- National rank
- #9057
- State rank
- #774 of 826 in TX
Livability — Eagle Pass
- Score
- 73/100
- State rank
- #227
- US rank
- #5530
Category grades
Schools grade is shown separately in the Schools card above.
Census & demographics
- Census place
- Eagle Pass, TX
- County
- Maverick County · 57,434 people
- City population
- 57,434
- Metro
- Eagle Pass, TX
- Population (ZIP)
- 57,434
- Household income
- $49,954
- Rent vs Own
- Severe rent burden
- 822.0
Population outlook (Maverick County) Hauer SSP2
- Today (2025)
- 62,919 people
- By 2030
- 65,440 · +4.0%
- By 2040
- 70,229 · +11.6%
- By 2050
- 74,218 · +18.0%
- By 2075
- 80,765 · +28.4%
- By 2100
- 76,268 · +21.2%
Race, ethnicity, and origin ACS 2023
- Neighborhood character
- Predominantly Hispanic (95%)
- Race & ethnicity
- Hispanic / Latino 95% Two or more races 53% White 3% Native American 2%
- Hispanic origin (detail)
- Mexican 91% Puerto Rican 1%
- Foreign-born
- 30% · Canada
- Languages at home
- 11% English-only · Spanish 88%
Political lean MEDSL · Maverick
- 2024 margin
- R (+18.5) · D 40.5% · R 59.0%
- 2008→2024 swing
- -75.5pp toward R · 2008: 57.0pp · 2024: -18.5pp
- All cycles
- 2024: R+18.5 2020: D+9.4 2016: D+55.8 2012: D+58.0 2008: D+57.0
Not yet ingested
- Civics
- —
Market trends
- HPI YoY
- ▼ -65.62%
- Current HPI
- 172.9298
- Rent YoY
- —
- Metro
- Eagle Pass, TX
- State GDP YoY
- ▲ 3.95%
- F500 in state
- 110
Industry mix (Fortune 500 HQ in TX)
| Industry | F500 HQs | Revenue |
|---|---|---|
| Energy | 16 | $1,198B |
|
||
| Technology | 5 | $198B |
|
||
| Engineering / Construction | 4 | $72B |
|
||
| Energy Services | 3 | $60B |
|
||
| Utilities | 3 | $41B |
|
||
| Healthcare | 2 | $330B |
|
||
Price history
-10.9% since first listed8 events — show timeline
- 2026-04-29 Price Changed $155,000 EPBOR
- 2026-04-02 Relisted — EPBOR
- 2025-08-16 Price Changed $160,000 EPBOR
- 2025-03-04 Relisted — EPBOR
- 2023-11-28 Price Changed $168,500 EPBOR
- 2023-11-14 Relisted — EPBOR
- 2022-01-23 Listed $174,000 EPBOR
- 2017-02-13 Sold (Public Records) — Public Records
Property tax history
+3.5%/yrLatest (2025): $2,091 · +11.8% YoY. Source: county tax records.
Cash-flow waterfall
monthlySold comps — $/sqft
last 12 mo · ≤1 miLoading sold comps…