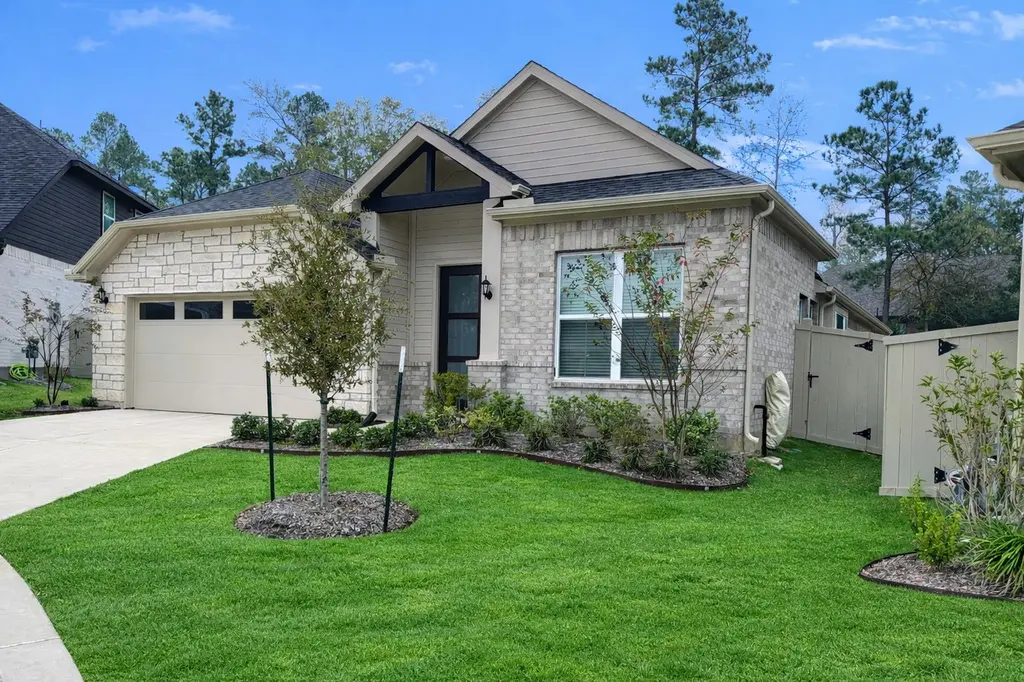
15034 Baikal Teal Ter · Magnolia, TX
Flood risk No data
- FEMA flood zone
- —
- Chance of flooding over 30 yrs
- —
- Est. flood insurance / yr
- —
Fire risk No data
- Est. fire insurance / yr
- —
Heat risk No data
- Hot days now (above threshold)
- —
- Hot days in 30 yrs
- —
Wind risk No data
- Chance of severe wind over 30 yrs
- —
Air-quality risk No data
- Unhealthy air days now
- —
- Unhealthy air days in 30 yrs
- —
Risk factors via First Street. Map © Google.
Why this score? — see what drove the D grade
The composite is a weighted blend of 9 inputs, each scored 0–100. Each bar is that input's sub-score; the figure is the points it added to the 100-point composite (weight × sub-score).
- Appreciation +10.0/10.0
- ARV discount +9.5/15.0
- Cash flow +6.4/30.0
- Schools +3.9/10.0
- Livability +3.7/5.0
- 1% rule +2.6/10.0
- Rent growth +2.6/5.0
- Condition / age +2.5/5.0
- DSCR +0.7/10.0
$312,000
🖨 Deal sheet (PDF) 📄 Offer letter ✓ Due diligence
Listing remarks MLS
Now available in Audubon, a master-planned community in Magnolia, the Davenport by Smith Douglas Homes is a 1-story, 3-bedroom, 2-bath home on a cul-de-sac homesite featuring a study, game room, fireplace, and covered back patio. Enjoy upgrades like granite countertops, white 42” kitchen cabinets, undercabinet lighting, stainless steel appliances, vinyl plank flooring, dual vanities in the primary bath with garden tub and separate shower, stone-accented elevation, full sod and irrigation, gutters, TechShield radiant barrier, and more. Audubon offers resort-style amenities including Club Audubon with pool, pavilion, cabanas, trails, playgrounds, an onsite school, and future commercial space—all just minutes from nearby shopping. Available now!
Key facts
- Cul-de-sac lot
- Open-concept kitchen
- Nearby parks
Tags
Neighborhood map
What this means for you Summary
Snapshot
- This is a 3-bed/2.0-bath single-family listed at $312k.
Deal economics
- At list price, monthly cash flow is $-534 ($-6k/yr) — negative.
- To cash-flow at today's rent, offer at most $218k (30.2% below list).
- To meet the 1% rule (rent ≥ 1% of price), the offer needs to be $238k (23.6% below list).
- Recommended offer: $218k (30.2% below list) — sets the bar for cash-flow.
- Cap rate 4.2% vs local median 3.4% in Magnolia — meaningfully above typical; check what's discounted (condition, days-on-market, listing class) to confirm the premium yield is real.
Location & tenants
- Location reads 73/100 on livability (#222 in TX) — a middle-class / working-renter tenant base. Strengths: crime A+, cost of living A+, housing A+; Watch: amenities F, commute F.
- Magnolia ISD (rural): math 42% / reading 45% proficiency, ranked #247 of 826 in TX (top 30%) — families likely to look elsewhere, expect single-tenant / working-renter base with shorter leases.
- Zoned schools: Willie E Williams El (math 46% / reading 41%, grade F, #1,269 of 4,322 statewide, top 30%, 869 students, 70% FRL); Magnolia J H (math 35% / reading 37%, grade F, #805 of 1,662 statewide, top 50%, 1,103 students, 57% FRL); Magnolia H S (math 47% / reading 62%, grade C-, #379 of 1,632 statewide, top 26%, 2,248 students, 31% FRL).
- Market conditions: Rents flat; 1622 active listings in the ZIP; 7 comparable units currently listed for rent nearby; rentals at typical pace (median 26d on market — plan ~3-4 weeks tenant-placement turnaround); 43% of comp listings sitting > 30 days — soft ceiling on asking rent; high-income renter base; 13,259 units permitted in Montgomery County in 2024 (1,402 in 5+ unit buildings).
Forward outlook
- In year one you build about $33k of equity ($2k loan paydown + $31k appreciation (10.0% local appreciation)).
- Montgomery County population projected at +65% by 2050 — long-run rental-demand tailwind backs the buy-and-hold thesis.
- By year 2, paydown + projected appreciation supports a ~$54k cash-out refi (75% LTV) — recoverable capital for the next deal without selling this one.
Negotiation context
- Only 5 days on market — expect competitive offers; lowballing is unlikely to land.
- 6 sale attempts since 2y ago; this cycle's ask is 12135% above the opening price — seller raised mid-cycle; expect resistance to lowballs.
Questions for the listing agent
- What do current leases actually rent for vs. the listed asking? Can we see a recent rent roll and the last 12 months of T-12 income?
- What does the HOA fee cover, when was the last increase, and are there any pending special assessments or reserve-fund shortfalls?
- Is there a deadline driving the sale (1031 exchange, divorce, estate, relocation)? That informs how much negotiation room exists.
- Schools are D-rated, which usually means shorter tenancies and higher turnover. Who's the typical renter profile here, and what's been the actual vacancy rate?
- The area grade is low — what's the realistic commute time and amenity access for the typical tenant pool here? Any planned neighborhood developments (good or bad) we should know about?
- What's the average days-on-market for RENTAL listings here right now (not sales)? A rising rental-DOM trend means longer vacancies and softer asking-rent achievability than the comps imply.
- What's the recent tenant-quality profile in this submarket — average credit score on applications, eviction rate, late-payment / NSF rate, and stable-employment percentage? A property-management company in the area should have these aggregated.
- How much new for-sale + rental construction is in the pipeline within 1–3 miles? Heavy new supply typically softens prices + rents 12–24 months out; constrained supply supports both.
Investment metrics
- 1% rule
- 0.76% ✗
- Cap rate
- 4.24%
- Cash-on-cash
- -7.33%
- DSCR
- 0.67
- GRM
- 10.9
CMA / ARV
- ARV (on-the-fly)
- $326,688
- Comps found
- 12
Show comp detail 12 sales within ~0.75 mi
| Address | Dist | Beds/Ba | Sqft | Sold | Price | $/sf | Match |
|---|---|---|---|---|---|---|---|
| 15019 Baikal Teal Ter | 0.04mi | 3/2.0 | 1,931 (-3%) | 0mo | $317,900 | $165 | 93 |
| 40610 Mill Creek Rd | 0.15mi | 4/2.0 (+1) | 2,082 (+4%) | 2mo | $575,000 | $276 | 78 |
| 15307 Mountain Plover Pl | 0.19mi | 4/2.5 (+1) | 2,064 (+4%) | 1mo | $314,900 | $153 | 77 |
| 15459 Park Perch Pl | 0.26mi | 4/2.5 (+1) | 2,061 (+4%) | 2mo | $309,990 | $150 | 74 |
| 15443 Park Perch Pl | 0.25mi | 4/2.5 (+1) | 2,064 (+4%) | 2mo | $327,900 | $159 | 74 |
| 40734 Barley Straw Dr | 0.44mi | 4/3.0 (+1) | 2,041 (+2%) | 1mo | $314,990 | $154 | 66 |
| 41046 Riverside Meadows Dr | 0.48mi | 4/3.0 (+1) | 2,060 (+3%) | 3mo | $366,540 | $178 | 61 |
| 40603 Balsam Run Ln | 0.56mi | 4/3.0 (+1) | 2,041 (+2%) | 1mo | $321,990 | $158 | 60 |
| 15206 N Heron Heights Way | 0.74mi | 4/3.0 (+1) | 1,997 (+0%) | 1mo | $335,000 | $168 | 55 |
| 40710 Barley Straw Dr | 0.41mi | 4/2.0 (+1) | 1,750 (-12%) | 2mo | $286,490 | $164 | 54 |
| 14522 Montclair Way | 0.37mi | 4/2.5 (+1) | 2,261 (+14%) | 2mo | $285,000 | $126 | 52 |
| 41050 Riverside Meadows Dr | 0.49mi | 4/3.0 (+1) | 2,255 (+13%) | 3mo | $370,990 | $165 | 44 |
Match score weights: distance 35% · size 25% · config 20% · recency 20%. Top-matched comps best support the ARV.
Projected returns pro-forma
10.0% appreciation · 0.32% rent growth · sell at horizon
- IRR
- 18.3%
- Equity multiple
- 2.49×
- Total profit
- $129,857
- Equity at exit
- $281,074
- IRR
- 16.6%
- Equity multiple
- 5.56×
- Total profit
- $398,175
- Equity at exit
- $606,147
Cash invested: $87,360 (down + closing). Projections, not guarantees.
Landlord ↔ Tenant lean methodology
- Overall (STATE)
- 87 Strongly Landlord-Friendly
- State Texas
- 87 Strongly Landlord-Friendly · R+5
- County
- — inherits STATE
- City
- — inherits STATE
ZIP-level market 77354
- Home prices YoY
- 2.4%
- Rents YoY
- 0.3%
- Active inventory
- 1622
- Price-to-rent
- 10.9×
Monthly cashflow live
- Estimated rent
- $2,384 high interval (Pro) →
- Mortgage (P&I)
- −$1,636
- Tax from tax record
- −$497 /mo · $5,963/yr
- Insurance
- −$130
- HOA
- −$154
- Vacancy / Maint / Mgmt
- −$501
- Net cashflow
- $-534
Break-even live
Sensitivity live
| Price | -10% $-357 | -5% $-446 | +0% $-534 | +5% $-622 | +10% $-710 |
|---|---|---|---|---|---|
| Rent | -10% $-722 | -5% $-628 | +0% $-534 | +5% $-440 | +10% $-346 |
| Rate | -1.0pp $-377 | -0.5pp $-455 | base $-534 | +0.5pp $-615 | +1.0pp $-697 |
UW: 25.0% down · 7.5% · 30yr · 1.5% tax · 5.0% vac · 8.0% maint · 8.0% mgmt
Financing live
Cash to close
- Down payment
- $78,000
- Closing costs
- $9,360
- Reserves months
- —
- Total cash needed
- —
Loan-product check · same deal, 3 products live
Conventional
25% down · 7.5% · 30yr
- Down + closing
- —
- Monthly P&I
- —
- Monthly cashflow
- —
- DSCR
- —
- Eligible?
- —
Personal DTI + credit; lowest rate.
DSCR
20% down · 8.5% · 30yr
- Down + closing
- —
- Monthly P&I
- —
- Monthly cashflow
- —
- DSCR
- —
- Eligible?
- —
No personal income docs; deal must DSCR.
Hard money
10% down · 12.0% · 12mo
- Down + closing
- —
- Monthly P&I
- —
- Monthly cashflow
- —
- DSCR
- —
- Eligible?
- —
Short-term bridge; refi at stabilization.
Rent comps 7 comps
| Address | Beds | Baths | Sqft | Rent | $/sqft | DOM | Units | Dist |
|---|---|---|---|---|---|---|---|---|
| 14541 Montclair Way Montgomery, TX | 4.0 | 3.0 | 2170 | $2,200 | $1.01 | 0d | 1 | 0.31mi |
| 14727 Band Tailed Pigeon Ct Magnolia, TX | 4.0 | 3.0 | 1942 | $2,700 | $1.39 | 45d | 1 | 0.32mi |
| 14983 Clay Harvest Rdg Magnolia, TX | 4.0 | 3.0 | 2173 | $2,375 | $1.09 | 45d | 1 | 0.34mi |
| 15128 Lavender Mist Ct Magnolia, TX | 4.0 | 3.0 | 2561 | $2,800 | $1.09 | 21d | 1 | 0.48mi |
| 39899 Mill Creek Rd Magnolia, TX | 1.0–3.0 | 1.0–2.0 | 1104 | $2,726 | $2.47 | 0d | 40 | 0.59mi |
| 40547 Berylline Ln Magnolia, TX | 4.0 | 2.0 | 1753 | $2,300 | $1.31 | 45d | 1 | 0.79mi |
| 40558 Berylline Ln Unit NA Magnolia, TX | 3.0 | 2.0 | 1499 | $2,150 | $1.43 | 26d | 1 | 0.82mi |
HOA detail
- Monthly dues
- $154 · $1,848/yr
- Likely covers
- landscapingpool
Listing history 6 events
-
2026-06-21days on market $312,000 Active 5 DOM
-
2026-06-18days on market $312,000 Active 2 DOM
-
2026-06-16statusdays on market $312,000 Active 1 DOM
-
2026-06-15days on market $312,000 Coming Soon 4 DOM
-
2026-06-13remarks 699-char remark
-
2026-06-13$312,000 Coming Soon 2 DOM
ⓘ Source: listings_history table (triggers on properties + properties_extension) + one-shot
backfill from property_details.listing_events for pre-trigger history.
Tax reassessment forecast TX · Resets to sale price
- Current annual tax
- $5,963 · $497/mo
- Projected year-2 tax
- $5,963 · $497/mo
- Expected delta
- $0/yr ($0/mo · 0.0%)
ⓘ Screening estimate from a state-policy table — verify with the county assessor before closing.
Nearby sold comps map
Loading sold comps map…
Walkable amenities ~0.75 mi
Loading nearby amenities…
Taxation est. · year 1
- Rental income
- $28,605
- − Mortgage interest
- −$17,477
- − Property taxes
- −$5,963
- − Insurance
- −$1,560
- − Repairs & maintenance
- −$2,288
- − Management
- −$2,288
- − HOA
- −$1,848
- − Depreciation
- −$9,076
- Taxable loss
- −$11,895
- Est. tax savings @ 24.0%
- +$2,855
- After-tax cash flow
- $-3,551/yr
For passive investors: Depreciation is non-cash, so a rental often shows a tax loss while cash-flowing — sheltering income. Rental losses are passive: they offset passive income freely, and up to $25,000/yr can offset ordinary (W-2) income if you actively participate and your MAGI is under $100k (phasing out to $0 by $150k); unused losses carry forward. On sale, claimed depreciation is recaptured at up to 25%, and gains may owe capital-gains tax (a 1031 exchange can defer both). Figures are a year-1 estimate at your 24.0% rate — not tax advice; consult a CPA.
Schools (NCES district)
- District
- Magnolia ISD
- NCES district ID
- 4828740
- Math proficiency
- 42% ▼ -7.00%
- Reading proficiency
- 45% ▼ -4.00%
- Median HH income
- $71,692
- Composite
- 39.46/100
- National rank
- #3958
- State rank
- #247 of 826 in TX
Livability — Magnolia
- Score
- 73/100
- State rank
- #222
- US rank
- #5442
Category grades
Schools grade is shown separately in the Schools card above.
Census & demographics
- County
- Montgomery County · 663,713 people
- City population
- 106,505
- Metro
- Houston-The Woodlands-Sugar Land, TX
- Population (ZIP)
- 44,900
- Household income
- $112,504
- Rent vs Own
- Severe rent burden
- 586.0
Population outlook (Montgomery County) Hauer SSP2
- Today (2025)
- 713,896 people
- By 2030
- 805,263 · +12.8%
- By 2040
- 992,708 · +39.1%
- By 2050
- 1,179,590 · +65.2%
- By 2075
- 1,628,084 · +128.1%
- By 2100
- 1,937,880 · +171.5%
Race, ethnicity, and origin ACS 2023
- Neighborhood character
- Predominantly White (66%)
- Race & ethnicity
- White 66% Hispanic / Latino 25% Two or more races 18% Black 3% Asian 1%
- Hispanic origin (detail)
- Mexican 14% Puerto Rican 1%
- Common ancestry
- Lithuanian 4% Slovak 2% Italian 2%
- Foreign-born
- 11% · Canada, Vietnam
- Languages at home
- 83% English-only · Spanish 15% Other Indo-European 1% German/W. Germanic 1%
Political lean MEDSL · Montgomery
- 2024 margin
- Solid R (+45.5) · D 26.8% · R 72.3%
- 2008→2024 swing
- +7.2pp toward D · 2008: -52.7pp · 2024: -45.5pp
- All cycles
- 2024: R+45.5 2020: R+43.8 2016: R+51.4 2012: R+60.7 2008: R+52.7
Not yet ingested
- Civics
- —
Market trends
- HPI YoY
- ▲ 12.09%
- Current HPI
- 512.87
- Rent YoY
- ▲ 0.32%
- Metro
- Houston-The Woodlands-Sugar Land, TX
- State GDP YoY
- ▲ 3.95%
- F500 in state
- 110
Industry mix (Fortune 500 HQ in TX)
| Industry | F500 HQs | Revenue |
|---|---|---|
| Energy | 16 | $1,198B |
|
||
| Technology | 5 | $198B |
|
||
| Engineering / Construction | 4 | $72B |
|
||
| Energy Services | 3 | $60B |
|
||
| Utilities | 3 | $41B |
|
||
| Healthcare | 2 | $330B |
|
||
Price history
-7.1% since first listed17 events — show timeline
- 2026-06-11 Coming Soon $312,000 HARMLS
- 2026-03-01 Rental Removed $2,550 HARMLS
- 2026-01-08 Listed for Rent $2,550 HARMLS
- 2025-09-22 Sold (Public Records) — Public Records
- 2025-07-15 Sold (MLS) — HARMLS
- 2025-07-07 Pending — HARMLS
- 2025-05-01 Price Changed $328,806 HARMLS
- 2025-03-27 Listing Removed — HARMLS
- 2025-03-27 Listed $338,806 HARMLS
- 2025-03-24 Listed $335,990 HARMLS
- 2025-02-10 Listing Removed — HARMLS
- 2024-11-05 Listing Removed — HARMLS
- 2024-11-05 Listed $325,990 HARMLS
- 2024-11-01 Listing Removed — HARMLS
- 2024-11-01 Listed $327,990 HARMLS
- 2024-09-25 Price Changed $325,990 HARMLS
- 2024-05-23 Listed $335,990 HARMLS
Property tax history
+679.9%/yrLatest (2025): $5,963 · +679.9% YoY. Source: county tax records.
Cash-flow waterfall
monthlySold comps — $/sqft
last 12 mo · ≤1 miLoading sold comps…