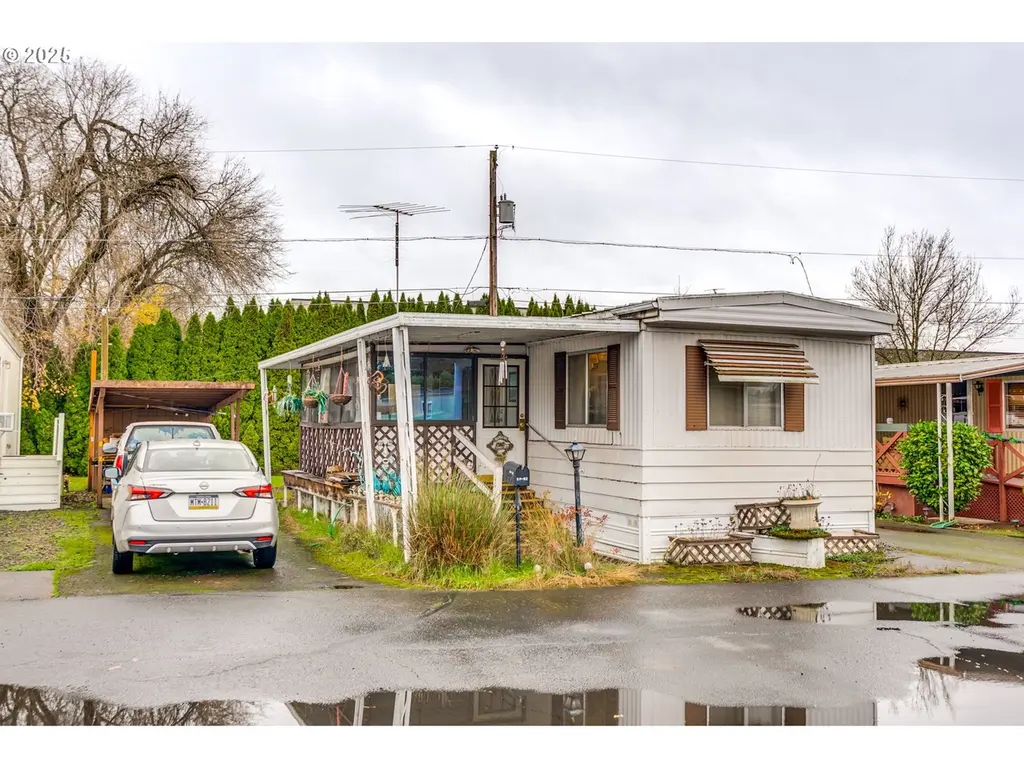
2420 NE Hembree St #52 · McMinnville, OR
Flood risk 1/10 · Minimal
- FEMA flood zone
- X (unshaded)
- Chance of flooding over 30 yrs
- 0.0%
- Est. flood insurance / yr
- $507 – $1,088
Fire risk 4/10 · Minor
- Est. fire insurance / yr
- $498 – $926
Heat risk 3/10 · Minor
- Hot days now (above 93°F)
- 7 days/yr
- Hot days in 30 yrs
- 14 days/yr
Wind risk 1/10 · Minimal
- Chance of severe wind over 30 yrs
- —
Air-quality risk 8/10 · Major
- Unhealthy air days now
- 10 days/yr
- Unhealthy air days in 30 yrs
- 11 days/yr
Risk factors via First Street. Map © Google.
Why this score? — see what drove the C+ grade
The composite is a weighted blend of 9 inputs, each scored 0–100. Each bar is that input's sub-score; the figure is the points it added to the 100-point composite (weight × sub-score).
- Cash flow +30.0/30.0
- 1% rule +10.0/10.0
- DSCR +10.0/10.0
- Schools +4.8/10.0
- Livability +3.8/5.0
- Rent growth +2.7/5.0
- Condition / age +2.5/5.0
- ARV discount +0.0/15.0
- Appreciation +0.0/10.0
$75,000
🖨 Deal sheet 📄 Offer letter ✓ Due diligence
Listing remarks MLS
Quiet 55+ park on dead end. Close to shopping.
Key facts
- Close to shopping
- Built 1972
- Listed 189 days
Tags
Neighborhood map
What this means for you Summary
Snapshot
- This is a 2-bed/1.5-bath manufactured listed at $75k.
Deal economics
- At list price, monthly cash flow is $881 ($11k/yr) — positive.
- The deal already cash-flows at list — no discount required.
- Meets the 1% rule at list price ($2k rent vs $75k).
- Recommended offer: $66k (12.0% below list) — sets the bar for market timing.
- Cap rate 20.4% vs local median 3.2% in McMinnville — top-decile yield for the area; either an underpriced asset or a hidden risk that comps aren't pricing in. Stress-test before assuming the spread holds.
Location & tenants
- Location reads 76/100 on livability (#79 in OR, #3,556 nationally) — a middle-class / working-renter tenant base. Strengths: health & safety A+, housing A, crime B; Watch: commute D+.
- Mcminnville SD 40 (town): math 50% / reading 58% proficiency, ranked #20 of 183 in OR (top 11%) — acceptable for families but not a draw, mixed tenant base, ~2y average lease.
- Market conditions: Rents flat; 390 active listings in the ZIP; 1 comparable units currently listed for rent nearby; solid renter incomes; 282 units permitted in Yamhill County in 2024 (0 in 5+ unit buildings).
Forward outlook
- Local home prices are declining (-3.0%/yr); year-one equity from $519 of loan paydown is wiped out by about $2k of value loss. Plan a longer hold.
- Yamhill County population projected at +8% by 2050 — modest demand growth; plan on rents tracking national, not racing it.
- At projected returns (-3.0% appreciation + 0.8% rent growth), your $21k cash investment doubles in ~3 years — after that, you're playing with house money.
Negotiation context
- It's been on market 189 days — a 12% lower offer ($66k) is reasonable based on typical stale-listing flexibility.
- 2 sale attempts with the ask held roughly flat each time — persistent listings suggest the price (not the market) is what's stuck; bring a comps-based counter.
Questions for the listing agent
- It's been on market 189 days. Have you received any prior offers? Is the seller open to a 12% concession, seller financing, or rate buy-down credit?
- Built in 1972 — when were the roof, HVAC, electrical panel, plumbing, and water heater last replaced?
- Why hasn't it sold? Are there any deal-killer items the seller is aware of (foundation, flood, title, zoning, code violations)?
- Is there a deadline driving the sale (1031 exchange, divorce, estate, relocation)? That informs how much negotiation room exists.
- What's the average days-on-market for RENTAL listings here right now (not sales)? A rising rental-DOM trend means longer vacancies and softer asking-rent achievability than the comps imply.
- What's the recent tenant-quality profile in this submarket — average credit score on applications, eviction rate, late-payment / NSF rate, and stable-employment percentage? A property-management company in the area should have these aggregated.
- How much new for-sale + rental construction is in the pipeline within 1–3 miles? Heavy new supply typically softens prices + rents 12–24 months out; constrained supply supports both.
Investment metrics
- 1% rule
- 2.23% ✓
- Cap rate
- 20.40%
- Cash-on-cash
- 50.37%
- DSCR
- 3.24
- GRM
- 3.7
CMA / ARV
- ARV (median comp)
- $60,708
- List price
- $75,000
- Delta
- 23.54%
- Verdict
- OVERPRICED
- Comps
- 1 within 2.0 mi
Projected returns pro-forma
-3.0% appreciation · 0.79% rent growth · sell at horizon
- IRR
- 45.7%
- Equity multiple
- 2.92×
- Total profit
- $40,324
- Equity at exit
- $11,183
- IRR
- 50.6%
- Equity multiple
- 5.43×
- Total profit
- $93,015
- Equity at exit
- $6,485
Cash invested: $21,000 (down + closing). Projections, not guarantees.
Landlord ↔ Tenant lean methodology
- Overall (STATE)
- 28 Tenant-Leaning
- State Oregon
- 28 Tenant-Leaning · D+6
- County
- — inherits STATE
- City
- — inherits STATE
ZIP-level market 97128
- Rents YoY
- 0.8%
- Active inventory
- 390
- Price-to-rent
- 3.7×
Monthly cashflow live
- Estimated rent
- $1,674 medium interval (Pro) →
- Mortgage (P&I)
- −$393
- Tax from tax record
- −$17 /mo · $202/yr
- Insurance
- −$31
- HOA
- −$0
- Vacancy / Maint / Mgmt
- −$352
- Net cashflow
- $881
Break-even live
UW: 25.0% down · 7.5% · 30yr · 1.5% tax · 5.0% vac · 8.0% maint · 8.0% mgmt
Financing live
Cash to close
- Down payment
- $18,750
- Closing costs
- $2,250
- Reserves months
- —
- Total cash needed
- —
Loan-product check · same deal, 3 products live
Conventional
25% down · 7.5% · 30yr
- Down + closing
- —
- Monthly P&I
- —
- Monthly cashflow
- —
- DSCR
- —
- Eligible?
- —
Personal DTI + credit; lowest rate.
DSCR
20% down · 8.5% · 30yr
- Down + closing
- —
- Monthly P&I
- —
- Monthly cashflow
- —
- DSCR
- —
- Eligible?
- —
No personal income docs; deal must DSCR.
Hard money
10% down · 12.0% · 12mo
- Down + closing
- —
- Monthly P&I
- —
- Monthly cashflow
- —
- DSCR
- —
- Eligible?
- —
Short-term bridge; refi at stabilization.
Rent comps 1 comps
| Address | Beds | Baths | Sqft | Rent | $/sqft | DOM | Units | Dist |
|---|---|---|---|---|---|---|---|---|
| 110 SE Handley St Unit 104 McMinnville, OR | 1.0 | 1.0 | 439 | $1,375 | $3.13 | 43d | 1 | 1.44mi |
Listing history 16 events
-
2026-06-18days on market $75,000 Active 189 DOM
-
2026-06-17days on market $75,000 Active 188 DOM
-
2026-06-16days on market $75,000 Active 187 DOM
-
2026-06-15days on market $75,000 Active 186 DOM
-
2026-06-13days on market $75,000 Active 184 DOM
-
2026-06-13days on market $75,000 Active 183 DOM
-
2026-06-09days on market $75,000 Active 180 DOM
-
2026-06-08days on market $75,000 Active 179 DOM
-
2026-06-07days on market $75,000 Active 178 DOM
-
2026-06-05days on market $75,000 Active 175 DOM
-
2026-06-03days on market $75,000 Active 174 DOM
-
2026-06-02days on market $75,000 Active 173 DOM
-
2026-06-01days on market $75,000 Active 172 DOM
-
2026-05-31days on market $75,000 Active 171 DOM
-
2025-12-11$75,000 Active 46-char remark
Show marketing remark (45 chars)
Quiet 55+ park on dead end. Close to shopping
-
2025-12-11$75,000 Active 45-char remark
Show marketing remark (45 chars)
Quiet 55+ park on dead end. Close to shopping
ⓘ Source: listings_history table (triggers on properties + properties_extension) + one-shot
backfill from property_details.listing_events for pre-trigger history.
Tax reassessment forecast OR · Resets to sale price
- Current annual tax
- $202 · $17/mo
- Projected year-2 tax
- $728 · $61/mo
- Expected delta
- +$526/yr (+$44/mo · 261.0%)
ⓘ Screening estimate from a state-policy table — verify with the county assessor before closing.
Climate risk First Street
- Flood 1/10 Low FEMA zone X (unshaded) · 0% chance over 30 yrs
- Wildfire 4/10 Moderate
- Heat 3/10 Moderate 7 d/yr ≥93°F today · 14 d/yr by 30 yrs out
- Wind 1/10 Low
- Air quality 8/10 Severe 10 unhealthy d/yr today · 11 by 30 yrs out
Nearby sold comps map
Loading sold comps map…
Walkable amenities ~0.75 mi
Loading nearby amenities…
Taxation est. · year 1
- Rental income
- $20,094
- − Mortgage interest
- −$4,201
- − Property taxes
- −$202
- − Insurance
- −$375
- − Repairs & maintenance
- −$1,608
- − Management
- −$1,608
- − Depreciation
- −$2,182
- Taxable income
- $9,919
- Est. tax owed @ 24.0%
- −$2,381
- After-tax cash flow
- $8,197/yr
For passive investors: Depreciation is non-cash, so a rental often shows a tax loss while cash-flowing — sheltering income. Rental losses are passive: they offset passive income freely, and up to $25,000/yr can offset ordinary (W-2) income if you actively participate and your MAGI is under $100k (phasing out to $0 by $150k); unused losses carry forward. On sale, claimed depreciation is recaptured at up to 25%, and gains may owe capital-gains tax (a 1031 exchange can defer both). Figures are a year-1 estimate at your 24.0% rate — not tax advice; consult a CPA.
Schools (NCES district)
- District
- Mcminnville SD 40
- NCES district ID
- 4108010
- Math proficiency
- 50% ▼ -1.00%
- Reading proficiency
- 58% ▼ -1.00%
- Median HH income
- $47,382
- Composite
- 47.69/100
- National rank
- #4919
- State rank
- #20 of 183 in OR
Livability — McMinnville
- Score
- 76/100
- State rank
- #79
- US rank
- #3556
Category grades
Schools grade is shown separately in the Schools card above.
Census & demographics
- Census place
- McMinnville, OR
- County
- Yamhill County · 71,150 people
- City population
- 38,664
- Metro
- Portland-Vancouver-Hillsboro, OR-WA
- Population (ZIP)
- 38,664
- Household income
- $75,896
- Rent vs Own
- Severe rent burden
- 1508.0
Population outlook (Yamhill County) Hauer SSP2
- Today (2025)
- 109,295 people
- By 2030
- 112,060 · +2.5%
- By 2040
- 115,975 · +6.1%
- By 2050
- 118,155 · +8.1%
- By 2075
- 120,968 · +10.7%
- By 2100
- 116,163 · +6.3%
Race, ethnicity, and origin ACS 2023
- Neighborhood character
- Predominantly White (72%)
- Race & ethnicity
- White 72% Hispanic / Latino 19% Two or more races 14% Asian 2%
- Hispanic origin (detail)
- Mexican 17%
- Common ancestry
- Italian 6% Portuguese 3% Slovak 3%
- Foreign-born
- 9% · Canada, China, South Korea
- Languages at home
- 85% English-only · Spanish 13% Chinese 1% German/W. Germanic 1%
Political lean MEDSL · Yamhill
- 2024 margin
- Lean R (+6.1) · D 45.3% · R 51.4% · Other 3.3%
- 2008→2024 swing
- -4.8pp toward R · 2008: -1.4pp · 2024: -6.1pp
- All cycles
- 2024: R+6.1 2020: R+4.0 2016: R+8.8 2012: R+6.7 2008: R+1.4
Not yet ingested
- Civics
- —
Market trends
- HPI YoY
- ▼ -201.59%
- Current HPI
- 320.373
- Rent YoY
- ▲ 0.79%
- Metro
- Portland-Vancouver-Hillsboro, OR-WA
- State GDP YoY
- ▲ 2.05%
- F500 in state
- 2
Industry mix (Fortune 500 HQ in OR)
| Industry | F500 HQs | Revenue |
|---|---|---|
| Consumer Goods | 1 | $51B |
|
||
Price history
+0.0% since first listed2 events — show timeline
- 2025-12-11 Listed $75,000 WVMLS
- 2025-12-11 Listed $75,000 RMLS
Property tax history
+2.1%/yrLatest (2025): $202 · +5.5% YoY. Source: county tax records.
Cash-flow waterfall
monthlySold comps — $/sqft
last 12 mo · ≤1 miLoading sold comps…