16300 State Highway 305 NE #95 · Suquamish, WA
Flood risk 1/10 · Minimal
- FEMA flood zone
- X (unshaded)
- Chance of flooding over 30 yrs
- 0.0%
- Est. flood insurance / yr
- $507 – $1,088
Fire risk 3/10 · Minor
- Est. fire insurance / yr
- $604 – $1,122
Heat risk 3/10 · Minor
- Hot days now (above 86°F)
- 7 days/yr
- Hot days in 30 yrs
- 15 days/yr
Wind risk 1/10 · Minimal
- Chance of severe wind over 30 yrs
- —
Air-quality risk 6/10 · Moderate
- Unhealthy air days now
- 9 days/yr
- Unhealthy air days in 30 yrs
- 9 days/yr
Risk factors via First Street. Map © Google.
Why this score? — see what drove the B+ grade
The composite is a weighted blend of 9 inputs, each scored 0–100. Each bar is that input's sub-score; the figure is the points it added to the 100-point composite (weight × sub-score).
- Cash flow +30.0/30.0
- ARV discount +14.1/15.0
- 1% rule +10.0/10.0
- DSCR +10.0/10.0
- Schools +5.4/10.0
- Livability +3.5/5.0
- Rent growth +2.7/5.0
- Condition / age +2.5/5.0
- Appreciation +0.0/10.0
$99,000
🖨 Deal sheet (PDF) 📄 Offer letter ✓ Due diligence
Listing remarks
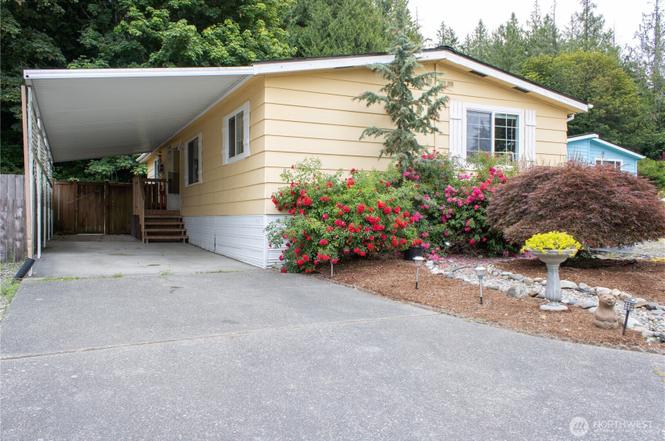
Welcome to the beautifully maintained 55+ community Of Cedar Glen. Conveniently located between idyllic downtown Poulsbo and Bainbridge Island, you have easy access to all the North end has to offer and just a ferry ride away from Seattle. Situated at the very back of the park this home is quiet and has minimal traffic. Home features a nicely sized, light filled main living area attached to an ample kitchen complete with laundry room/pantry area. Primary bedroom has attached bath with accessible shower as well as an attached office. The interior has all been freshly painted with new vinyl planking throughout! The roof is worry free as it was completely replaced barely four years ago!
Key facts
- Ample kitchen
- Attached office
- Quiet location
Tags
Property features AI
Finance
- Other: Calculated building area: 1,248; Structure type: Manufactured house; Energy efficient feature: Double pane windows
- Financial info: Land lease: $1,029 (monthly); Listing terms include cash and conventional
- HOA & community: Located in Cedar Glen manufactured home park; Park approved for sale; Clubhouse and common area in park; RV parking available; 97 homes in park; Dogs allowed; Senior community
Exterior
- Parking: Carport; Uncovered parking
- Utilities: Electric energy; Community water; Community septic
- Home design: Manufactured double-wide home; One level; Good condition; Built by Guerdon, model Embassy; Mobile home remains
- Construction: Wood construction; Composition roof
- Exterior features: Wood exterior; Paved lot
Interior
- Kitchen: Dishwasher; Microwave; Refrigerator; Stove/Range
- Bedrooms: 2 bedrooms
- Flooring: Ceramic tile; Laminate; Vinyl plank
- Bathrooms: 1 full bath; 1 three-quarter bath; 1 bathtub; 2 showers
- Heating & cooling: Forced air heating
- Interior features: Fireplace; Den/Office; Dining room; Entry; Kitchen with eating space; Living room; Utility room; Skylights; Vaulted ceilings; Ceiling fan(s); Double pane windows; Patio/porch/deck
- Laundry & utility: Washer; Dryer
Neighborhood map
What this means for you Summary
Snapshot
- This is a 2-bed/2.0-bath manufactured listed at $99k.
Deal economics
- At list price, monthly cash flow is $1k ($15k/yr) — positive.
- The deal already cash-flows at list — no discount required.
- Meets the 1% rule at list price ($2k rent vs $99k).
Location & tenants
- Location reads 69/100 on livability (#262 in WA) — a middle-class / working-renter tenant base. Strengths: housing A+, employment A-, crime B+; Watch: cost of living C-, amenities F, commute F.
- North Kitsap School District (suburban): math 53% / reading 65% proficiency, ranked #54 of 291 in WA (top 19%) — acceptable for families but not a draw, mixed tenant base, ~2y average lease.
- Zoned schools: Suquamish Elementary School (328 students, 52% FRL); Kingston Middle School (491 students, 49% FRL); Kingston High School (610 students, 42% FRL) — zoned schools average 48% FRL vs 26% district-wide (22 pts higher); higher-poverty schools than district average — tighter screening recommended.
- Market conditions: Rents flat; 270 active listings in the ZIP; 1 comparable units currently listed for rent nearby; high-income renter base; 1,294 units permitted in Kitsap County in 2024 (302 in 5+ unit buildings).
Forward outlook
- Local home prices are declining (-3.0%/yr); year-one equity from $684 of loan paydown is wiped out by about $3k of value loss. Plan a longer hold.
- Kitsap County population projected at +8% by 2050 — modest demand growth; plan on rents tracking national, not racing it.
- At projected returns (-3.0% appreciation + 0.7% rent growth), your $28k cash investment doubles in ~3 years — after that, you're playing with house money.
Negotiation context
- Only 3 days on market — expect competitive offers; lowballing is unlikely to land.
- 3 sale attempts since 19y ago with the ask held roughly flat each time — persistent listings suggest the price (not the market) is what's stuck; bring a comps-based counter.
- Current owner paid $29k; list at $99k implies a 241% gain — meaningful room to come down on a strong offer.
Questions for the listing agent
- Is there a deadline driving the sale (1031 exchange, divorce, estate, relocation)? That informs how much negotiation room exists.
- Schools are B-rated — typically a magnet for longer-tenancy family renters. What's the average tenant stay here, and is there a school-zone premium baked into asking?
- What's the average days-on-market for RENTAL listings here right now (not sales)? A rising rental-DOM trend means longer vacancies and softer asking-rent achievability than the comps imply.
- What's the recent tenant-quality profile in this submarket — average credit score on applications, eviction rate, late-payment / NSF rate, and stable-employment percentage? A property-management company in the area should have these aggregated.
- How much new for-sale + rental construction is in the pipeline within 1–3 miles? Heavy new supply typically softens prices + rents 12–24 months out; constrained supply supports both.
Investment metrics
- 1% rule
- 2.49% ✓
- Cap rate
- 21.56%
- Cash-on-cash
- 54.53%
- DSCR
- 3.43
- GRM
- 3.4
CMA / ARV
- ARV (on-the-fly)
- $116,064
- Comps found
- 11
Show comp detail 11 sales within ~0.75 mi
| Address | Dist | Beds/Ba | Sqft | Sold | Price | $/sf | Match |
|---|---|---|---|---|---|---|---|
| 16300 NE State Hwy 305 #18 | 0.00mi | 2/2.0 | 1,260 (+1%) | 10mo | $185,000 | $147 | 90 |
| 16300 NE State Highway 305 #71 | 0.01mi | 2/2.0 | 1,276 (+2%) | 12mo | $142,500 | $112 | 86 |
| 16300 State Route 305 NE #78 | 0.08mi | 2/2.0 | 1,240 (-1%) | 12mo | $79,900 | $64 | 85 |
| 16300 State Hwy 305 NE #75 | 0.00mi | 2/2.0 | 1,344 (+8%) | 5mo | $40,000 | $30 | 83 |
| 16300 NE State Highway 305 #10 | 0.00mi | 2/2.0 | 1,368 (+10%) | 2mo | $170,000 | $124 | 82 |
| 16300 State Hwy 305 NE #80 | 0.01mi | 2/2.0 | 1,344 (+8%) | 11mo | $125,000 | $93 | 78 |
| 16300 State Highway 305 #82 | 0.01mi | 2/2.0 | 1,288 (+3%) | 20mo | $95,000 | $74 | 77 |
| 16300 NE State Highway 305 #92 | 0.00mi | 2/2.0 | 1,086 (-13%) | 2mo | $127,000 | $117 | 76 |
| 16300 State Highway 305 NE #22 | 0.07mi | 3/2.0 (+1) | 1,344 (+8%) | 3mo | $75,000 | $56 | 76 |
| 16300 State Highway 305 NE #11 | 0.00mi | 2/1.0 | 1,234 (-1%) | 23mo | $42,000 | $34 | 75 |
| 16300 NE State Highway 305 #52 | 0.00mi | 2/2.0 | 1,400 (+12%) | 21mo | $189,000 | $135 | 62 |
Match score weights: distance 35% · size 25% · config 20% · recency 20%. Top-matched comps best support the ARV.
Projected returns pro-forma
-3.0% appreciation · 0.71% rent growth · sell at horizon
- IRR
- 50.1%
- Equity multiple
- 3.12×
- Total profit
- $58,681
- Equity at exit
- $14,761
- IRR
- 54.6%
- Equity multiple
- 5.79×
- Total profit
- $132,832
- Equity at exit
- $8,560
Cash invested: $27,720 (down + closing). Projections, not guarantees.
Landlord ↔ Tenant lean methodology
- Overall (STATE)
- 28 Tenant-Leaning
- State Washington
- 28 Tenant-Leaning · D+8
- County
- — inherits STATE
- City
- — inherits STATE
ZIP-level market 98370
- Rents YoY
- 0.7%
- Active inventory
- 270
- Price-to-rent
- 3.4×
Monthly cashflow live
- Estimated rent
- $2,461 medium interval (Pro) →
- Mortgage (P&I)
- −$519
- Tax est. 1.5%
- −$124 /mo · $1,485/yr
- Insurance
- −$41
- HOA
- −$0
- Vacancy / Maint / Mgmt
- −$517
- Net cashflow
- $1,260
Break-even live
Sensitivity live
| Price | -10% $1,328 | -5% $1,294 | +0% $1,260 | +5% $1,225 | +10% $1,191 |
|---|---|---|---|---|---|
| Rent | -10% $1,065 | -5% $1,162 | +0% $1,260 | +5% $1,357 | +10% $1,454 |
| Rate | -1.0pp $1,310 | -0.5pp $1,285 | base $1,260 | +0.5pp $1,234 | +1.0pp $1,208 |
UW: 25.0% down · 7.5% · 30yr · 1.5% tax · 5.0% vac · 8.0% maint · 8.0% mgmt
Financing live
Cash to close
- Down payment
- $24,750
- Closing costs
- $2,970
- Reserves months
- —
- Total cash needed
- —
Loan-product check · same deal, 3 products live
Conventional
25% down · 7.5% · 30yr
- Down + closing
- —
- Monthly P&I
- —
- Monthly cashflow
- —
- DSCR
- —
- Eligible?
- —
Personal DTI + credit; lowest rate.
DSCR
20% down · 8.5% · 30yr
- Down + closing
- —
- Monthly P&I
- —
- Monthly cashflow
- —
- DSCR
- —
- Eligible?
- —
No personal income docs; deal must DSCR.
Hard money
10% down · 12.0% · 12mo
- Down + closing
- —
- Monthly P&I
- —
- Monthly cashflow
- —
- DSCR
- —
- Eligible?
- —
Short-term bridge; refi at stabilization.
Rent comps 1 comps
| Address | Beds | Baths | Sqft | Rent | $/sqft | DOM | Units | Dist |
|---|---|---|---|---|---|---|---|---|
| 4005 NE Kedros Dr Poulsbo, WA | 3.0 | 2.0 | 1200 | $2,850 | $2.38 | 15d | 1 | 1.40mi |
Listing history 3 events
-
2026-06-22days on market $99,000 Active 3 DOM
-
2026-06-19remarks 692-char remark
-
2026-06-19$99,000 Active 1 DOM
ⓘ Source: listings_history table (triggers on properties + properties_extension) + one-shot
backfill from property_details.listing_events for pre-trigger history.
Climate risk First Street
- Flood 1/10 Low FEMA zone X (unshaded) · 0% chance over 30 yrs
- Wildfire 3/10 Moderate
- Heat 3/10 Moderate 7 d/yr ≥86°F today · 15 d/yr by 30 yrs out
- Wind 1/10 Low
- Air quality 6/10 Major 9 unhealthy d/yr today · 9 by 30 yrs out
Nearby sold comps map
Loading sold comps map…
Walkable amenities ~0.75 mi
Loading nearby amenities…
Taxation est. · year 1
- Rental income
- $29,527
- − Mortgage interest
- −$5,546
- − Property taxes
- −$1,485
- − Insurance
- −$495
- − Repairs & maintenance
- −$2,362
- − Management
- −$2,362
- − Depreciation
- −$2,880
- Taxable income
- $14,397
- Est. tax owed @ 24.0%
- −$3,455
- After-tax cash flow
- $11,661/yr
For passive investors: Depreciation is non-cash, so a rental often shows a tax loss while cash-flowing — sheltering income. Rental losses are passive: they offset passive income freely, and up to $25,000/yr can offset ordinary (W-2) income if you actively participate and your MAGI is under $100k (phasing out to $0 by $150k); unused losses carry forward. On sale, claimed depreciation is recaptured at up to 25%, and gains may owe capital-gains tax (a 1031 exchange can defer both). Figures are a year-1 estimate at your 24.0% rate — not tax advice; consult a CPA.
Schools (NCES district)
- District
- North Kitsap School District
- NCES district ID
- 5305760
- Math proficiency
- 53% ▼ -1.00%
- Reading proficiency
- 65% ▲ 1.00%
- Median HH income
- $68,919
- Composite
- 53.68/100
- National rank
- #3092
- State rank
- #54 of 291 in WA
Livability — Suquamish
- Score
- 69/100
- State rank
- #262
- US rank
- #9023
Category grades
Schools grade is shown separately in the Schools card above.
Census & demographics
- Census place
- Suquamish, WA
- County
- Kitsap County · 243,099 people
- City population
- 3,412
- Metro
- Bremerton-Silverdale-Port Orchard, WA
- Population (ZIP)
- 33,655
- Household income
- $116,756
- Rent vs Own
- Severe rent burden
- 904.0
Population outlook (Kitsap County) Hauer SSP2
- Today (2025)
- 277,525 people
- By 2030
- 285,040 · +2.7%
- By 2040
- 294,957 · +6.3%
- By 2050
- 300,622 · +8.3%
- By 2075
- 315,580 · +13.7%
- By 2100
- 304,340 · +9.7%
Race, ethnicity, and origin ACS 2023
- Neighborhood character
- Predominantly White (79%)
- Race & ethnicity
- White 79% Two or more races 11% Hispanic / Latino 9% Asian 3% Black 1%
- Hispanic origin (detail)
- Mexican 5%
- Common ancestry
- Portuguese 7% Italian 4% Slovak 3%
- Foreign-born
- 6% · Canada, South Korea
- Languages at home
- 93% English-only · Spanish 4% Other Indo-European 1% Other Asian/Pacific 1%
Political lean MEDSL · Kitsap
- 2024 margin
- Strong D (+20.9) · D 58.8% · R 37.9% · Other 3.3%
- 2008→2024 swing
- +8.6pp toward D · 2008: 12.3pp · 2024: 20.9pp
- All cycles
- 2024: D+20.9 2020: D+18.1 2016: D+11.6 2012: D+11.1 2008: D+12.3
Not yet ingested
- Civics
- —
Market trends
- HPI YoY
- ▼ -342.47%
- Current HPI
- 347.3427
- Rent YoY
- ▲ 0.71%
- Metro
- Bremerton-Silverdale-Port Orchard, WA
- State GDP YoY
- ▲ 4.65%
- F500 in state
- 22
Industry mix (Fortune 500 HQ in WA)
| Industry | F500 HQs | Revenue |
|---|---|---|
| Retail | 2 | $269B |
|
||
| Technology / Retail | 1 | $638B |
|
||
| Technology | 1 | $245B |
|
||
| Telecommunications | 1 | $38B |
|
||
| Food / Beverage | 1 | $36B |
|
||
| Automotive / Trucks | 1 | $34B |
|
||
Price history
+183.7% since first listed7 events — show timeline
- 2026-06-18 Listed $99,000 NWMLS as Distributed by MLS Grid
- 2011-02-10 Sold (MLS) $29,000 NWMLS as Distributed by MLS Grid
- 2011-01-31 Pending — NWMLS as Distributed by MLS Grid
- 2011-01-20 Pending — NWMLS as Distributed by MLS Grid
- 2010-10-26 Listed $34,900 NWMLS as Distributed by MLS Grid
- 2007-08-01 Delisted — NWMLS as Distributed by MLS Grid
- 2007-05-28 Listed — NWMLS as Distributed by MLS Grid
Cash-flow waterfall
monthlySold comps — $/sqft
last 12 mo · ≤1 miLoading sold comps…