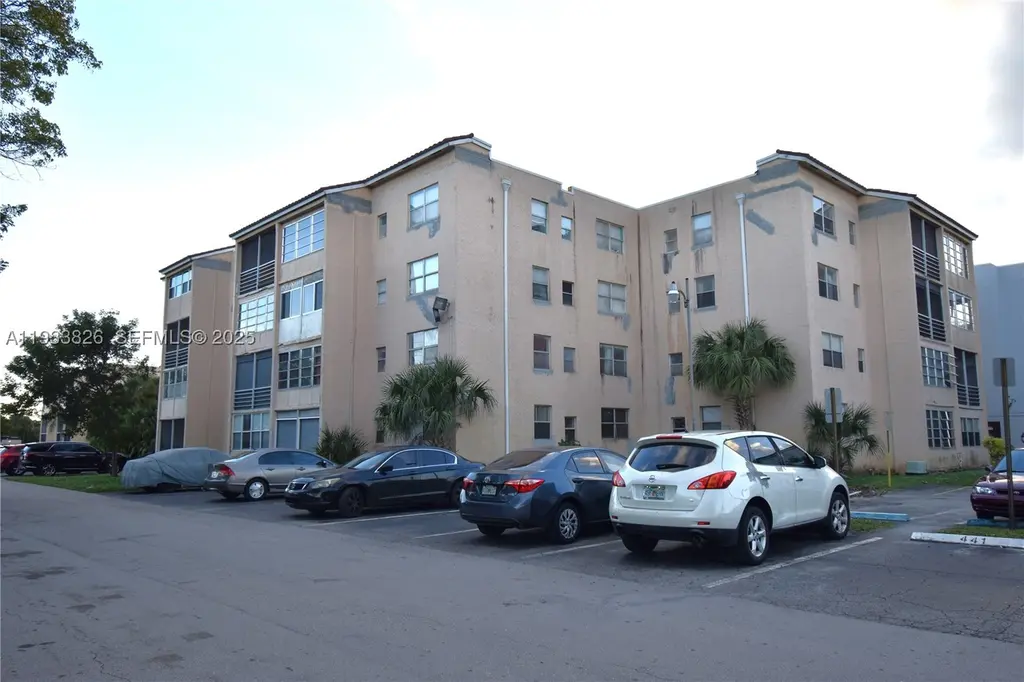
2840 Somerset Dr Unit 110M · Lauderdale Lakes, FL
Flood risk 1/10 · Minimal
- FEMA flood zone
- AH
- Chance of flooding over 30 yrs
- 0.0%
- Est. flood insurance / yr
- $1,142 – $2,507
Fire risk 1/10 · Minimal
- Est. fire insurance / yr
- $947 – $1,759
Heat risk 10/10 · Severe
- Hot days now (above 105°F)
- 7 days/yr
- Hot days in 30 yrs
- 26 days/yr
Wind risk 10/10 · Severe
- Chance of severe wind over 30 yrs
- 99.0%
Air-quality risk 3/10 · Minor
- Unhealthy air days now
- 3 days/yr
- Unhealthy air days in 30 yrs
- 3 days/yr
Risk factors via First Street. Map © Google.
Why this score? — see what drove the D+ grade
The composite is a weighted blend of 9 inputs, each scored 0–100. Each bar is that input's sub-score; the figure is the points it added to the 100-point composite (weight × sub-score).
- Cash flow +15.0/30.0
- ARV discount +7.5/15.0
- 1% rule +5.0/10.0
- DSCR +5.0/10.0
- Schools +4.1/10.0
- Livability +4.0/5.0
- Rent growth +3.2/5.0
- Condition / age +2.5/5.0
- Appreciation +0.0/10.0
$19,900
🖨 Deal sheet 📄 Offer letter ✓ Due diligence
Listing remarks
2 bedroom 2 bath condo offers a spacious layout with good size rooms and large dining and living area and good size patio. The manned gated development offers a variety of amenities including a clubhouse, swimming pool, fitness center, tennis courts, shuffleboard, and walking trails. Development is within 5 miles of dining, and entertainment.
Key facts
- Fitness center
- Clubhouse
- Swimming pool
Tags
Neighborhood map
What this means for you Summary
Snapshot
- This is a 2-bed/2.0-bath condo listed at $20k.
Deal economics
- At list price, monthly cash flow is $458 ($5k/yr) — positive.
- The deal already cash-flows at list — no discount required.
- Meets the 1% rule at list price ($2k rent vs $20k).
- Recommended offer: $18k (9.0% below list) — sets the bar for market timing.
- Cap rate 43.1% vs local median 5.6% in Lauderdale Lakes — top-decile yield for the area; either an underpriced asset or a hidden risk that comps aren't pricing in. Stress-test before assuming the spread holds.
Location & tenants
- Location reads 81/100 on livability (#100 in FL, #1,527 nationally) — a professional / high-income tenant draw. Strengths: commute A+, cost of living A+, housing A+; Watch: schools C-, crime D+, amenities F.
- Broward (suburban): math 42% / reading 53% proficiency, ranked #46 of 73 in FL (top 63%) — families likely to look elsewhere, expect single-tenant / working-renter base with shorter leases.
- Market conditions: Rents rising (+2.8%/yr); 585 active listings in the ZIP; 40 comparable units currently listed for rent nearby; rentals at typical pace (median 20d on market — plan ~3-4 weeks tenant-placement turnaround); 2,111 units permitted in Broward County in 2024 (1,265 in 5+ unit buildings).
- At $2,040/mo this rent would consume 45% of the median local household income ($54k/yr) (locally 5068% of renters already pay >50% of income on rent) — very limited rent-growth headroom before tenants either downsize or default.
Forward outlook
- Local home prices are declining (-3.0%/yr); year-one equity from $138 of loan paydown is wiped out by about $597 of value loss. Plan a longer hold.
- Broward County population projected at +34% by 2050 — long-run rental-demand tailwind backs the buy-and-hold thesis.
- At projected returns (-3.0% appreciation + 2.8% rent growth), your $6k cash investment doubles in ~2 years — after that, you're playing with house money.
Negotiation context
- It's been on market 91 days — a 9% lower offer ($18k) is reasonable based on typical stale-listing flexibility.
- 3 sale attempts; this cycle's ask has dropped $20k (50%) from the opening price — seller is motivated, your offer sets the floor, not the list.
Risks & watch-outs
- Watch-outs: flood insurance adds $152/mo; HOA is 42% of rent.
- Climate carrying-cost: in FEMA flood zone AH (mandatory federal flood insurance); severe wind risk, 99% chance of damaging wind over 30y; extreme-heat days projected 7→26/yr by 2055 (HVAC capex compounding) — expect insurance premiums to compound above CPI over the hold.
Questions for the listing agent
- It's been on market 91 days. Have you received any prior offers? Is the seller open to a 9% concession, seller financing, or rate buy-down credit?
- What's the actual annual flood-insurance premium (NFIP or private), and is the property in a SFHA with mandatory coverage?
- What does the HOA fee cover, when was the last increase, and are there any pending special assessments or reserve-fund shortfalls?
- Any open or pending special assessments — roof, HVAC, plumbing, elevator, façade? What's the per-unit balance and payoff schedule, and is the seller paying it off at close or rolling it to the buyer?
- Why hasn't it sold? Are there any deal-killer items the seller is aware of (foundation, flood, title, zoning, code violations)?
- Is there a deadline driving the sale (1031 exchange, divorce, estate, relocation)? That informs how much negotiation room exists.
- Crime grade is D in this area — have there been break-ins, vandalism, or insurance claims at this property in the last 3 years? What carrier currently insures it and at what premium?
- The area grade is low — what's the realistic commute time and amenity access for the typical tenant pool here? Any planned neighborhood developments (good or bad) we should know about?
- What's the average days-on-market for RENTAL listings here right now (not sales)? A rising rental-DOM trend means longer vacancies and softer asking-rent achievability than the comps imply.
- What's the recent tenant-quality profile in this submarket — average credit score on applications, eviction rate, late-payment / NSF rate, and stable-employment percentage? A property-management company in the area should have these aggregated.
- How much new apartment / multifamily construction is in the pipeline within 1–3 miles? Heavy new supply (>2% of stock underway) typically softens rents 12–24 months out; light construction supports rent growth.
Investment metrics
- 1% rule
- 10.25% ✓
- Cap rate
- 43.09%
- Cash-on-cash
- 131.41%
- DSCR
- 6.85
- GRM
- 0.8
CMA / ARV
No comps found within radius.
Projected returns pro-forma
-3.0% appreciation · 2.78% rent growth · sell at horizon
- IRR
- 100.0%
- Equity multiple
- 5.69×
- Total profit
- $26,160
- Equity at exit
- $2,967
- IRR
- —
- Equity multiple
- 11.98×
- Total profit
- $61,174
- Equity at exit
- $1,721
Cash invested: $5,572 (down + closing). Projections, not guarantees.
Landlord ↔ Tenant lean methodology
- Overall (STATE)
- 87 Strongly Landlord-Friendly
- State Florida
- 87 Strongly Landlord-Friendly · R+3
- County
- — inherits STATE
- City
- — inherits STATE
ZIP-level market 33311
- Rents YoY
- 2.8%
- Active inventory
- 585
- Price-to-rent
- 0.8×
Monthly cashflow live
- Estimated rent
- $2,040 high interval (Pro) →
- Mortgage (P&I)
- −$104
- Tax est. 1.5%
- −$25 /mo · $298/yr
- Insurance
- −$8
- Flood insurance flood zone
- −$152 /mo · $1,824/yr
- HOA
- −$864
- Vacancy / Maint / Mgmt
- −$428
- Net cashflow
- $458
Break-even live
UW: 25.0% down · 7.5% · 30yr · 1.5% tax · 5.0% vac · 8.0% maint · 8.0% mgmt
Financing live
Cash to close
- Down payment
- $4,975
- Closing costs
- $597
- Reserves months
- —
- Total cash needed
- —
Loan-product check · same deal, 3 products live
Conventional
25% down · 7.5% · 30yr
- Down + closing
- —
- Monthly P&I
- —
- Monthly cashflow
- —
- DSCR
- —
- Eligible?
- —
Personal DTI + credit; lowest rate.
DSCR
20% down · 8.5% · 30yr
- Down + closing
- —
- Monthly P&I
- —
- Monthly cashflow
- —
- DSCR
- —
- Eligible?
- —
No personal income docs; deal must DSCR.
Hard money
10% down · 12.0% · 12mo
- Down + closing
- —
- Monthly P&I
- —
- Monthly cashflow
- —
- DSCR
- —
- Eligible?
- —
Short-term bridge; refi at stabilization.
Rent comps 40 comps
| Address | Beds | Baths | Sqft | Rent | $/sqft | DOM | Units | Dist |
|---|---|---|---|---|---|---|---|---|
| 2830 Somerset Dr Lauderdale Lakes, FL | 2.0 | 2.0 | 1010 | $1,925 | $1.91 | 11d | 2 | 0.05mi |
| 2800 Somerset Dr Unit 418J Lauderdale Lakes, FL | 2.0 | 2.0 | 1010 | $1,800 | $1.78 | 15d | 1 | 0.06mi |
| 2821 Somerset Dr #217 Lauderdale Lakes, FL | 1.0 | 1.0 | 748 | $1,400 | $1.87 | 2d | 1 | 0.13mi |
| 2811 Somerset Dr #412 Lauderdale Lakes, FL | 2.0 | 2.0 | 865 | $1,700 | $1.97 | 7d | 1 | 0.17mi |
| 2801 Somerset Dr Lauderdale Lakes, FL | 2.0 | 2.0 | 865 | $1,775 | $2.05 | 24d | 2 | 0.20mi |
| 2841 Somerset Dr Lauderdale Lakes, FL | 1.0 | 1.0 | 696 | $1,598 | $2.30 | 11d | 3 | 0.22mi |
| 2851 Somerset Dr Lauderdale Lakes, FL | 1.0–2.0 | 1.0–2.0 | 827 | $1,700 | $2.06 | 3d | 2 | 0.23mi |
| 2725 Somerset Dr Lauderdale Lakes, FL | 1.0–2.0 | 1.0–2.0 | 990 | $2,250 | $2.27 | 24d | 1 | 0.27mi |
| 3390 NW 30th St Unit 3 Lauderdale Lakes, FL | 2.0 | 1.0 | 800 | $1,650 | $2.06 | 24d | 1 | 0.37mi |
| 3115 Oakland Shores Dr Unit E208 Oakland Park, FL | 1.0 | 1.0 | 760 | $1,600 | $2.11 | 5d | 1 | 0.43mi |
| 3115 Oakland Shores Dr Unit E208 Oakland Park, FL | 1.0 | 1.0 | 760 | $1,700 | $2.24 | 24d | 1 | 0.43mi |
| 3529 NW 29th Pl Lauderdale Lakes, FL | 3.0 | 2.5 | 1474 | $3,200 | $2.17 | 24d | 1 | 0.47mi |
| 3123 Oakland Shores Dr Unit D112 Oakland Park, FL | 1.0 | 1.0 | 760 | $1,450 | $1.91 | 10d | 1 | 0.48mi |
| 3123 Oakland Shores Dr Unit D112 Oakland Park, FL | 1.0 | 1.0 | 760 | $1,450 | $1.91 | 20d | 1 | 0.48mi |
| 3119 Oakland Shores Dr Unit C110 Oakland Park, FL | 2.0 | 2.0 | 1050 | $1,800 | $1.71 | 7d | 1 | 0.49mi |
| 3119 Oakland Shores Dr Unit C212 Oakland Park, FL | 1.0 | 1.0 | 760 | $1,380 | $1.82 | 24d | 1 | 0.49mi |
| 3082 S Oakland Forest Dr #1301 Oakland Park, FL | 2.0 | 2.5 | 1098 | $1,975 | $1.80 | 20d | 1 | 0.53mi |
| 3541 NW 30th Pl Lauderdale Lakes, FL | 1.0–3.0 | 1.0–2.0 | 865 | $2,076 | $2.40 | 1d | 14 | 0.56mi |
| 2721 NW 25th St Fort Lauderdale, FL | 3.0 | 2.0 | 1015 | $3,000 | $2.96 | 2d | 1 | 0.58mi |
| 3064 S Oakland Forest Dr #1001 Oakland Park, FL | 3.0 | 2.0 | 1156 | $2,850 | $2.47 | 24d | 1 | 0.62mi |
| 3621 NW 30th Ct Oakland Park, FL | 2.0 | 2.5 | 1104 | $2,695 | $2.44 | 14d | 1 | 0.63mi |
| 3076 S Oakland Forest Dr #503 Oakland Park, FL | 3.0 | 2.0 | 1244 | $2,900 | $2.33 | 24d | 1 | 0.63mi |
| 2040 NW 29th Ter Unit 2040 Fort Lauderdale, FL | 2.0 | 1.0 | 916 | $2,400 | $2.62 | 7d | 1 | 0.65mi |
| 2040 NW 29th Ter Unit 2040 Fort Lauderdale, FL | 2.0 | 1.0 | 916 | $2,600 | $2.84 | 15d | 1 | 0.65mi |
| 2829 S Oakland Forest Dr Oakland Park, FL | 2.0–3.0 | 2.0 | 1295 | $2,275 | $1.76 | 2d | 10 | 0.66mi |
| 2720 S Oakland Forest Dr Oakland Park, FL | 2.0 | 2.0 | 1100 | $2,050 | $1.86 | 24d | 1 | 0.66mi |
| 3430 NW 34th St Lauderdale Lakes, FL | 2.0 | 2.0 | 1259 | $2,306 | $1.83 | 14d | 1 | 0.67mi |
| 3048 NW 20th St Unit n/a Fort Lauderdale, FL | 3.0 | 2.0 | 1107 | $2,800 | $2.53 | 24d | 1 | 0.67mi |
| 2631 NW 25th St Fort Lauderdale, FL | 3.0 | 2.0 | 1446 | $2,700 | $1.87 | 24d | 1 | 0.67mi |
| 2662 NW 33rd St #2505 Oakland Park, FL | 2.0 | 2.0 | 1256 | $2,495 | $1.99 | 2d | 1 | 0.72mi |
| 3684 NW 29th Ct Lauderdale Lakes, FL | 3.0 | 2.5 | 1478 | $2,700 | $1.83 | 24d | 1 | 0.72mi |
| 2890 NW 20th St Fort Lauderdale, FL | 3.0 | 1.0 | 1326 | $2,560 | $1.93 | 24d | 1 | 0.73mi |
| 2642 NW 33rd St #1910 Oakland Park, FL | 2.0 | 2.0 | 1250 | $2,250 | $1.80 | 24d | 1 | 0.76mi |
| 2733 S Oakland Forest Dr Oakland Park, FL | 2.0 | 2.0 | 1050 | $2,200 | $2.10 | 24d | 1 | 0.76mi |
| 3540 NW 34th Ter Lauderdale Lakes, FL | 2.0 | 1.0 | 1056 | $1,200 | $1.14 | 17d | 1 | 0.77mi |
| 2740 NW 21st St Unit 1261589P Fort Lauderdale, FL | 3.0 | 2.0 | 1097 | $3,396 | $3.10 | 24d | 1 | 0.77mi |
| 2890 N Oakland Forest Dr #204 Oakland Park, FL | 2.0 | 2.0 | 992 | $2,000 | $2.02 | 19d | 1 | 0.78mi |
| 2890 N Oakland Forest Dr #111 Oakland Park, FL | 2.0 | 2.0 | 1038 | $2,000 | $1.93 | 7d | 1 | 0.78mi |
| 2627 NW 33rd St #2213 Oakland Park, FL | 2.0 | 2.0 | 1256 | $2,300 | $1.83 | 24d | 1 | 0.78mi |
| 2850 N Oakland Forest Dr Oakland Park, FL | 1.0 | 1.0 | 786 | $1,675 | $2.13 | 19d | 2 | 0.78mi |
HOA detail condo
- Monthly dues
- $864 · $10,368/yr
- Likely covers
- poolgymsecurity
- Assessments
- None detected in remarks — confirm with the listing agent.
Listing history 10 events
-
2026-04-06status Pending
-
2026-03-31price $19,900
-
2026-03-16status Active
-
2026-03-06status Pending
-
2026-02-27price $24,500
-
2026-02-09status Active
-
2026-02-03status Pending
-
2026-01-20price $32,500
-
2025-12-19$39,900 Active
-
1999-07-07soldstatus $33,000
ⓘ Source: listings_history table (triggers on properties + properties_extension) + one-shot
backfill from property_details.listing_events for pre-trigger history.
Climate risk First Street
- Flood 1/10 Low FEMA zone AH · 0% chance over 30 yrs
- Wildfire 1/10 Low
- Heat 10/10 Extreme 7 d/yr ≥105°F today · 26 d/yr by 30 yrs out
- Wind 10/10 Extreme 99% chance of damaging wind over 30 yrs
- Air quality 3/10 Moderate 3 unhealthy d/yr today · 3 by 30 yrs out
Nearby sold comps map
Loading sold comps map…
Walkable amenities ~0.75 mi
Loading nearby amenities…
Taxation est. · year 1
- Rental income
- $24,482
- − Mortgage interest
- −$1,115
- − Property taxes
- −$298
- − Insurance
- −$1,924
- − Repairs & maintenance
- −$1,959
- − Management
- −$1,959
- − HOA
- −$10,368
- − Depreciation
- −$579
- Taxable income
- $6,281
- Est. tax owed @ 24.0%
- −$1,507
- After-tax cash flow
- $3,990/yr
For passive investors: Depreciation is non-cash, so a rental often shows a tax loss while cash-flowing — sheltering income. Rental losses are passive: they offset passive income freely, and up to $25,000/yr can offset ordinary (W-2) income if you actively participate and your MAGI is under $100k (phasing out to $0 by $150k); unused losses carry forward. On sale, claimed depreciation is recaptured at up to 25%, and gains may owe capital-gains tax (a 1031 exchange can defer both). Figures are a year-1 estimate at your 24.0% rate — not tax advice; consult a CPA.
Schools (NCES district)
- District
- Broward
- NCES district ID
- 1200180
- Math proficiency
- 42% ▼ -18.00%
- Reading proficiency
- 53% ▼ -5.00%
- Median HH income
- $52,139
- Composite
- 40.88/100
- National rank
- #3621
- State rank
- #46 of 73 in FL
Livability — Lauderdale Lakes
- Score
- 81/100
- State rank
- #100
- US rank
- #1527
Category grades
Schools grade is shown separately in the Schools card above.
Census & demographics
- Census place
- Lauderdale Lakes, FL
- County
- Broward County · 1,963,430 people
- Metro
- Miami-Fort Lauderdale-Pompano Beach, FL
- Population (ZIP)
- 74,898
- Household income
- $53,973
- Rent vs Own
- Severe rent burden
- 5068.0
Population outlook (Broward County) Hauer SSP2
- Today (2025)
- 2,207,033 people
- By 2030
- 2,360,704 · +7.0%
- By 2040
- 2,661,208 · +20.6%
- By 2050
- 2,946,698 · +33.5%
- By 2075
- 3,602,273 · +63.2%
- By 2100
- 3,970,984 · +79.9%
Race, ethnicity, and origin ACS 2023
- Neighborhood character
- Predominantly Black (77%)
- Race & ethnicity
- Black 77% Two or more races 9% White 9% Hispanic / Latino 9%
- Hispanic origin (detail)
- Mexican 1% Puerto Rican 2% Cuban 1%
- Common ancestry
- Hispanic 15% Lithuanian 1% Romanian 0%
- Foreign-born
- 24% · Canada, Jamaica
- Languages at home
- 78% English-only · French/Haitian/Cajun 14% Spanish 6% Other Indo-European 1%
Political lean MEDSL · Broward
- 2024 margin
- D (+17.0) · D 58.0% · R 41.0%
- 2008→2024 swing
- -17.8pp toward R · 2008: 34.7pp · 2024: 17.0pp
- All cycles
- 2024: D+17.0 2020: D+29.8 2016: D+35.0 2012: D+34.9 2008: D+34.7
Not yet ingested
- Civics
- —
Market trends
- HPI YoY
- ▼ -300.68%
- Current HPI
- 535.2504
- Rent YoY
- ▲ 2.78%
- Metro
- Miami-Fort Lauderdale-Pompano Beach, FL
- State GDP YoY
- ▲ 3.28%
- F500 in state
- 36
Industry mix (Fortune 500 HQ in FL)
| Industry | F500 HQs | Revenue |
|---|---|---|
| Industrial Technology | 2 | $29B |
|
||
| Insurance | 2 | $17B |
|
||
| Retail | 1 | $60B |
|
||
| Technology Distribution | 1 | $58B |
|
||
| Homebuilding | 1 | $35B |
|
||
| Technology Manufacturing | 1 | $35B |
|
||
Price history
-39.7% since first listed10 events — show timeline
- 2026-04-06 Pending — MARMLS
- 2026-03-31 Price Changed $19,900 MARMLS
- 2026-03-16 Relisted — MARMLS
- 2026-03-06 Pending — MARMLS
- 2026-02-27 Price Changed $24,500 MARMLS
- 2026-02-09 Relisted — MARMLS
- 2026-02-03 Pending — MARMLS
- 2026-01-20 Price Changed $32,500 MARMLS
- 2025-12-19 Listed $39,900 MARMLS
- 1999-07-07 Sold (Public Records) $33,000 Public Records
Property tax history
+21.1%/yrLatest (2025): $2,890 · +7.7% YoY. Source: county tax records.
Cash-flow waterfall
monthlySold comps — $/sqft
last 12 mo · ≤1 miLoading sold comps…