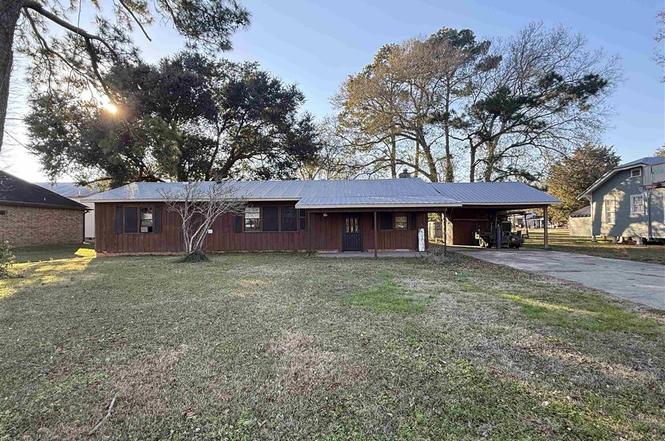
303 Elizabeth St · Welsh, LA
Flood risk No data
- FEMA flood zone
- —
- Chance of flooding over 30 yrs
- —
- Est. flood insurance / yr
- —
Fire risk No data
- Est. fire insurance / yr
- —
Heat risk No data
- Hot days now (above threshold)
- —
- Hot days in 30 yrs
- —
Wind risk No data
- Chance of severe wind over 30 yrs
- —
Air-quality risk No data
- Unhealthy air days now
- —
- Unhealthy air days in 30 yrs
- —
Risk factors via First Street. Map © Google.
Why this score? — see what drove the B grade
The composite is a weighted blend of 9 inputs, each scored 0–100. Each bar is that input's sub-score; the figure is the points it added to the 100-point composite (weight × sub-score).
- Cash flow +30.0/30.0
- 1% rule +10.0/10.0
- DSCR +10.0/10.0
- ARV discount +7.5/15.0
- Appreciation +6.0/10.0
- Livability +3.2/5.0
- Schools +3.0/10.0
- Rent growth +2.5/5.0
- Condition / age +2.5/5.0
$65,000
🖨 Deal sheet 📄 Offer letter ✓ Due diligence
Listing remarks MLS
This rustic charming 3 bed 2 bath home is situated in a great family friendly neighborhood with lush landscaping, beautiful mature trees, huge family room with a wood burning fireplace, spacious kitchen, and large bedrooms . Not in a flood zone. * Sold As Is * All Measurements are more or less
Key facts
- 0.25 acre lot
- Built 1962
- Listed 49 days
Neighborhood map
What this means for you Summary
Snapshot
- This is a 3-bed/2.0-bath single-family listed at $65k.
Deal economics
- At list price, monthly cash flow is $459 ($6k/yr) — positive.
- The deal already cash-flows at list — no discount required.
- Meets the 1% rule at list price ($1k rent vs $65k).
- Recommended offer: $63k (3.0% below list) — sets the bar for market timing.
Location & tenants
- Location reads 63/100 on livability (#189 in LA) — a middle-class / working-renter tenant base. Strengths: cost of living A+, housing A+, schools B+; Watch: amenities F, commute F, employment D-.
- Jefferson Davis Parish (town): math 30% / reading 42% proficiency, ranked #33 of 98 in LA (top 34%) — families likely to look elsewhere, expect single-tenant / working-renter base with shorter leases.
- Market conditions: 45 active listings in the ZIP; 69 units permitted in Jefferson Davis Parish in 2024 (0 in 5+ unit buildings).
Forward outlook
- In year one you build about $2k of equity ($449 loan paydown + $1k appreciation (1.9% local appreciation)).
- Jefferson Davis County population projected to shrink 8% by 2050 — rents likely to lag national; underwrite the cash flow, not the appreciation.
- At projected returns (1.9% appreciation + 3.0% rent growth), your $18k cash investment doubles in ~3 years — after that, you're playing with house money.
Negotiation context
- It's been on market 49 days — a 3% lower offer ($63k) is reasonable based on typical stale-listing flexibility.
- 2 sale attempts since 9y ago; this cycle's ask has dropped $25k (28%) from the opening price — seller is motivated, your offer sets the floor, not the list.
Questions for the listing agent
- It's been on market 49 days. Have you received any prior offers? Is the seller open to a 3% concession, seller financing, or rate buy-down credit?
- Built in 1962 — when were the roof, HVAC, electrical panel, plumbing, and water heater last replaced?
- Is there a deadline driving the sale (1031 exchange, divorce, estate, relocation)? That informs how much negotiation room exists.
- Schools are B-rated — typically a magnet for longer-tenancy family renters. What's the average tenant stay here, and is there a school-zone premium baked into asking?
- What's the average days-on-market for RENTAL listings here right now (not sales)? A rising rental-DOM trend means longer vacancies and softer asking-rent achievability than the comps imply.
- What's the recent tenant-quality profile in this submarket — average credit score on applications, eviction rate, late-payment / NSF rate, and stable-employment percentage? A property-management company in the area should have these aggregated.
- How much new for-sale + rental construction is in the pipeline within 1–3 miles? Heavy new supply typically softens prices + rents 12–24 months out; constrained supply supports both.
Investment metrics
- 1% rule
- 1.83% ✓
- Cap rate
- 14.76%
- Cash-on-cash
- 30.23%
- DSCR
- 2.35
- GRM
- 4.6
CMA / ARV
- ARV (on-the-fly)
- $223,668
- Comps found
- 7
Show comp detail 7 sales within ~0.75 mi
| Address | Dist | Beds/Ba | Sqft | Sold | Price | $/sf | Match |
|---|---|---|---|---|---|---|---|
| 310 Louviere | 0.09mi | 3/2.0 | 2,009 (+2%) | 4mo | $299,000 | $149 | 89 |
| 401 Pine St | 0.32mi | 3/2.0 | 2,000 (+2%) | 22mo | $225,000 | $113 | 64 |
| 406 West Hudspeth St | 0.57mi | 3/2.0 | 1,752 (-11%) | 1mo | $199,900 | $114 | 54 |
| 515 S Polk St S | 0.44mi | 3/2.0 | 1,768 (-10%) | 10mo | $209,000 | $118 | 54 |
| 602 W Hudspeth St W | 0.51mi | 3/2.0 | 1,700 (-13%) | 6mo | $89,000 | $52 | 49 |
| 102 S Littell St S | 0.58mi | 3/2.0 | 1,754 (-11%) | 9mo | $247,500 | $141 | 48 |
| 512 S Polk St S | 0.48mi | 2/1.0 (-1) | 1,805 (-8%) | 15mo | $110,000 | $61 | 42 |
Match score weights: distance 35% · size 25% · config 20% · recency 20%. Top-matched comps best support the ARV.
Projected returns pro-forma
1.94% appreciation · 3.0% rent growth · sell at horizon
- IRR
- 34.3%
- Equity multiple
- 2.84×
- Total profit
- $33,490
- Equity at exit
- $25,418
- IRR
- 35.5%
- Equity multiple
- 5.56×
- Total profit
- $83,008
- Equity at exit
- $36,433
Cash invested: $18,200 (down + closing). Projections, not guarantees.
Landlord ↔ Tenant lean methodology
- Overall (STATE)
- 90 Strongly Landlord-Friendly
- State Louisiana
- 90 Strongly Landlord-Friendly · R+12
- County
- — inherits STATE
- City
- — inherits STATE
ZIP-level market 70591
- Home prices YoY
- 1.1%
- Active inventory
- 45
- Price-to-rent
- 4.6×
Monthly cashflow live
- Estimated rent
- $1,187 medium interval (Pro) →
- Mortgage (P&I)
- −$341
- Tax from tax record
- −$112 /mo · $1,338/yr
- Insurance
- −$27
- HOA
- −$0
- Vacancy / Maint / Mgmt
- −$249
- Net cashflow
- $459
Break-even live
UW: 25.0% down · 7.5% · 30yr · 1.5% tax · 5.0% vac · 8.0% maint · 8.0% mgmt
Financing live
Cash to close
- Down payment
- $16,250
- Closing costs
- $1,950
- Reserves months
- —
- Total cash needed
- —
Loan-product check · same deal, 3 products live
Conventional
25% down · 7.5% · 30yr
- Down + closing
- —
- Monthly P&I
- —
- Monthly cashflow
- —
- DSCR
- —
- Eligible?
- —
Personal DTI + credit; lowest rate.
DSCR
20% down · 8.5% · 30yr
- Down + closing
- —
- Monthly P&I
- —
- Monthly cashflow
- —
- DSCR
- —
- Eligible?
- —
No personal income docs; deal must DSCR.
Hard money
10% down · 12.0% · 12mo
- Down + closing
- —
- Monthly P&I
- —
- Monthly cashflow
- —
- DSCR
- —
- Eligible?
- —
Short-term bridge; refi at stabilization.
Listing history 5 events
-
2026-03-26status Pending
-
2026-03-21price $65,000
-
2026-02-05$90,000 Active
-
2018-04-04soldstatus 295-char remark
Show marketing remark (295 chars)
This rustic charming 3 bed 2 bath home is situated in a great family friendly neighborhood with lush landscaping, beautiful mature trees, huge family room with a wood burning fireplace, spacious kitchen, and large bedrooms . Not in a flood zone. * Sold As Is * All Measurements are more or less
-
2017-07-17$119,900 295-char remark
Show marketing remark (295 chars)
This rustic charming 3 bed 2 bath home is situated in a great family friendly neighborhood with lush landscaping, beautiful mature trees, huge family room with a wood burning fireplace, spacious kitchen, and large bedrooms . Not in a flood zone. * Sold As Is * All Measurements are more or less
ⓘ Source: listings_history table (triggers on properties + properties_extension) + one-shot
backfill from property_details.listing_events for pre-trigger history.
Tax reassessment forecast LA · Resets to sale price
- Current annual tax
- $1,338 · $112/mo
- Projected year-2 tax
- $1,338 · $112/mo
- Expected delta
- $0/yr ($0/mo · 0.0%)
ⓘ Screening estimate from a state-policy table — verify with the county assessor before closing.
Nearby sold comps map
Loading sold comps map…
Walkable amenities ~0.75 mi
Loading nearby amenities…
Taxation est. · year 1
- Rental income
- $14,248
- − Mortgage interest
- −$3,641
- − Property taxes
- −$1,338
- − Insurance
- −$325
- − Repairs & maintenance
- −$1,140
- − Management
- −$1,140
- − Depreciation
- −$1,891
- Taxable income
- $4,773
- Est. tax owed @ 24.0%
- −$1,146
- After-tax cash flow
- $4,357/yr
For passive investors: Depreciation is non-cash, so a rental often shows a tax loss while cash-flowing — sheltering income. Rental losses are passive: they offset passive income freely, and up to $25,000/yr can offset ordinary (W-2) income if you actively participate and your MAGI is under $100k (phasing out to $0 by $150k); unused losses carry forward. On sale, claimed depreciation is recaptured at up to 25%, and gains may owe capital-gains tax (a 1031 exchange can defer both). Figures are a year-1 estimate at your 24.0% rate — not tax advice; consult a CPA.
Schools (NCES district)
- District
- Jefferson Davis Parish
- NCES district ID
- 2200810
- Math proficiency
- 30% ▼ -39.00%
- Reading proficiency
- 42% ▼ -33.00%
- Median HH income
- $40,322
- Composite
- 30.21/100
- National rank
- #6302
- State rank
- #33 of 98 in LA
Livability — Welsh
- Score
- 63/100
- State rank
- #189
- US rank
- #15036
Category grades
Schools grade is shown separately in the Schools card above.
Census & demographics
- Census place
- Welsh, LA
- Population (ZIP)
- 5,635
Population outlook (Jefferson Davis County) Hauer SSP2
- Today (2025)
- 31,015 people
- By 2030
- 30,563 · -1.5%
- By 2040
- 29,639 · -4.4%
- By 2050
- 28,456 · -8.3%
- By 2075
- 25,521 · -17.7%
- By 2100
- 21,787 · -29.8%
Race, ethnicity, and origin ACS 2023
- Neighborhood character
- Predominantly White (75%)
- Race & ethnicity
- White 75% Black 15% Two or more races 10%
- Common ancestry
- Lithuanian 22% Italian 1%
- Languages at home
- 93% English-only · French/Haitian/Cajun 6%
Political lean MEDSL · Jefferson Davis
- 2024 margin
- Solid R (+61.1) · D 18.8% · R 79.9% · Other 1.3%
- 2008→2024 swing
- -21.5pp toward R · 2008: -39.7pp · 2024: -61.1pp
- All cycles
- 2024: R+61.1 2020: R+55.4 2016: R+53.9 2012: R+47.6 2008: R+39.7
Not yet ingested
- Civics
- —
Market trends
- HPI YoY
- ▲ 1.94%
- Current HPI
- 174.2929
- Rent YoY
- —
- Metro
- —
- State GDP YoY
- ▲ 3.29%
- F500 in state
- 10
Industry mix (Fortune 500 HQ in LA)
| Industry | F500 HQs | Revenue |
|---|---|---|
| Telecommunications | 2 | $23B |
|
||
| Utilities | 1 | $12B |
|
||
| Wholesale / Distribution | 1 | $5B |
|
||
| Advertising | 1 | $2B |
|
||
Price history
-45.8% since first listed5 events — show timeline
- 2026-03-26 Pending — SWLAR
- 2026-03-21 Price Changed $65,000 SWLAR
- 2026-02-05 Listed $90,000 SWLAR
- 2018-04-04 Sold (MLS) — SWLAR
- 2017-07-17 Listed $119,900 SWLAR
Property tax history
+13.0%/yrLatest (2025): $1,338 · +0.4% YoY. Source: county tax records.
Cash-flow waterfall
monthlySold comps — $/sqft
last 12 mo · ≤1 miLoading sold comps…