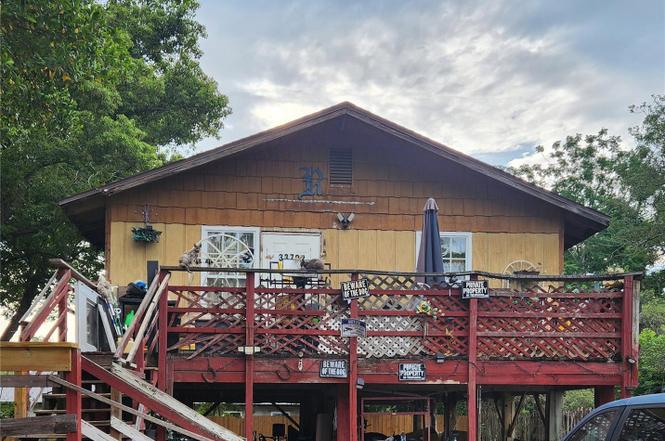
33702 Verda Ave · Leesburg, FL
Flood risk 1/10 · Minimal
- FEMA flood zone
- X (unshaded)
- Chance of flooding over 30 yrs
- 0.0%
- Est. flood insurance / yr
- $507 – $1,088
Fire risk 3/10 · Minor
- Est. fire insurance / yr
- $947 – $1,759
Heat risk 8/10 · Major
- Hot days now (above 107°F)
- 7 days/yr
- Hot days in 30 yrs
- 22 days/yr
Wind risk 9/10 · Severe
- Chance of severe wind over 30 yrs
- 99.0%
Air-quality risk 2/10 · Minimal
- Unhealthy air days now
- 1 days/yr
- Unhealthy air days in 30 yrs
- 1 days/yr
Risk factors via First Street. Map © Google.
Why this score? — see what drove the D grade
The composite is a weighted blend of 9 inputs, each scored 0–100. Each bar is that input's sub-score; the figure is the points it added to the 100-point composite (weight × sub-score).
- Cash flow +15.9/30.0
- ARV discount +7.5/15.0
- DSCR +4.9/10.0
- Schools +4.2/10.0
- 1% rule +3.4/10.0
- Livability +3.1/5.0
- Rent growth +2.5/5.0
- Condition / age +2.5/5.0
- Appreciation +0.0/10.0
$198,000
🖨 Deal sheet (PDF) 📄 Offer letter ✓ Due diligence
Listing remarks
33702 Verda Ave, a charming 912 sq. ft. home nestled on a spacious 0.33-acre lot. "Zoning: R-6" This 2-bedroom, 1-bathroom property offers cozy living with plenty of room to grow. The generous lot provides endless opportunities—whether you envision creating a lush garden retreat, adding outdoor entertainment spaces, or expanding the home to suit your lifestyle. Perfect for downsizers, or investors, this home combines comfort, potential, and a peaceful setting—all at an incredible value. Note: buyers I emphasize the importance of conducting thorough due diligence to ensure that the property meets your expectations and requirements.
Key facts
- Spacious lot
- Lush garden retreat
- 0.33 acre lot
Tags
Property features AI
Finance
- Other: Lot approximately 0.33 acre (120 x 120), paved road access; Zoned R-6
Exterior
- Parking: Attached garage (2 spaces)
- Utilities: Public water; Public sewer; Electricity available and connected
- Home design: Single-family residence; Residential property; One story; East-facing
- Construction: Frame construction; Shingle roof; Pillar/post/pier foundation; Built as one-level home
- Exterior features: Shade shutters
Interior
- Kitchen: No appliances listed
- Bedrooms: 2 bedrooms
- Flooring: Laminate flooring
- Bathrooms: 1 full bathroom
- Heating & cooling: Central heating; Central air conditioning
- Interior features: Open floorplan; Kitchen and family room combined; Living room and dining room combined
- Laundry & utility: No laundry features listed
Neighborhood map
What this means for you Summary
Snapshot
- This is a 2-bed/1.0-bath single-family listed at $198k.
Deal economics
- At list price, monthly cash flow is $93 ($1k/yr) — positive.
- The deal already cash-flows at list — no discount required.
- To meet the 1% rule (rent ≥ 1% of price), the offer needs to be $166k (16.0% below list).
- Recommended offer: $166k (16.0% below list) — sets the bar for 1% rule.
- Cap rate 6.9% vs local median 4.4% in Leesburg — top-decile yield for the area; either an underpriced asset or a hidden risk that comps aren't pricing in. Stress-test before assuming the spread holds.
Location & tenants
- Location reads 62/100 on livability (#751 in FL) — a middle-class / working-renter tenant base. Strengths: cost of living A+, housing A+; Watch: crime D, amenities F, commute F.
- Lake (suburban): math 49% / reading 50% proficiency, ranked #37 of 73 in FL (top 51%) — families likely to look elsewhere, expect single-tenant / working-renter base with shorter leases.
- Zoned schools: Treadway Elementary School (math 53% / reading 48%, grade D+, #1,055 of 2,144 statewide, top 50%, 879 students, 66% FRL); Tavares Middle School (math 43% / reading 40%, grade F, #348 of 571 statewide, top 62%, 1,070 students, 58% FRL); Tavares High School (math 32% / reading 40%, grade F, #359 of 667 statewide, top 55%, 1,507 students, 45% FRL).
- Market conditions: 288 active listings in the ZIP; 1 comparable units currently listed for rent nearby; 4,799 units permitted in Lake County in 2024 (814 in 5+ unit buildings).
- This rent runs 37% of the median local income ($54k/yr) — at the standard rent-burdened threshold; future hikes will face affordability resistance.
Forward outlook
- Local home prices are declining (-3.0%/yr); year-one equity from $1k of loan paydown is wiped out by about $6k of value loss. Plan a longer hold.
- Lake County population projected at +37% by 2050 — long-run rental-demand tailwind backs the buy-and-hold thesis.
Negotiation context
- It's been on market 267 days — a 12% lower offer ($174k) is reasonable based on typical stale-listing flexibility.
- 2 sale attempts with the ask held roughly flat each time — persistent listings suggest the price (not the market) is what's stuck; bring a comps-based counter.
- Current owner paid $95k; list at $198k implies a 108% gain — meaningful room to come down on a strong offer.
Risks & watch-outs
- Climate carrying-cost: severe wind risk, 99% chance of damaging wind over 30y; extreme-heat days projected 7→22/yr by 2055 (HVAC capex compounding) — expect insurance premiums to compound above CPI over the hold.
Questions for the listing agent
- It's been on market 267 days. Have you received any prior offers? Is the seller open to a 16% concession, seller financing, or rate buy-down credit?
- Why hasn't it sold? Are there any deal-killer items the seller is aware of (foundation, flood, title, zoning, code violations)?
- Is there a deadline driving the sale (1031 exchange, divorce, estate, relocation)? That informs how much negotiation room exists.
- Schools are D-rated, which usually means shorter tenancies and higher turnover. Who's the typical renter profile here, and what's been the actual vacancy rate?
- Crime grade is D in this area — have there been break-ins, vandalism, or insurance claims at this property in the last 3 years? What carrier currently insures it and at what premium?
- The area grade is low — what's the realistic commute time and amenity access for the typical tenant pool here? Any planned neighborhood developments (good or bad) we should know about?
- What's the average days-on-market for RENTAL listings here right now (not sales)? A rising rental-DOM trend means longer vacancies and softer asking-rent achievability than the comps imply.
- What's the recent tenant-quality profile in this submarket — average credit score on applications, eviction rate, late-payment / NSF rate, and stable-employment percentage? A property-management company in the area should have these aggregated.
- How much new for-sale + rental construction is in the pipeline within 1–3 miles? Heavy new supply typically softens prices + rents 12–24 months out; constrained supply supports both.
Investment metrics
- 1% rule
- 0.84% ✗
- Cap rate
- 6.86%
- Cash-on-cash
- 2.02%
- DSCR
- 1.09
- GRM
- 9.9
CMA / ARV
- ARV (on-the-fly)
- $112,176
- Comps found
- 3
Show comp detail 3 sales within ~0.75 mi
| Address | Dist | Beds/Ba | Sqft | Sold | Price | $/sf | Match |
|---|---|---|---|---|---|---|---|
| 13 Hawaiian Way | 0.60mi | 2/2.0 | 896 (-2%) | 19mo | $110,000 | $123 | 50 |
| 11626 Fairmont Ave | 0.52mi | 3/2.0 (+1) | 864 (-5%) | 11mo | $55,000 | $64 | 49 |
| 10830 Anna Belle Ave | 0.56mi | 3/2.0 (+1) | 1,032 (+13%) | 16mo | $220,000 | $213 | 30 |
Match score weights: distance 35% · size 25% · config 20% · recency 20%. Top-matched comps best support the ARV.
Projected returns pro-forma
-3.0% appreciation · 3.0% rent growth · sell at horizon
- IRR
- -13.1%
- Equity multiple
- 0.53×
- Total profit
- $-26,219
- Equity at exit
- $29,522
- IRR
- -4.2%
- Equity multiple
- 0.72×
- Total profit
- $-15,459
- Equity at exit
- $17,119
Cash invested: $55,440 (down + closing). Projections, not guarantees.
Landlord ↔ Tenant lean methodology
- Overall (STATE)
- 87 Strongly Landlord-Friendly
- State Florida
- 87 Strongly Landlord-Friendly · R+3
- County
- — inherits STATE
- City
- — inherits STATE
ZIP-level market 34788
- Home prices YoY
- -18.2%
- Active inventory
- 288
- Price-to-rent
- 9.9×
Monthly cashflow live
- Estimated rent
- $1,663 medium interval (Pro) →
- Mortgage (P&I)
- −$1,038
- Tax from tax record
- −$100 /mo · $1,200/yr
- Insurance
- −$82
- HOA
- −$0
- Vacancy / Maint / Mgmt
- −$349
- Net cashflow
- $93
Break-even live
Sensitivity live
| Price | -10% $205 | -5% $149 | +0% $93 | +5% $37 | +10% $-19 |
|---|---|---|---|---|---|
| Rent | -10% $-38 | -5% $27 | +0% $93 | +5% $159 | +10% $225 |
| Rate | -1.0pp $193 | -0.5pp $143 | base $93 | +0.5pp $42 | +1.0pp $-10 |
UW: 25.0% down · 7.5% · 30yr · 1.5% tax · 5.0% vac · 8.0% maint · 8.0% mgmt
Financing live
Cash to close
- Down payment
- $49,500
- Closing costs
- $5,940
- Reserves months
- —
- Total cash needed
- —
Loan-product check · same deal, 3 products live
Conventional
25% down · 7.5% · 30yr
- Down + closing
- —
- Monthly P&I
- —
- Monthly cashflow
- —
- DSCR
- —
- Eligible?
- —
Personal DTI + credit; lowest rate.
DSCR
20% down · 8.5% · 30yr
- Down + closing
- —
- Monthly P&I
- —
- Monthly cashflow
- —
- DSCR
- —
- Eligible?
- —
No personal income docs; deal must DSCR.
Hard money
10% down · 12.0% · 12mo
- Down + closing
- —
- Monthly P&I
- —
- Monthly cashflow
- —
- DSCR
- —
- Eligible?
- —
Short-term bridge; refi at stabilization.
Rent comps 1 comps
| Address | Beds | Baths | Sqft | Rent | $/sqft | DOM | Units | Dist |
|---|---|---|---|---|---|---|---|---|
| 35 Aberdeen Cir Leesburg, FL | 2.0 | 2.0 | 1072 | $1,400 | $1.31 | 25d | 1 | 1.26mi |
Listing history 18 events
-
2026-06-21days on market $198,000 Active 267 DOM
-
2026-06-18days on market $198,000 Active 264 DOM
-
2026-06-17days on market $198,000 Active 263 DOM
-
2026-06-16days on market $198,000 Active 262 DOM
-
2026-06-15days on market $198,000 Active 261 DOM
-
2026-06-13days on market $198,000 Active 259 DOM
-
2026-06-09days on market $198,000 Active 255 DOM
-
2026-06-08days on market $198,000 Active 254 DOM
-
2026-06-07days on market $198,000 Active 253 DOM
-
2026-06-04days on market $198,000 Active 250 DOM
-
2026-06-03days on market $198,000 Active 249 DOM
-
2026-06-02days on market $198,000 Active 248 DOM
-
2026-06-02days on market $198,000 Active 247 DOM
-
2026-05-31days on market $198,000 Active 246 DOM
-
2026-04-30status Active
-
2026-04-23historical
-
2025-09-20$198,000 Active
-
2011-03-09soldstatus $95,000
ⓘ Source: listings_history table (triggers on properties + properties_extension) + one-shot
backfill from property_details.listing_events for pre-trigger history.
Tax reassessment forecast FL · Resets to sale price
- Current annual tax
- $1,200 · $100/mo
- Projected year-2 tax
- $1,643 · $137/mo
- Expected delta
- +$444/yr (+$37/mo · 37.0%)
ⓘ Screening estimate from a state-policy table — verify with the county assessor before closing.
Climate risk First Street
- Flood 1/10 Low FEMA zone X (unshaded) · 0% chance over 30 yrs
- Wildfire 3/10 Moderate
- Heat 8/10 Severe 7 d/yr ≥107°F today · 22 d/yr by 30 yrs out
- Wind 9/10 Extreme 99% chance of damaging wind over 30 yrs
- Air quality 2/10 Low 1 unhealthy d/yr today · 1 by 30 yrs out
Nearby sold comps map
Loading sold comps map…
Walkable amenities ~0.75 mi
Loading nearby amenities…
Taxation est. · year 1
- Rental income
- $19,959
- − Mortgage interest
- −$11,091
- − Property taxes
- −$1,200
- − Insurance
- −$990
- − Repairs & maintenance
- −$1,597
- − Management
- −$1,597
- − Depreciation
- −$5,760
- Taxable loss
- −$2,276
- Est. tax savings @ 24.0%
- +$546
- After-tax cash flow
- $1,664/yr
For passive investors: Depreciation is non-cash, so a rental often shows a tax loss while cash-flowing — sheltering income. Rental losses are passive: they offset passive income freely, and up to $25,000/yr can offset ordinary (W-2) income if you actively participate and your MAGI is under $100k (phasing out to $0 by $150k); unused losses carry forward. On sale, claimed depreciation is recaptured at up to 25%, and gains may owe capital-gains tax (a 1031 exchange can defer both). Figures are a year-1 estimate at your 24.0% rate — not tax advice; consult a CPA.
Schools (NCES district)
- District
- Lake
- NCES district ID
- 1201050
- Math proficiency
- 49% ▼ -7.00%
- Reading proficiency
- 50% ▼ -4.00%
- Median HH income
- $46,632
- Composite
- 42.05/100
- National rank
- #3327
- State rank
- #37 of 73 in FL
Livability — Leesburg
- Score
- 62/100
- State rank
- #751
- US rank
- #16429
Category grades
Schools grade is shown separately in the Schools card above.
Census & demographics
- County
- Lake County · 364,602 people
- City population
- 21,867
- Metro
- Orlando-Kissimmee-Sanford, FL
- Population (ZIP)
- 22,137
- Household income
- $54,147
- Rent vs Own
- Severe rent burden
- 406.0
Population outlook (Lake County) Hauer SSP2
- Today (2025)
- 386,640 people
- By 2030
- 417,107 · +7.9%
- By 2040
- 476,676 · +23.3%
- By 2050
- 531,296 · +37.4%
- By 2075
- 648,303 · +67.7%
- By 2100
- 698,530 · +80.7%
Race, ethnicity, and origin ACS 2023
- Neighborhood character
- Predominantly White (79%)
- Race & ethnicity
- White 79% Hispanic / Latino 12% Two or more races 7% Black 5% Asian 1%
- Hispanic origin (detail)
- Mexican 3% Puerto Rican 6%
- Common ancestry
- Romanian 4% Lithuanian 3% Slovak 2%
- Foreign-born
- 5% · Canada, South Korea
- Languages at home
- 88% English-only · Spanish 9% German/W. Germanic 1% Tagalog/Filipino 1%
Political lean MEDSL · Lake
- 2024 margin
- Strong R (+24.7) · D 37.3% · R 62.0%
- 2008→2024 swing
- -11.2pp toward R · 2008: -13.5pp · 2024: -24.7pp
- All cycles
- 2024: R+24.7 2020: R+20.0 2016: R+23.1 2012: R+17.1 2008: R+13.5
Not yet ingested
- Civics
- —
Market trends
- HPI YoY
- ▼ -61.07%
- Current HPI
- 273.6616
- Rent YoY
- —
- Metro
- Orlando-Kissimmee-Sanford, FL
- State GDP YoY
- ▲ 3.28%
- F500 in state
- 36
Industry mix (Fortune 500 HQ in FL)
| Industry | F500 HQs | Revenue |
|---|---|---|
| Industrial Technology | 2 | $29B |
|
||
| Insurance | 2 | $17B |
|
||
| Retail | 1 | $60B |
|
||
| Technology Distribution | 1 | $58B |
|
||
| Homebuilding | 1 | $35B |
|
||
| Technology Manufacturing | 1 | $35B |
|
||
Price history
+108.4% since first listed4 events — show timeline
- 2026-04-30 Relisted — Stellar MLS as Distributed by MLS Grid
- 2026-04-23 Listing Removed — Stellar MLS as Distributed by MLS Grid
- 2025-09-20 Listed $198,000 Stellar MLS as Distributed by MLS Grid
- 2011-03-09 Sold (Public Records) $95,000 Public Records
Property tax history
+9.5%/yrLatest (2025): $1,200 · +2.6% YoY. Source: county tax records.
Cash-flow waterfall
monthlySold comps — $/sqft
last 12 mo · ≤1 miLoading sold comps…