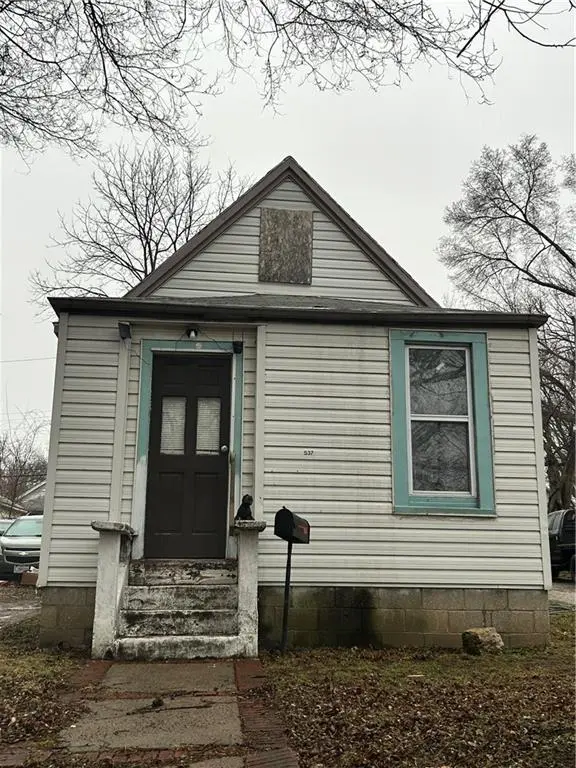
537 S Cedar Ave · Independence, MO
Flood risk 1/10 · Minimal
- FEMA flood zone
- X (unshaded)
- Chance of flooding over 30 yrs
- 0.0%
- Est. flood insurance / yr
- $473 – $860
Fire risk 1/10 · Minimal
- Est. fire insurance / yr
- $1,054 – $1,958
Heat risk 4/10 · Minor
- Hot days now (above 106°F)
- 7 days/yr
- Hot days in 30 yrs
- 17 days/yr
Wind risk 2/10 · Minimal
- Chance of severe wind over 30 yrs
- —
Air-quality risk 3/10 · Minor
- Unhealthy air days now
- 2 days/yr
- Unhealthy air days in 30 yrs
- 3 days/yr
Risk factors via First Street. Map © Google.
Why this score? — see what drove the A grade
The composite is a weighted blend of 9 inputs, each scored 0–100. Each bar is that input's sub-score; the figure is the points it added to the 100-point composite (weight × sub-score).
- Cash flow +30.0/30.0
- ARV discount +15.0/15.0
- 1% rule +10.0/10.0
- DSCR +10.0/10.0
- Appreciation +10.0/10.0
- Livability +4.1/5.0
- Schools +2.7/10.0
- Rent growth +2.5/5.0
- Condition / age +2.5/5.0
$68,500
🖨 Deal sheet 📄 Offer letter ✓ Due diligence
Listing remarks MLS
Calling all investors and savvy buyers! This charming 2-bedroom, 1 bath cottage offers great potential and may qualify for conventional financing. With just some TLC, this property can truly shine—perfect for a rental, flip, or cozy personal retreat. Great chance to add value with reasonable repairs! SELLING AS IS, IN IT'S PRESENT CONDITION
Key facts
- 1,838 sq ft lot
- Garage
- Built 1900
Neighborhood map
What this means for you Summary
Snapshot
- This is a 2-bed/1.0-bath single-family listed at $68k.
Deal economics
- At list price, monthly cash flow is $468 ($6k/yr) — positive.
- The deal already cash-flows at list — no discount required.
- Meets the 1% rule at list price ($1k rent vs $68k).
- Recommended offer: $66k (3.0% below list) — sets the bar for market timing.
- Cap rate 14.5% vs local median 5.0% in Independence — top-decile yield for the area; either an underpriced asset or a hidden risk that comps aren't pricing in. Stress-test before assuming the spread holds.
Location & tenants
- Location reads 82/100 on livability (#10 in MO, #1,296 nationally) — a professional / high-income tenant draw. Strengths: amenities A+, commute A+, cost of living A+; Watch: schools C-, employment D+, crime F.
- Independence 30 (suburban): math 26% / reading 38% proficiency, ranked #252 of 324 in MO (top 78%) — families likely to look elsewhere, expect single-tenant / working-renter base with shorter leases.
- Market conditions: 46 active listings in the ZIP; 22 comparable units currently listed for rent nearby; rentals at typical pace (median 24d on market — plan ~3-4 weeks tenant-placement turnaround); 45% of comp listings sitting > 30 days — soft ceiling on asking rent; 4,002 units permitted in Jackson County in 2024 (2,271 in 5+ unit buildings).
Forward outlook
- In year one you build about $7k of equity ($474 loan paydown + $7k appreciation (10.0% local appreciation)).
- Jackson County population projected at +4% by 2050 — modest demand growth; plan on rents tracking national, not racing it.
- At projected returns (10.0% appreciation + 3.0% rent growth), your $19k cash investment doubles in ~2 years — after that, you're playing with house money.
- By year 5, paydown + projected appreciation supports a ~$34k cash-out refi (75% LTV) — recoverable capital for the next deal without selling this one.
Negotiation context
- It's been on market 45 days — a 3% lower offer ($66k) is reasonable based on typical stale-listing flexibility.
- 3 sale attempts since 11y ago with the ask held roughly flat each time — persistent listings suggest the price (not the market) is what's stuck; bring a comps-based counter.
Risks & watch-outs
- Watch-outs: built in 1900 — expect roof / HVAC / electrical / plumbing capex.
Questions for the listing agent
- It's been on market 45 days. Have you received any prior offers? Is the seller open to a 3% concession, seller financing, or rate buy-down credit?
- Built in 1900 — when were the roof, HVAC, electrical panel, plumbing, and water heater last replaced?
- Is there a deadline driving the sale (1031 exchange, divorce, estate, relocation)? That informs how much negotiation room exists.
- Crime grade is F in this area — have there been break-ins, vandalism, or insurance claims at this property in the last 3 years? What carrier currently insures it and at what premium?
- What's the average days-on-market for RENTAL listings here right now (not sales)? A rising rental-DOM trend means longer vacancies and softer asking-rent achievability than the comps imply.
- What's the recent tenant-quality profile in this submarket — average credit score on applications, eviction rate, late-payment / NSF rate, and stable-employment percentage? A property-management company in the area should have these aggregated.
- How much new for-sale + rental construction is in the pipeline within 1–3 miles? Heavy new supply typically softens prices + rents 12–24 months out; constrained supply supports both.
Investment metrics
- 1% rule
- 1.71% ✓
- Cap rate
- 14.49%
- Cash-on-cash
- 29.28%
- DSCR
- 2.30
- GRM
- 4.9
CMA / ARV
- ARV (median comp)
- $120,799
- List price
- $68,500
- Delta
- -43.29%
- Verdict
- UNDERPRICED
- Comps
- 20 within 1.0 mi
Show comp detail 12 sales within ~0.75 mi
| Address | Dist | Beds/Ba | Sqft | Sold | Price | $/sf | Match |
|---|---|---|---|---|---|---|---|
| 823 S Huttig Ave | 0.38mi | 3/2.0 (+1) | 1,052 (0%) | 2mo | $76,000 | $72 | 72 |
| 566 S Overton Ave | 0.22mi | 2/1.0 | 940 (-11%) | 3mo | $90,000 | $96 | 70 |
| 10804 Felton St | 0.63mi | 2/1.0 | 1,063 (+1%) | 2mo | $138,500 | $130 | 67 |
| 536 S Evanston Ave | 0.27mi | 3/1.0 (+1) | 1,144 (+9%) | 0mo | $140,000 | $122 | 67 |
| 705 S Hawthorne Ave | 0.26mi | 2/1.0 | 1,178 (+12%) | 2mo | $159,000 | $135 | 66 |
| 115 N Arlington Ave | 0.54mi | 3/2.0 (+1) | 1,046 (-1%) | 2mo | $169,000 | $162 | 63 |
| 10402 E Kentucky Rd | 0.43mi | 2/1.0 | 932 (-11%) | 2mo | $175,000 | $188 | 60 |
| 578 S Oxford Ave | 0.52mi | 3/1.0 (+1) | 990 (-6%) | 2mo | $89,000 | $90 | 59 |
| 10143 E Golf Ave | 0.52mi | 3/1.0 (+1) | 1,135 (+8%) | 0mo | $119,900 | $106 | 58 |
| 809 S Carlisle Ave | 0.62mi | 2/1.0 | 950 (-10%) | 2mo | $180,000 | $189 | 53 |
| 10515 E Lake Dr | 0.53mi | 3/1.0 (+1) | 913 (-13%) | 1mo | $165,000 | $181 | 48 |
| 10531 E 9th St S | 0.52mi | 3/2.0 (+1) | 1,175 (+12%) | 2mo | $180,000 | $153 | 45 |
Match score weights: distance 35% · size 25% · config 20% · recency 20%. Top-matched comps best support the ARV.
Projected returns pro-forma
10.0% appreciation · 3.0% rent growth · sell at horizon
- IRR
- 46.5%
- Equity multiple
- 4.50×
- Total profit
- $67,121
- Equity at exit
- $61,710
- IRR
- 40.4%
- Equity multiple
- 10.08×
- Total profit
- $174,239
- Equity at exit
- $133,080
Cash invested: $19,180 (down + closing). Projections, not guarantees.
Landlord ↔ Tenant lean methodology
- Overall (STATE)
- 81 Strongly Landlord-Friendly
- State Missouri
- 81 Strongly Landlord-Friendly · R+10
- County
- — inherits STATE
- City
- — inherits STATE
ZIP-level market 64053
- Home prices YoY
- 17.9%
- Active inventory
- 46
- Price-to-rent
- 4.9×
Monthly cashflow live
- Estimated rent
- $1,172 high interval (Pro) →
- Mortgage (P&I)
- −$359
- Tax from tax record
- −$70 /mo · $845/yr
- Insurance
- −$29
- HOA
- −$0
- Vacancy / Maint / Mgmt
- −$246
- Net cashflow
- $468
Break-even live
UW: 25.0% down · 7.5% · 30yr · 1.5% tax · 5.0% vac · 8.0% maint · 8.0% mgmt
Financing live
Cash to close
- Down payment
- $17,125
- Closing costs
- $2,055
- Reserves months
- —
- Total cash needed
- —
Loan-product check · same deal, 3 products live
Conventional
25% down · 7.5% · 30yr
- Down + closing
- —
- Monthly P&I
- —
- Monthly cashflow
- —
- DSCR
- —
- Eligible?
- —
Personal DTI + credit; lowest rate.
DSCR
20% down · 8.5% · 30yr
- Down + closing
- —
- Monthly P&I
- —
- Monthly cashflow
- —
- DSCR
- —
- Eligible?
- —
No personal income docs; deal must DSCR.
Hard money
10% down · 12.0% · 12mo
- Down + closing
- —
- Monthly P&I
- —
- Monthly cashflow
- —
- DSCR
- —
- Eligible?
- —
Short-term bridge; refi at stabilization.
Rent comps 22 comps
| Address | Beds | Baths | Sqft | Rent | $/sqft | DOM | Units | Dist |
|---|---|---|---|---|---|---|---|---|
| 10104 E Golf Ave Independence, MO | 3.0 | 2.0 | 1205 | $1,395 | $1.16 | 14d | 1 | 0.41mi |
| 600 S Glenwood Ave Unit I Independence, MO | 1.0 | 1.0 | 700 | $695 | $0.99 | 43d | 1 | 0.49mi |
| 600 S Glenwood Ave Unit F Independence, MO | 2.0 | 1.0 | 750 | $995 | $1.33 | 20d | 1 | 0.49mi |
| 576 S Oxford Ave Independence, MO | 3.0 | 2.0 | 1098 | $1,400 | $1.28 | 43d | 1 | 0.51mi |
| 10522 E 10th St S Independence, MO | 2.0 | 1.0 | 1020 | $1,099 | $1.08 | 23d | 1 | 0.60mi |
| 100 S Oxford Ave Independence, MO | 3.0 | 2.0 | 1141 | $1,425 | $1.25 | 44d | 1 | 0.61mi |
| 10561 E Lake Dr Independence, MO | 2.0 | 1.0 | 800 | $1,000 | $1.25 | 43d | 1 | 0.62mi |
| 9528 E Winner Rd Independence, MO | 1.0–3.0 | 1.0 | 730 | $999 | $1.37 | 43d | 1 | 0.66mi |
| 1109 S Appleton Ave Independence, MO | 3.0 | 2.0 | 1200 | $1,195 | $1.00 | 16d | 1 | 0.71mi |
| 1138 S Glenwood Ave Independence, MO | 2.0 | 1.0 | 1180 | $1,095 | $0.93 | 20d | 1 | 0.77mi |
| 11500 E Anderson St Independence, MO | 3.0 | 2.0 | 1200 | $1,599 | $1.33 | 17d | 1 | 0.98mi |
| 1425 S Northern Blvd Independence, MO | 3.0 | 1.5 | 1275 | $1,200 | $0.94 | 7d | 1 | 1.00mi |
| 10119 E Winner Rd Unit 2 Independence, MO | 1.0 | 1.0 | 1000 | $1,045 | $1.04 | 21d | 1 | 1.06mi |
| 11601 E US Highway 24 Apt DA Independence, MO | 2.0 | 1.0 | 900 | $1,400 | $1.56 | 43d | 1 | 1.07mi |
| 182 Novak St Sugar Creek, MO | 3.0 | 2.0 | 1350 | $1,800 | $1.33 | 17d | 1 | 1.11mi |
| 1712 S Ash Ave Independence, MO | 2.0 | 1.0 | 800 | $945 | $1.18 | 43d | 1 | 1.11mi |
| 1712 S Ash Ave Unit 1714-3 Independence, MO | 2.0 | 1.0 | 700 | $895 | $1.28 | 23d | 1 | 1.11mi |
| 8705 E Smart Ave Independence, MO | 2.0 | 1.0 | 750 | $1,000 | $1.33 | 43d | 1 | 1.14mi |
| 10714 E 19th St S Independence, MO | 2.0 | 1.0 | 1010 | $895 | $0.89 | 3d | 1 | 1.36mi |
| 10323 E 20th St S Independence, MO | 3.0 | 1.0 | 936 | $1,400 | $1.50 | 43d | 1 | 1.47mi |
| 11616 E 16th St S Independence, MO | 2.0 | 1.0 | 1016 | $1,125 | $1.11 | 43d | 1 | 1.49mi |
| 10817 E 19th Ter S Independence, MO | 3.0 | 1.0 | 1428 | $1,801 | $1.26 | 16d | 1 | 1.49mi |
Listing history 10 events
-
2026-06-03status $68,500 Pending 45 DOM
-
2026-06-02days on market $68,500 Active 45 DOM
-
2026-06-01days on market $68,500 Active 44 DOM
-
2026-05-31days on market $68,500 Active 43 DOM
-
2026-05-18status Active 349-char remark
Show marketing remark (349 chars)
Calling all investors and savvy buyers! This charming 2-bedroom, 1 bath cottage offers great potential and may qualify for conventional financing. With just some TLC, this property can truly shine—perfect for a rental, flip, or cozy personal retreat. Great chance to add value with reasonable repairs! SELLING AS IS, IN IT'S PRESENT CONDITION
-
2026-05-06status Pending 349-char remark
Show marketing remark (349 chars)
Calling all investors and savvy buyers! This charming 2-bedroom, 1 bath cottage offers great potential and may qualify for conventional financing. With just some TLC, this property can truly shine—perfect for a rental, flip, or cozy personal retreat. Great chance to add value with reasonable repairs! SELLING AS IS, IN IT'S PRESENT CONDITION
-
2026-04-07$68,500 Active 349-char remark
Show marketing remark (349 chars)
Calling all investors and savvy buyers! This charming 2-bedroom, 1 bath cottage offers great potential and may qualify for conventional financing. With just some TLC, this property can truly shine—perfect for a rental, flip, or cozy personal retreat. Great chance to add value with reasonable repairs! SELLING AS IS, IN IT'S PRESENT CONDITION
-
2015-08-31soldstatus 423-char remark
Show marketing remark (423 chars)
Total commission paid on auction properties is 5% of the contract sales price: 2.5% to the listing broker with a $1,500 minimum and 2.5% to the cooperating broker with a $1,500 minimum. No other incentives apply. Seller has the right (a) to change the date, place, and terms of the sale; (b) to remove the property from the market; and (c) to sell the property prior to the sale. Talk to Listing Agent for details. ”
-
2015-07-03$6,500 423-char remark
Show marketing remark (423 chars)
Total commission paid on auction properties is 5% of the contract sales price: 2.5% to the listing broker with a $1,500 minimum and 2.5% to the cooperating broker with a $1,500 minimum. No other incentives apply. Seller has the right (a) to change the date, place, and terms of the sale; (b) to remove the property from the market; and (c) to sell the property prior to the sale. Talk to Listing Agent for details. ”
-
1992-08-27soldstatus
ⓘ Source: listings_history table (triggers on properties + properties_extension) + one-shot
backfill from property_details.listing_events for pre-trigger history.
Tax reassessment forecast MO · Resets to sale price
- Current annual tax
- $845 · $70/mo
- Projected year-2 tax
- $845 · $70/mo
- Expected delta
- $0/yr ($0/mo · 0.0%)
ⓘ Screening estimate from a state-policy table — verify with the county assessor before closing.
Climate risk First Street
- Flood 1/10 Low FEMA zone X (unshaded) · 0% chance over 30 yrs
- Wildfire 1/10 Low
- Heat 4/10 Moderate 7 d/yr ≥106°F today · 17 d/yr by 30 yrs out
- Wind 2/10 Low
- Air quality 3/10 Moderate 2 unhealthy d/yr today · 3 by 30 yrs out
Nearby sold comps map
Loading sold comps map…
Walkable amenities ~0.75 mi
Loading nearby amenities…
Taxation est. · year 1
- Rental income
- $14,069
- − Mortgage interest
- −$3,837
- − Property taxes
- −$845
- − Insurance
- −$342
- − Repairs & maintenance
- −$1,125
- − Management
- −$1,125
- − Depreciation
- −$1,993
- Taxable income
- $4,800
- Est. tax owed @ 24.0%
- −$1,152
- After-tax cash flow
- $4,464/yr
For passive investors: Depreciation is non-cash, so a rental often shows a tax loss while cash-flowing — sheltering income. Rental losses are passive: they offset passive income freely, and up to $25,000/yr can offset ordinary (W-2) income if you actively participate and your MAGI is under $100k (phasing out to $0 by $150k); unused losses carry forward. On sale, claimed depreciation is recaptured at up to 25%, and gains may owe capital-gains tax (a 1031 exchange can defer both). Figures are a year-1 estimate at your 24.0% rate — not tax advice; consult a CPA.
Schools (NCES district)
- District
- Independence 30
- NCES district ID
- 2915480
- Math proficiency
- 26% ▼ -8.00%
- Reading proficiency
- 38% ▼ -5.00%
- Median HH income
- $41,843
- Composite
- 27.04/100
- National rank
- #7054
- State rank
- #252 of 324 in MO
Livability — Independence
- Score
- 82/100
- State rank
- #10
- US rank
- #1296
Category grades
Schools grade is shown separately in the Schools card above.
Census & demographics
- Census place
- Independence, MO
- County
- Jackson County · 687,798 people
- City population
- 117,675
- Metro
- Kansas City, MO-KS
- Population (ZIP)
- 6,775
- Household income
- $47,285
- Rent vs Own
- Severe rent burden
- 330.0
Population outlook (Jackson County) Hauer SSP2
- Today (2025)
- 719,589 people
- By 2030
- 731,456 · +1.6%
- By 2040
- 746,689 · +3.8%
- By 2050
- 749,289 · +4.1%
- By 2075
- 736,227 · +2.3%
- By 2100
- 668,210 · -7.1%
Race, ethnicity, and origin ACS 2023
- Neighborhood character
- Diverse neighborhood (Simpson 0.57)
- Race & ethnicity
- White 59% Hispanic / Latino 28% Two or more races 14% Black 9% Native American 3%
- Hispanic origin (detail)
- Mexican 25%
- Common ancestry
- Italian 12% Lithuanian 3% Slovak 1%
- Foreign-born
- 12% · Canada, China
- Languages at home
- 78% English-only · Spanish 21%
Political lean MEDSL · Jackson
- 2024 margin
- D (+19.3) · D 58.9% · R 39.5% · Other 1.6%
- 2008→2024 swing
- -6.1pp toward R · 2008: 25.4pp · 2024: 19.3pp
- All cycles
- 2024: D+19.3 2020: D+22.0 2016: D+16.6 2012: D+19.0 2008: D+25.4
Not yet ingested
- Civics
- —
Market trends
- HPI YoY
- ▲ 52.69%
- Current HPI
- 347.9512
- Rent YoY
- —
- Metro
- Kansas City, MO-KS
- State GDP YoY
- ▲ 1.84%
- F500 in state
- 20
Industry mix (Fortune 500 HQ in MO)
| Industry | F500 HQs | Revenue |
|---|---|---|
| Healthcare | 1 | $163B |
|
||
| Insurance | 1 | $21B |
|
||
| Industrial Technology | 1 | $17B |
|
||
| Retail | 1 | $16B |
|
||
| Industrial Distribution | 1 | $10B |
|
||
| Utilities | 1 | $9B |
|
||
Price history
+953.8% since first listed6 events — show timeline
- 2026-05-18 Relisted — Heartland MLS as Distributed by MLS Grid
- 2026-05-06 Pending — Heartland MLS as Distributed by MLS Grid
- 2026-04-07 Listed $68,500 Heartland MLS as Distributed by MLS Grid
- 2015-08-31 Sold (MLS) — Heartland MLS as Distributed by MLS Grid
- 2015-07-03 Listed $6,500 Heartland MLS as Distributed by MLS Grid
- 1992-08-27 Sold (Public Records) — Public Records
Property tax history
+3.3%/yrLatest (2025): $845 · -43.5% YoY. Source: county tax records.
Cash-flow waterfall
monthlySold comps — $/sqft
last 12 mo · ≤1 miLoading sold comps…