 Duplex
901 NE 2nd St · Hallandale Beach, FL
Flood risk 7/10 · Major
- FEMA flood zone
- AE
- Chance of flooding over 30 yrs
- 0.78%
- Est. flood insurance / yr
- $1,737 – $8,500
Fire risk 1/10 · Minimal
- Est. fire insurance / yr
- $947 – $1,759
Heat risk 10/10 · Severe
- Hot days now (above 104°F)
- 7 days/yr
- Hot days in 30 yrs
- 27 days/yr
Wind risk 10/10 · Severe
- Chance of severe wind over 30 yrs
- 99.0%
Air-quality risk 2/10 · Minimal
- Unhealthy air days now
- 1 days/yr
- Unhealthy air days in 30 yrs
- 2 days/yr
Risk factors via First Street. Map © Google.
Why this score? — see what drove the C grade
The composite is a weighted blend of 9 inputs, each scored 0–100. Each bar is that input's sub-score; the figure is the points it added to the 100-point composite (weight × sub-score).
- Cash flow +23.9/30.0
- DSCR +7.7/10.0
- ARV discount +7.5/15.0
- 1% rule +6.2/10.0
- Schools +4.1/10.0
- Livability +4.0/5.0
- Condition / age +3.8/5.0
- Rent growth +2.6/5.0
- Appreciation +0.0/10.0
$750,000
🖨 Deal sheet 📄 Offer letter ✓ Due diligence
Multi-family units
County records classify this as Multi-Family (2-4 Unit). Listing-text estimate: 2 units. confirmed
Listing remarks
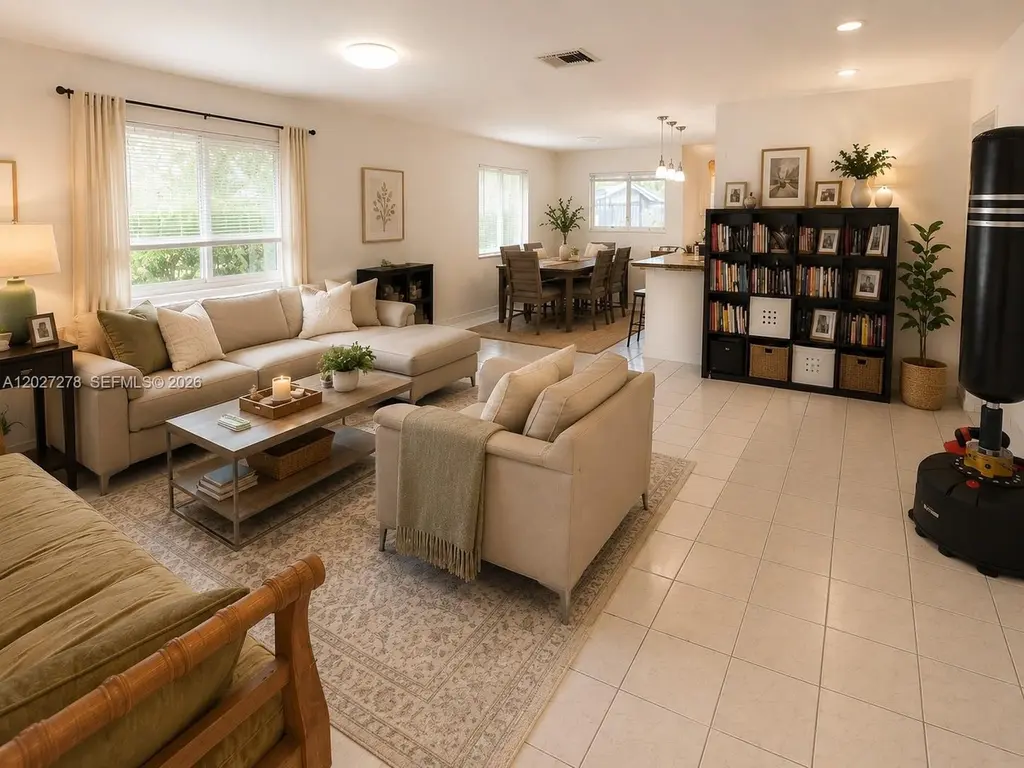
Excellent income-producing investment opportunity in the heart of Hallandale Beach! This updated duplex features a spacious 3BR/2BA unit and a 2BR/2BA unit, both currently rented and generating income. Each apartment offers central A/C, two full bathrooms, and in-unit laundry. The property features a beautifully maintained common outdoor area and four on-site parking spaces. Conveniently located just off Hallandale Beach Blvd, between US-1 and A1A, with easy access to shopping, dining, entertainment, Gulfstream Park, major highways, and the beach. Well-maintained property with strong rental appeal. Ideal for investors seeking immediate cash flow or long-term appreciation potential.
Key facts
- Common outdoor area
- Updated duplex
- In-unit laundry
Tags
Property features AI
Finance
- Financial info: Two 2-bedroom units listed with actual rent around $3,000 each; One 3-bedroom unit listed with actual rent around $3,500; Some rent items include gardener and hot water
- HOA & community: Association fees billed annually
Exterior
- Parking: Four open parking spaces
- Utilities: Public sewer; Cable available
- Home design: Single-story building; Zoning: RD-12; Effective year built
- Construction: Block construction
- Exterior features: Open parking (total 4 spaces); Less than quarter acre lot
Interior
- Bedrooms: Two 2-bedroom units; One 3-bedroom unit
- Flooring: Tile
- Bathrooms: Each 2-bedroom unit has 2 full bathrooms; 3-bedroom unit has 2 full bathrooms
- Heating & cooling: Central air
- Interior features: Tile flooring; Central air conditioning
Neighborhood map
What this means for you Summary
Snapshot
- This is a 2 × 3.0-bed/2.0-bath units multifamily listed at $750k. Condition is rated good.
Deal economics
- At list price, monthly cash flow is $1k ($12k/yr) — positive. Per door: $517/mo.
- The deal already cash-flows at list — no discount required.
- Meets the 1% rule at list price ($8k rent vs $750k).
- Cap rate 8.6% vs local median 5.2% in Hallandale Beach — top-decile yield for the area; either an underpriced asset or a hidden risk that comps aren't pricing in. Stress-test before assuming the spread holds.
Location & tenants
- Location reads 81/100 on livability (#86 in FL, #1,400 nationally) — a professional / high-income tenant draw. Strengths: commute A+, health & safety A+, crime B+; Watch: schools C-, employment D-.
- Broward (suburban): math 42% / reading 53% proficiency, ranked #46 of 73 in FL (top 63%) — families likely to look elsewhere, expect single-tenant / working-renter base with shorter leases.
- Market conditions: Rents flat; 1373 active listings in the ZIP; 7 comparable units currently listed for rent nearby; rentals at typical pace (median 20d on market — plan ~3-4 weeks tenant-placement turnaround); 2,111 units permitted in Broward County in 2024 (1,265 in 5+ unit buildings).
- At $8,410/mo this rent would consume 194% of the median local household income ($52k/yr) (locally 3293% of renters already pay >50% of income on rent) — very limited rent-growth headroom before tenants either downsize or default.
Forward outlook
- Local home prices are declining (-3.0%/yr); year-one equity from $5k of loan paydown is wiped out by about $22k of value loss. Plan a longer hold.
- Broward County population projected at +34% by 2050 — long-run rental-demand tailwind backs the buy-and-hold thesis.
Negotiation context
- Only 13 days on market — expect competitive offers; lowballing is unlikely to land.
- 2 sale attempts since 3y ago with the ask held roughly flat each time — persistent listings suggest the price (not the market) is what's stuck; bring a comps-based counter.
Risks & watch-outs
- Watch-outs: flood insurance adds $427/mo.
- Climate carrying-cost: in FEMA flood zone AE (mandatory federal flood insurance); severe wind risk, 99% chance of damaging wind over 30y; extreme-heat days projected 7→27/yr by 2055 (HVAC capex compounding) — expect insurance premiums to compound above CPI over the hold.
Questions for the listing agent
- Can we see the unit-by-unit rent roll, current vacancy, and any below-market leases? What's the average tenancy length?
- What capital expenditures (roof, boiler, parking lot, exteriors) have been made in the last 5 years, and what's planned in the next 2?
- Built in 1978 — when were the roof, HVAC, electrical panel, plumbing, and water heater last replaced?
- What's the actual annual flood-insurance premium (NFIP or private), and is the property in a SFHA with mandatory coverage?
- Is there a deadline driving the sale (1031 exchange, divorce, estate, relocation)? That informs how much negotiation room exists.
- What's the average days-on-market for RENTAL listings here right now (not sales)? A rising rental-DOM trend means longer vacancies and softer asking-rent achievability than the comps imply.
- What's the recent tenant-quality profile in this submarket — average credit score on applications, eviction rate, late-payment / NSF rate, and stable-employment percentage? A property-management company in the area should have these aggregated.
- How much new apartment / multifamily construction is in the pipeline within 1–3 miles? Heavy new supply (>2% of stock underway) typically softens rents 12–24 months out; light construction supports rent growth.
Investment metrics
- 1% rule
- 1.12% ✓
- Cap rate
- 8.63%
- Cash-on-cash
- 8.35%
- DSCR
- 1.37
- GRM
- 7.4
CMA / ARV
No comps found within radius.
Projected returns pro-forma
-3.0% appreciation · 0.43% rent growth · sell at horizon
- IRR
- -10.3%
- Equity multiple
- 0.64×
- Total profit
- $-76,473
- Equity at exit
- $111,827
- IRR
- -5.2%
- Equity multiple
- 0.70×
- Total profit
- $-62,829
- Equity at exit
- $64,846
Cash invested: $210,000 (down + closing). Projections, not guarantees.
Landlord ↔ Tenant lean methodology
- Overall (STATE)
- 87 Strongly Landlord-Friendly
- State Florida
- 87 Strongly Landlord-Friendly · R+3
- County
- — inherits STATE
- City
- — inherits STATE
ZIP-level market 33009
- Rents YoY
- 0.4%
- Active inventory
- 1373
- Price-to-rent
- 14.9×
Monthly cashflow live
- Estimated rent
- $8,410 high interval (Pro) →
- Mortgage (P&I)
- −$3,933
- Tax est. 1.5%
- −$938 /mo · $11,250/yr
- Insurance
- −$312
- Flood insurance flood zone
- −$427 /mo · $5,118/yr
- HOA
- −$0
- Vacancy / Maint / Mgmt
- −$1,766
- Net cashflow
- $1,034
Break-even live
2-unit breakdown (identical units grouped — click to expand)
| Units | Beds | Baths | Est. rent |
|---|---|---|---|
| 2× units | 3.0 | 2 | $8,410 |
| #1 | 3.0 | 2 | $4,205 |
| #2 | 3.0 | 2 | $4,205 |
| Total (2 units) | $8,410 | ||
UW: 25.0% down · 7.5% · 30yr · 1.5% tax · 5.0% vac · 8.0% maint · 8.0% mgmt
Financing live
Cash to close
- Down payment
- $187,500
- Closing costs
- $22,500
- Reserves months
- —
- Total cash needed
- —
Loan-product check · same deal, 3 products live
Conventional
25% down · 7.5% · 30yr
- Down + closing
- —
- Monthly P&I
- —
- Monthly cashflow
- —
- DSCR
- —
- Eligible?
- —
Personal DTI + credit; lowest rate.
DSCR
20% down · 8.5% · 30yr
- Down + closing
- —
- Monthly P&I
- —
- Monthly cashflow
- —
- DSCR
- —
- Eligible?
- —
No personal income docs; deal must DSCR.
Hard money
10% down · 12.0% · 12mo
- Down + closing
- —
- Monthly P&I
- —
- Monthly cashflow
- —
- DSCR
- —
- Eligible?
- —
Short-term bridge; refi at stabilization.
Rent comps 7 comps
| Address | Beds | Baths | Sqft | Rent | $/sqft | DOM | Units | Dist |
|---|---|---|---|---|---|---|---|---|
| 113 SW 2nd St Hallandale Beach, FL | 5.0 | 2.0 | 1866 | $6,000 | $3.22 | 19d | 1 | 0.76mi |
| 1252 Coral Ln Unit 1252 Hollywood, FL | 5.0 | 3.0 | 2388 | $7,500 | $3.14 | 3d | 1 | 0.98mi |
| 1252 Coral Ln Unit 1252 Hollywood, FL | 5.0 | 3.0 | 2388 | $7,500 | $3.14 | 21d | 1 | 0.98mi |
| 1110 S 14th Ave Hollywood, FL | 5.0 | 3.0 | 2267 | $6,600 | $2.91 | 20d | 1 | 1.02mi |
| 3294 NE 211th Ter Miami, FL | 5.0 | 5.5 | 3209 | $18,000 | $5.61 | 15d | 1 | 1.18mi |
| 1640 Jefferson St Hollywood, FL | 5.0 | 2.0 | 1750 | $8,995 | $5.14 | 24d | 1 | 1.23mi |
| 207 Holiday Dr Hallandale Beach, FL | 5.0 | 3.5 | 3296 | $28,500 | $8.65 | 24d | 1 | 1.25mi |
Listing history 9 events
-
2026-06-18days on market $750,000 Active 13 DOM
-
2026-06-17days on market $750,000 Active 12 DOM
-
2026-06-16days on market $750,000 Active 11 DOM
-
2026-06-15days on market $750,000 Active 10 DOM
-
2026-06-13days on market $750,000 Active 8 DOM
-
2026-06-09days on market $750,000 Active 4 DOM
-
2026-06-08days on market $750,000 Active 3 DOM
-
2026-06-07remarks 690-char remark
-
2026-06-07$750,000 Active 2 DOM
ⓘ Source: listings_history table (triggers on properties + properties_extension) + one-shot
backfill from property_details.listing_events for pre-trigger history.
Climate risk First Street
- Flood 7/10 Severe FEMA zone AE · 78% chance over 30 yrs
- Wildfire 1/10 Low
- Heat 10/10 Extreme 7 d/yr ≥104°F today · 27 d/yr by 30 yrs out
- Wind 10/10 Extreme 99% chance of damaging wind over 30 yrs
- Air quality 2/10 Low 1 unhealthy d/yr today · 2 by 30 yrs out
Nearby sold comps map
Loading sold comps map…
Walkable amenities ~0.75 mi
Loading nearby amenities…
Taxation est. · year 1
- Rental income
- $100,920
- − Mortgage interest
- −$42,012
- − Property taxes
- −$11,250
- − Insurance
- −$8,868
- − Repairs & maintenance
- −$8,074
- − Management
- −$8,074
- − Depreciation
- −$21,818
- Taxable income
- $824
- Est. tax owed @ 24.0%
- −$198
- After-tax cash flow
- $12,213/yr
For passive investors: Depreciation is non-cash, so a rental often shows a tax loss while cash-flowing — sheltering income. Rental losses are passive: they offset passive income freely, and up to $25,000/yr can offset ordinary (W-2) income if you actively participate and your MAGI is under $100k (phasing out to $0 by $150k); unused losses carry forward. On sale, claimed depreciation is recaptured at up to 25%, and gains may owe capital-gains tax (a 1031 exchange can defer both). Figures are a year-1 estimate at your 24.0% rate — not tax advice; consult a CPA.
Condition & rehab AI · 13 photos
This well-maintained, updated duplex is move-in ready with good condition and strong rental appeal.
Value-add opportunities
- Both Painting the exterior and interior walls — Fresh paint enhances curb appeal and interior aesthetics.
- Resale Upgrading the kitchen appliances — Modern appliances improve the home's appeal to potential buyers.
- Rental Landscaping improvements — A well-maintained yard enhances curb appeal and tenant satisfaction.
Renovation cost estimate screening
Value-add ROI direction
- Both Painting the exterior and interior walls — Fresh paint enhances curb appeal and interior aesthetics. ↑
- Resale Upgrading the kitchen appliances — Modern appliances improve the home's appeal to potential buyers. ↑
- Rental Landscaping improvements — A well-maintained yard enhances curb appeal and tenant satisfaction. ↑
ⓘ Cost ranges are severity-bucket heuristics (US national rule-of-thumb). Get contractor quotes + a written scope before underwriting a rehab budget.
Schools (NCES district)
- District
- Broward
- NCES district ID
- 1200180
- Math proficiency
- 42% ▼ -18.00%
- Reading proficiency
- 53% ▼ -5.00%
- Median HH income
- $52,139
- Composite
- 40.88/100
- National rank
- #3621
- State rank
- #46 of 73 in FL
Livability — Hallandale Beach
- Score
- 81/100
- State rank
- #86
- US rank
- #1400
Category grades
Schools grade is shown separately in the Schools card above.
Census & demographics
- Census place
- Hallandale Beach, FL
- County
- Broward County · 1,963,430 people
- City population
- 44,021
- Metro
- Miami-Fort Lauderdale-Pompano Beach, FL
- Population (ZIP)
- 44,502
- Household income
- $52,079
- Rent vs Own
- Severe rent burden
- 3293.0
Population outlook (Broward County) Hauer SSP2
- Today (2025)
- 2,207,033 people
- By 2030
- 2,360,704 · +7.0%
- By 2040
- 2,661,208 · +20.6%
- By 2050
- 2,946,698 · +33.5%
- By 2075
- 3,602,273 · +63.2%
- By 2100
- 3,970,984 · +79.9%
Race, ethnicity, and origin ACS 2023
- Neighborhood character
- Diverse neighborhood (Simpson 0.67)
- Race & ethnicity
- Hispanic / Latino 39% White 39% Two or more races 24% Black 17% Asian 1%
- Hispanic origin (detail)
- Mexican 2% Puerto Rican 3% Cuban 9% Dominican 3% Salvadoran 2%
- Common ancestry
- Scotch-Irish 5% Hispanic 5% Subsaharan African 3%
- Foreign-born
- 51% · Canada, Jamaica, Dominican Republic
- Languages at home
- 38% English-only · Spanish 36% Russian/Polish/Slavic 12% French/Haitian/Cajun 7%
Political lean MEDSL · Broward
- 2024 margin
- D (+17.0) · D 58.0% · R 41.0%
- 2008→2024 swing
- -17.8pp toward R · 2008: 34.7pp · 2024: 17.0pp
- All cycles
- 2024: D+17.0 2020: D+29.8 2016: D+35.0 2012: D+34.9 2008: D+34.7
Not yet ingested
- Civics
- —
Market trends
- HPI YoY
- ▼ -299.13%
- Current HPI
- 329.9081
- Rent YoY
- ▲ 0.43%
- Metro
- Miami-Fort Lauderdale-Pompano Beach, FL
- State GDP YoY
- ▲ 3.28%
- F500 in state
- 36
Industry mix (Fortune 500 HQ in FL)
| Industry | F500 HQs | Revenue |
|---|---|---|
| Industrial Technology | 2 | $29B |
|
||
| Insurance | 2 | $17B |
|
||
| Retail | 1 | $60B |
|
||
| Technology Distribution | 1 | $58B |
|
||
| Homebuilding | 1 | $35B |
|
||
| Technology Manufacturing | 1 | $35B |
|
||
Price history
+31150.0% since first listed4 events — show timeline
- 2026-06-05 Listed $750,000 MARMLS
- 2023-11-15 Rental Removed $2,200 APPFOLIO
- 2023-11-10 Price Changed $2,200 APPFOLIO
- 2023-10-08 Listed for Rent $2,400 APPFOLIO
Cash-flow waterfall
monthlySold comps — $/sqft
last 12 mo · ≤1 miLoading sold comps…