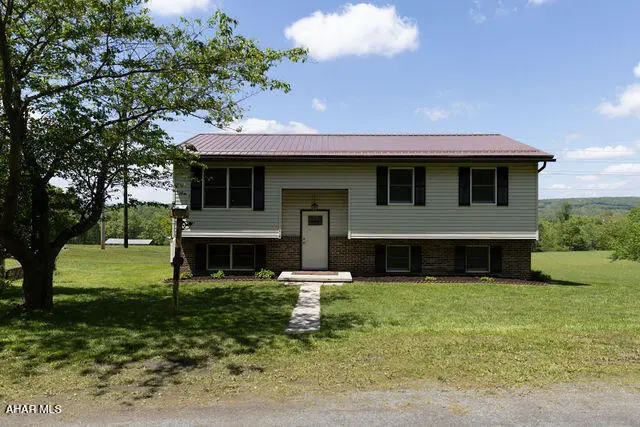
148 Pointer St · Mundys Corner, PA
Flood risk 1/10 · Minimal
- FEMA flood zone
- X (unshaded)
- Chance of flooding over 30 yrs
- 0.0%
- Est. flood insurance / yr
- $473 – $860
Fire risk 1/10 · Minimal
- Est. fire insurance / yr
- $511 – $949
Heat risk 2/10 · Minimal
- Hot days now (above 91°F)
- 7 days/yr
- Hot days in 30 yrs
- 17 days/yr
Wind risk 2/10 · Minimal
- Chance of severe wind over 30 yrs
- —
Air-quality risk 3/10 · Minor
- Unhealthy air days now
- 2 days/yr
- Unhealthy air days in 30 yrs
- 4 days/yr
Risk factors via First Street. Map © Google.
Why this score? — see what drove the D grade
The composite is a weighted blend of 9 inputs, each scored 0–100. Each bar is that input's sub-score; the figure is the points it added to the 100-point composite (weight × sub-score).
- Appreciation +10.0/10.0
- Cash flow +7.8/30.0
- ARV discount +7.5/15.0
- Schools +4.1/10.0
- Livability +3.5/5.0
- Rent growth +2.5/5.0
- Condition / age +2.5/5.0
- DSCR +1.8/10.0
- 1% rule +1.7/10.0
$210,000
🖨 Deal sheet (PDF) 📄 Offer letter ✓ Due diligence
Listing remarks
The well-maintained home offers 4 bedrooms plus a versatile bonus room that could serve as a 5th bedroom, home office, or extra storage space. The inviting family room features a stunning floor-to-ceiling stone fireplace with propane insert, creating the perfect cozy gathering space. Outside, enjoy 1.2 acres of yard space with plenty of room to relax, entertain, or play, along with a 2-car garage for added convenience. (Please NO drive-bys. Showings by appointment only. )
Key facts
- Versatile bonus room
- 1.2 acre lot
- 2 garage spots
Tags
Property features AI
Exterior
- Parking: Detached garage with garage door opener; 2-car garage
- Utilities: Public water
- Home design: Single-family residence; Multi/split levels; Residential property
- Construction: Vinyl siding; Metal roof
- Exterior features: Deck; Cleared lot; Shed(s)
Interior
- Kitchen: Oven; Range; Refrigerator
- Flooring: Laminate; Tile; Carpet
- Bathrooms: 2 full bathrooms
- Heating & cooling: Baseboard heating; Electric heating; Cooling system
- Interior features: Insulated windows; 2 fireplaces; Basement
Neighborhood map
What this means for you Summary
Snapshot
- This is a 4-bed/2.0-bath single-family listed at $210k.
Deal economics
- At list price, monthly cash flow is $-237 ($-3k/yr) — negative.
- To cash-flow at today's rent, offer at most $168k (20.0% below list).
- To meet the 1% rule (rent ≥ 1% of price), the offer needs to be $141k (33.1% below list).
- Recommended offer: $141k (33.1% below list) — sets the bar for 1% rule.
Location & tenants
- Location reads 70/100 on livability (#787 in PA) — a middle-class / working-renter tenant base. Strengths: crime A+, cost of living A+, housing A+; Watch: amenities F, commute F, health & safety F.
- Central Cambria SD (rural): math 40% / reading 55% proficiency, ranked #225 of 539 in PA (top 42%) — families likely to look elsewhere, expect single-tenant / working-renter base with shorter leases.
- Zoned schools: Jackson El Sch (math 37% / reading 67%, grade C-, #586 of 1,518 statewide, top 42%, 208 students, 42% FRL); Central Cambria Ms (math 27% / reading 47%, grade F, #298 of 512 statewide, top 60%, 379 students, 39% FRL); Central Cambria Hs (math 67%, 559 students, 26% FRL).
- Market conditions: 10 active listings in the ZIP; 64 units permitted in Cambria County in 2024 (0 in 5+ unit buildings).
Forward outlook
- In year one you build about $22k of equity ($1k loan paydown + $21k appreciation (10.0% local appreciation)).
- Cambria County population projected at -28% by 2050 — secular population decline; favor cash flow + early exit over multi-decade hold.
- By year 2, paydown + projected appreciation supports a ~$36k cash-out refi (75% LTV) — recoverable capital for the next deal without selling this one.
Negotiation context
- Only 4 days on market — expect competitive offers; lowballing is unlikely to land.
Questions for the listing agent
- What do current leases actually rent for vs. the listed asking? Can we see a recent rent roll and the last 12 months of T-12 income?
- Is there a deadline driving the sale (1031 exchange, divorce, estate, relocation)? That informs how much negotiation room exists.
- Schools are B-rated — typically a magnet for longer-tenancy family renters. What's the average tenant stay here, and is there a school-zone premium baked into asking?
- The area grade is low — what's the realistic commute time and amenity access for the typical tenant pool here? Any planned neighborhood developments (good or bad) we should know about?
- What's the average days-on-market for RENTAL listings here right now (not sales)? A rising rental-DOM trend means longer vacancies and softer asking-rent achievability than the comps imply.
- What's the recent tenant-quality profile in this submarket — average credit score on applications, eviction rate, late-payment / NSF rate, and stable-employment percentage? A property-management company in the area should have these aggregated.
- How much new for-sale + rental construction is in the pipeline within 1–3 miles? Heavy new supply typically softens prices + rents 12–24 months out; constrained supply supports both.
Investment metrics
- 1% rule
- 0.67% ✗
- Cap rate
- 4.94%
- Cash-on-cash
- -4.84%
- DSCR
- 0.78
- GRM
- 12.5
CMA / ARV
- ARV (on-the-fly)
- $108,160
- Comps found
- 1
Show comp detail 1 sale within ~0.75 mi
| Address | Dist | Beds/Ba | Sqft | Sold | Price | $/sf | Match |
|---|---|---|---|---|---|---|---|
| 751 Pike Rd | 0.23mi | 4/1.5 | 1,913 (-8%) | 10mo | $100,000 | $52 | 66 |
Match score weights: distance 35% · size 25% · config 20% · recency 20%. Top-matched comps best support the ARV.
Projected returns pro-forma
10.0% appreciation · 3.0% rent growth · sell at horizon
- IRR
- 20.8%
- Equity multiple
- 2.69×
- Total profit
- $99,219
- Equity at exit
- $189,185
- IRR
- 18.9%
- Equity multiple
- 6.17×
- Total profit
- $303,981
- Equity at exit
- $407,984
Cash invested: $58,800 (down + closing). Projections, not guarantees.
Landlord ↔ Tenant lean methodology
- Overall (STATE)
- 62 Landlord-Friendly
- State Pennsylvania
- 62 Landlord-Friendly · EVEN
- County
- — inherits STATE
- City
- — inherits STATE
ZIP-level market 15942
- Home prices YoY
- 7.3%
- Active inventory
- 10
- Price-to-rent
- 12.5×
Monthly cashflow live
- Estimated rent
- $1,405 medium interval (Pro) →
- Mortgage (P&I)
- −$1,101
- Tax from tax record
- −$159 /mo · $1,905/yr
- Insurance
- −$88
- HOA
- −$0
- Vacancy / Maint / Mgmt
- −$295
- Net cashflow
- $-237
Break-even live
Sensitivity live
| Price | -10% $-118 | -5% $-178 | +0% $-237 | +5% $-297 | +10% $-356 |
|---|---|---|---|---|---|
| Rent | -10% $-348 | -5% $-293 | +0% $-237 | +5% $-182 | +10% $-126 |
| Rate | -1.0pp $-131 | -0.5pp $-184 | base $-237 | +0.5pp $-292 | +1.0pp $-347 |
UW: 25.0% down · 7.5% · 30yr · 1.5% tax · 5.0% vac · 8.0% maint · 8.0% mgmt
Financing live
Cash to close
- Down payment
- $52,500
- Closing costs
- $6,300
- Reserves months
- —
- Total cash needed
- —
Loan-product check · same deal, 3 products live
Conventional
25% down · 7.5% · 30yr
- Down + closing
- —
- Monthly P&I
- —
- Monthly cashflow
- —
- DSCR
- —
- Eligible?
- —
Personal DTI + credit; lowest rate.
DSCR
20% down · 8.5% · 30yr
- Down + closing
- —
- Monthly P&I
- —
- Monthly cashflow
- —
- DSCR
- —
- Eligible?
- —
No personal income docs; deal must DSCR.
Hard money
10% down · 12.0% · 12mo
- Down + closing
- —
- Monthly P&I
- —
- Monthly cashflow
- —
- DSCR
- —
- Eligible?
- —
Short-term bridge; refi at stabilization.
Listing history 2 events
-
2026-05-23status Pending
-
2026-05-18$210,000 Active
ⓘ Source: listings_history table (triggers on properties + properties_extension) + one-shot
backfill from property_details.listing_events for pre-trigger history.
Tax reassessment forecast PA · Partial reset (capped growth)
- Current annual tax
- $1,905 · $159/mo
- Projected year-2 tax
- $2,612 · $218/mo
- Expected delta
- +$706/yr (+$59/mo · 37.1%)
ⓘ Screening estimate from a state-policy table — verify with the county assessor before closing.
Climate risk First Street
- Flood 1/10 Low FEMA zone X (unshaded) · 0% chance over 30 yrs
- Wildfire 1/10 Low
- Heat 2/10 Low 7 d/yr ≥91°F today · 17 d/yr by 30 yrs out
- Wind 2/10 Low
- Air quality 3/10 Moderate 2 unhealthy d/yr today · 4 by 30 yrs out
Nearby sold comps map
Loading sold comps map…
Walkable amenities ~0.75 mi
Loading nearby amenities…
Taxation est. · year 1
- Rental income
- $16,865
- − Mortgage interest
- −$11,763
- − Property taxes
- −$1,905
- − Insurance
- −$1,050
- − Repairs & maintenance
- −$1,349
- − Management
- −$1,349
- − Depreciation
- −$6,109
- Taxable loss
- −$6,661
- Est. tax savings @ 24.0%
- +$1,599
- After-tax cash flow
- $-1,248/yr
For passive investors: Depreciation is non-cash, so a rental often shows a tax loss while cash-flowing — sheltering income. Rental losses are passive: they offset passive income freely, and up to $25,000/yr can offset ordinary (W-2) income if you actively participate and your MAGI is under $100k (phasing out to $0 by $150k); unused losses carry forward. On sale, claimed depreciation is recaptured at up to 25%, and gains may owe capital-gains tax (a 1031 exchange can defer both). Figures are a year-1 estimate at your 24.0% rate — not tax advice; consult a CPA.
Schools (NCES district)
- District
- Central Cambria SD
- NCES district ID
- 4205340
- Math proficiency
- 40% ▼ -10.00%
- Reading proficiency
- 55% ▼ -13.00%
- Median HH income
- $50,276
- Composite
- 40.68/100
- National rank
- #3674
- State rank
- #225 of 539 in PA
Livability — Mundys Corner
- Score
- 70/100
- State rank
- #787
- US rank
- #7945
Category grades
Schools grade is shown separately in the Schools card above.
Census & demographics
- Census place
- Mundys Corner, PA
- Population (ZIP)
- 2,134
Population outlook (Cambria County) Hauer SSP2
- Today (2025)
- 122,754 people
- By 2030
- 115,827 · -5.6%
- By 2040
- 101,309 · -17.5%
- By 2050
- 88,379 · -28.0%
- By 2075
- 65,237 · -46.9%
- By 2100
- 46,909 · -61.8%
Race, ethnicity, and origin ACS 2023
- Neighborhood character
- Predominantly White (98%)
- Race & ethnicity
- White 98% Hispanic / Latino 1%
- Common ancestry
- Romanian 8% Italian 6% Iranian 4%
- Foreign-born
- 0% · South Korea
Political lean MEDSL · Cambria
- 2024 margin
- Solid R (+39.7) · D 29.8% · R 69.5%
- 2008→2024 swing
- -40.4pp toward R · 2008: 0.7pp · 2024: -39.7pp
- All cycles
- 2024: R+39.7 2020: R+37.3 2016: R+37.8 2012: R+17.8 2008: D+0.7
Not yet ingested
- Civics
- —
Market trends
- HPI YoY
- ▲ 11.02%
- Current HPI
- 161.1142
- Rent YoY
- —
- Metro
- —
- State GDP YoY
- ▲ 1.68%
- F500 in state
- 34
Industry mix (Fortune 500 HQ in PA)
| Industry | F500 HQs | Revenue |
|---|---|---|
| Healthcare | 2 | $309B |
|
||
| Insurance | 2 | $27B |
|
||
| Telecommunications / Media | 1 | $124B |
|
||
| Industrial Distribution | 1 | $22B |
|
||
| Financial Services | 1 | $20B |
|
||
| Chemicals / Materials | 1 | $18B |
|
||
Price history
2 events — show timeline
- 2026-05-23 Pending — AHARMLS
- 2026-05-18 Listed $210,000 AHARMLS
Property tax history
+1.2%/yrLatest (2026): $1,905 · +3.1% YoY. Source: county tax records.
Cash-flow waterfall
monthlySold comps — $/sqft
last 12 mo · ≤1 miLoading sold comps…