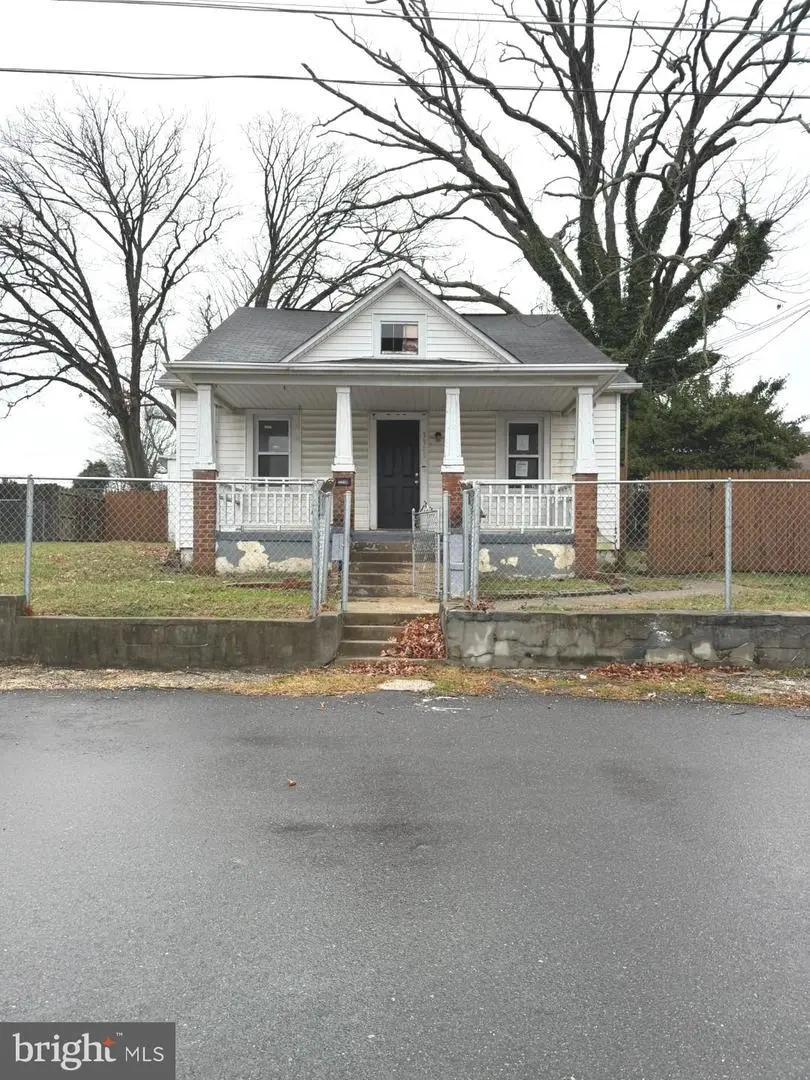
3905 Byers St · Coral Hills, MD
Flood risk 1/10 · Minimal
- FEMA flood zone
- X (unshaded)
- Chance of flooding over 30 yrs
- 0.0%
- Est. flood insurance / yr
- $507 – $1,088
Fire risk 1/10 · Minimal
- Est. fire insurance / yr
- $755 – $1,403
Heat risk 7/10 · Major
- Hot days now (above 104°F)
- 7 days/yr
- Hot days in 30 yrs
- 16 days/yr
Wind risk 4/10 · Minor
- Chance of severe wind over 30 yrs
- 20.0%
Air-quality risk 4/10 · Minor
- Unhealthy air days now
- 4 days/yr
- Unhealthy air days in 30 yrs
- 5 days/yr
Risk factors via First Street. Map © Google.
Why this score? — see what drove the B grade
The composite is a weighted blend of 9 inputs, each scored 0–100. Each bar is that input's sub-score; the figure is the points it added to the 100-point composite (weight × sub-score).
- Cash flow +28.9/30.0
- ARV discount +15.0/15.0
- DSCR +10.0/10.0
- 1% rule +8.0/10.0
- Rent growth +4.0/5.0
- Livability +3.3/5.0
- Condition / age +2.5/5.0
- Schools +1.7/10.0
- Appreciation +0.0/10.0
$240,000
🖨 Deal sheet 📄 Offer letter ✓ Due diligence
Listing remarks MLS
Come and check out this very charming home just waiting for investors and home owners alike! This home offers plenty of space and a great opportunity! With a spacious living room and lots of natural lighting, separate dining area and an equally spacious kitchen. It also offers 3 bedrooms and 2 full bathrooms perfect for families! Come and take a look at this home that is just waiting for your creativity and magic touch! Just minutes from DC, RT. 4, RT. 214, and Metro. Come and schedule your showings now!
Key facts
- 6,000 sq ft lot
- Built 1915
- Listed 184 days
Neighborhood map
What this means for you Summary
Snapshot
- This is a 3-bed/1.0-bath single-family listed at $240k.
Deal economics
- At list price, monthly cash flow is $811 ($10k/yr) — positive.
- The deal already cash-flows at list — no discount required.
- Meets the 1% rule at list price ($3k rent vs $240k).
- Recommended offer: $211k (12.0% below list) — sets the bar for market timing.
- Cap rate 10.3% vs local median 5.3% in Coral Hills — top-decile yield for the area; either an underpriced asset or a hidden risk that comps aren't pricing in. Stress-test before assuming the spread holds.
Location & tenants
- Location reads 66/100 on livability (#223 in MD) — a middle-class / working-renter tenant base. Strengths: housing A+, health & safety A, employment B; Watch: schools F, crime D-, amenities F.
- Prince George'S County Public Schools (suburban): math 8% / reading 24% proficiency, ranked #21 of 24 in MD (top 88%) — low school quality limits family demand, transient renter base, plan for 1-2y turnover.
- Market conditions: Rents rising fast (+5.9%/yr); 217 active listings in the ZIP; 17 comparable units currently listed for rent nearby; rentals at typical pace (median 25d on market — plan ~3-4 weeks tenant-placement turnaround); solid renter incomes; 1,481 units permitted in Prince George's County in 2024 (0 in 5+ unit buildings).
- At $3,110/mo this rent would consume 49% of the median local household income ($76k/yr) (locally 1418% of renters already pay >50% of income on rent) — very limited rent-growth headroom before tenants either downsize or default.
Forward outlook
- Local home prices are declining (-3.0%/yr); year-one equity from $2k of loan paydown is wiped out by about $7k of value loss. Plan a longer hold.
- Prince George's County population projected at +18% by 2050 — long-run rental-demand tailwind backs the buy-and-hold thesis.
- At projected returns (-3.0% appreciation + 5.9% rent growth), your $67k cash investment doubles in ~7 years — after that, you're playing with house money.
Negotiation context
- It's been on market 184 days — a 12% lower offer ($211k) is reasonable based on typical stale-listing flexibility.
- 8 sale attempts since 27y ago; this cycle's ask has dropped $45k (16%) from the opening price — seller is motivated, your offer sets the floor, not the list.
- Current owner paid $180k; 33% above their basis — modest negotiation headroom, anchor on the comps not their cost.
Risks & watch-outs
- Watch-outs: built in 1915 — expect roof / HVAC / electrical / plumbing capex.
- Climate carrying-cost: extreme-heat days projected 7→16/yr by 2055 (HVAC capex compounding) — expect insurance premiums to compound above CPI over the hold.
Questions for the listing agent
- It's been on market 184 days. Have you received any prior offers? Is the seller open to a 12% concession, seller financing, or rate buy-down credit?
- Built in 1915 — when were the roof, HVAC, electrical panel, plumbing, and water heater last replaced?
- Why hasn't it sold? Are there any deal-killer items the seller is aware of (foundation, flood, title, zoning, code violations)?
- Is there a deadline driving the sale (1031 exchange, divorce, estate, relocation)? That informs how much negotiation room exists.
- Schools are F-rated, which usually means shorter tenancies and higher turnover. Who's the typical renter profile here, and what's been the actual vacancy rate?
- Crime grade is D in this area — have there been break-ins, vandalism, or insurance claims at this property in the last 3 years? What carrier currently insures it and at what premium?
- What's the average days-on-market for RENTAL listings here right now (not sales)? A rising rental-DOM trend means longer vacancies and softer asking-rent achievability than the comps imply.
- What's the recent tenant-quality profile in this submarket — average credit score on applications, eviction rate, late-payment / NSF rate, and stable-employment percentage? A property-management company in the area should have these aggregated.
- How much new for-sale + rental construction is in the pipeline within 1–3 miles? Heavy new supply typically softens prices + rents 12–24 months out; constrained supply supports both.
Investment metrics
- 1% rule
- 1.30% ✓
- Cap rate
- 10.35%
- Cash-on-cash
- 14.48%
- DSCR
- 1.64
- GRM
- 6.4
CMA / ARV
- ARV (median comp)
- $382,838
- List price
- $240,000
- Delta
- -37.31%
- Verdict
- UNDERPRICED
- Comps
- 20 within 1.0 mi
Show comp detail 12 sales within ~0.75 mi
| Address | Dist | Beds/Ba | Sqft | Sold | Price | $/sf | Match |
|---|---|---|---|---|---|---|---|
| 4201 Torque St | 0.24mi | 4/2.0 (+1) | 2,146 (+7%) | 2mo | $435,000 | $203 | 66 |
| 1405 42nd St SE | 0.19mi | 4/2.0 (+1) | 1,824 (-9%) | 4mo | $440,000 | $241 | 64 |
| 1108 Chaplin St SE | 0.61mi | 3/2.0 | 2,004 (+0%) | 5mo | $272,125 | $136 | 63 |
| 3918 Alton St | 0.08mi | 3/2.5 | 1,716 (-14%) | 11mo | $380,000 | $221 | 58 |
| 4553 Alabama Ave SE | 0.66mi | 3/1.0 | 1,926 (-4%) | 8mo | $345,000 | $179 | 57 |
| 4376 Southern Ave SE | 0.33mi | 3/2.0 | 2,292 (+15%) | 1mo | $415,000 | $181 | 56 |
| 4112 Ellis St | 0.29mi | 4/2.0 (+1) | 1,848 (-8%) | 11mo | $386,875 | $209 | 56 |
| 1794 41st Pl SE | 0.32mi | 3/2.5 | 1,728 (-14%) | 8mo | $599,900 | $347 | 50 |
| 1821 41st Pl SE | 0.37mi | 4/2.0 (+1) | 1,782 (-11%) | 8mo | $550,000 | $309 | 49 |
| 1807 Porter | 0.65mi | 3/1.5 | 1,802 (-10%) | 11mo | $356,250 | $198 | 42 |
| 1805 Campbell Dr | 0.69mi | 4/2.0 (+1) | 1,802 (-10%) | 5mo | $335,000 | $186 | 38 |
| 1127 45th Pl SE | 0.63mi | 4/2.0 (+1) | 1,776 (-11%) | 10mo | $332,000 | $187 | 34 |
Match score weights: distance 35% · size 25% · config 20% · recency 20%. Top-matched comps best support the ARV.
Projected returns pro-forma
-3.0% appreciation · 5.9% rent growth · sell at horizon
- IRR
- 8.1%
- Equity multiple
- 1.33×
- Total profit
- $22,116
- Equity at exit
- $35,785
- IRR
- 19.7%
- Equity multiple
- 2.88×
- Total profit
- $126,572
- Equity at exit
- $20,751
Cash invested: $67,200 (down + closing). Projections, not guarantees.
Landlord ↔ Tenant lean methodology
- Overall (STATE)
- 27 Tenant-Leaning
- State Maryland
- 27 Tenant-Leaning · D+14
- County
- — inherits STATE
- City
- — inherits STATE
ZIP-level market 20743
- Rents YoY
- 5.9%
- Active inventory
- 217
- Price-to-rent
- 6.4×
Monthly cashflow live
- Estimated rent
- $3,110 high interval (Pro) →
- Mortgage (P&I)
- −$1,259
- Tax from tax record
- −$288 /mo · $3,456/yr
- Insurance
- −$100
- HOA
- −$0
- Vacancy / Maint / Mgmt
- −$653
- Net cashflow
- $811
Break-even live
UW: 25.0% down · 7.5% · 30yr · 1.5% tax · 5.0% vac · 8.0% maint · 8.0% mgmt
Financing live
Cash to close
- Down payment
- $60,000
- Closing costs
- $7,200
- Reserves months
- —
- Total cash needed
- —
Loan-product check · same deal, 3 products live
Conventional
25% down · 7.5% · 30yr
- Down + closing
- —
- Monthly P&I
- —
- Monthly cashflow
- —
- DSCR
- —
- Eligible?
- —
Personal DTI + credit; lowest rate.
DSCR
20% down · 8.5% · 30yr
- Down + closing
- —
- Monthly P&I
- —
- Monthly cashflow
- —
- DSCR
- —
- Eligible?
- —
No personal income docs; deal must DSCR.
Hard money
10% down · 12.0% · 12mo
- Down + closing
- —
- Monthly P&I
- —
- Monthly cashflow
- —
- DSCR
- —
- Eligible?
- —
Short-term bridge; refi at stabilization.
Rent comps 17 comps
| Address | Beds | Baths | Sqft | Rent | $/sqft | DOM | Units | Dist |
|---|---|---|---|---|---|---|---|---|
| 2204 Gaylord Dr Suitland, MD | 3.0 | 2.0 | 2016 | $2,589 | $1.28 | 19d | 1 | 0.69mi |
| 813 Hilltop Ter SE Washington, DC | 3.0 | 1.5 | 1660 | $4,500 | $2.71 | 7d | 1 | 0.72mi |
| 1205 Mentor Ave Capitol Heights, MD | 3.0 | 1.0 | 1400 | $3,000 | $2.14 | 44d | 1 | 1.01mi |
| 5126 Call Pl SE Washington, DC | 2.0 | 1.5 | 1741 | $3,050 | $1.75 | 24d | 1 | 1.23mi |
| 5115 Bass Pl SE Washington, DC | 3.0 | 2.5 | 2000 | $2,950 | $1.48 | 20d | 1 | 1.29mi |
| 5115 Bass Pl SE Washington, DC | 3.0 | 2.5 | 2832 | $2,900 | $1.02 | 24d | 1 | 1.29mi |
| 330 37th St SE Unit T2 Washington, DC | 4.0 | 2.0 | 1400 | $3,300 | $2.36 | 24d | 1 | 1.29mi |
| 4702 Towne Park Rd Suitland, MD | 4.0 | 3.5 | 2581 | $3,500 | $1.36 | 13d | 1 | 1.35mi |
| 3128 Lyndale Pl SE Washington, DC | 3.0 | 2.0 | 1552 | $2,800 | $1.80 | 19d | 1 | 1.35mi |
| 2818 Arts Vista Blvd Suitland, MD | 4.0 | 4.5 | 2078 | $3,550 | $1.71 | 44d | 1 | 1.37mi |
| 2612 33rd St SE Washington, DC | 3.0 | 3.0 | 1826 | $3,529 | $1.93 | 24d | 1 | 1.37mi |
| 5020 Astor Pl SE Apt 3 Washington, DC | 2.0 | 1.0 | 1600 | $2,250 | $1.41 | 24d | 1 | 1.37mi |
| 2831 Toles Park Dr Suitland, MD | 4.0 | 3.0 | 2078 | $3,200 | $1.54 | 20d | 1 | 1.38mi |
| 2715 Evansgreen Dr Suitland, MD | 4.0 | 3.5 | 2064 | $3,800 | $1.84 | 44d | 1 | 1.38mi |
| 3010 V Pl SE Washington, DC | 4.0 | 3.0 | 2232 | $3,500 | $1.57 | 24d | 1 | 1.39mi |
| 3013 Nelson Pl SE Washington, DC | 2.0 | 2.0 | 2800 | $3,000 | $1.07 | 24d | 1 | 1.42mi |
| 5404 Vergo Rd Capitol Heights, MD | 4.0 | 2.5 | 1680 | $3,500 | $2.08 | 44d | 1 | 1.48mi |
Listing history 48 events
-
2026-06-18days on market $240,000 Active 184 DOM
-
2026-06-17days on market $240,000 Active 183 DOM
-
2026-06-16days on market $240,000 Active 182 DOM
-
2026-06-15days on market $240,000 Active 181 DOM
-
2026-06-13pricedays on market $240,000 Active 179 DOM
-
2026-06-10days on market $260,000 Active 175 DOM
-
2026-06-08days on market $260,000 Active 174 DOM
-
2026-06-07days on market $260,000 Active 173 DOM
-
2026-06-04days on market $260,000 Active 170 DOM
-
2026-06-03days on market $260,000 Active 169 DOM
-
2026-06-02days on market $260,000 Active 168 DOM
-
2026-06-01days on market $260,000 Active 167 DOM
-
2026-05-31days on market $260,000 Active 166 DOM
-
2026-03-23price $260,000 509-char remark
Show marketing remark (509 chars)
Come and check out this very charming home just waiting for investors and home owners alike! This home offers plenty of space and a great opportunity! With a spacious living room and lots of natural lighting, separate dining area and an equally spacious kitchen. It also offers 3 bedrooms and 2 full bathrooms perfect for families! Come and take a look at this home that is just waiting for your creativity and magic touch! Just minutes from DC, RT. 4, RT. 214, and Metro. Come and schedule your showings now!
-
2026-02-12price $275,000 509-char remark
Show marketing remark (509 chars)
Come and check out this very charming home just waiting for investors and home owners alike! This home offers plenty of space and a great opportunity! With a spacious living room and lots of natural lighting, separate dining area and an equally spacious kitchen. It also offers 3 bedrooms and 2 full bathrooms perfect for families! Come and take a look at this home that is just waiting for your creativity and magic touch! Just minutes from DC, RT. 4, RT. 214, and Metro. Come and schedule your showings now!
-
2025-12-16$285,000 Active 509-char remark
Show marketing remark (509 chars)
Come and check out this very charming home just waiting for investors and home owners alike! This home offers plenty of space and a great opportunity! With a spacious living room and lots of natural lighting, separate dining area and an equally spacious kitchen. It also offers 3 bedrooms and 2 full bathrooms perfect for families! Come and take a look at this home that is just waiting for your creativity and magic touch! Just minutes from DC, RT. 4, RT. 214, and Metro. Come and schedule your showings now!
-
2010-06-01historical Expired
-
2010-06-01historical
-
2010-04-27soldstatus $180,000
-
2010-03-26price
-
2010-03-02price
-
2009-11-28Active
-
2009-11-27$195,000
-
2009-03-20soldstatus $60,000 Sold
-
2009-02-19historical
-
2009-01-29status
-
2009-01-27historical
-
2009-01-26price $69,900
-
2009-01-17$79,900
-
2009-01-16historical
-
2008-12-16price
-
2008-12-16price
-
2008-11-07price
-
2008-09-30price
-
2008-08-25price
-
2008-07-24
-
2008-05-17historical
-
2008-05-01price
-
2008-04-18
-
2006-10-11soldstatus $279,999
-
2006-08-28soldstatus $162,500
-
2005-08-02soldstatus $240,000
-
2002-02-26soldstatus $150,000
-
2000-10-25soldstatus $110,000
-
1999-11-19soldstatus $62,000
-
1999-10-29soldstatus $62,000
-
1999-10-13historical
-
1999-03-07$69,900
ⓘ Source: listings_history table (triggers on properties + properties_extension) + one-shot
backfill from property_details.listing_events for pre-trigger history.
Tax reassessment forecast MD · Partial reset (capped growth)
- Current annual tax
- $3,456 · $288/mo
- Projected year-2 tax
- $3,456 · $288/mo
- Expected delta
- $0/yr ($0/mo · 0.0%)
ⓘ Screening estimate from a state-policy table — verify with the county assessor before closing.
Climate risk First Street
- Flood 1/10 Low FEMA zone X (unshaded) · 0% chance over 30 yrs
- Wildfire 1/10 Low
- Heat 7/10 Severe 7 d/yr ≥104°F today · 16 d/yr by 30 yrs out
- Wind 4/10 Moderate 20% chance of damaging wind over 30 yrs
- Air quality 4/10 Moderate 4 unhealthy d/yr today · 5 by 30 yrs out
Nearby sold comps map
Loading sold comps map…
Walkable amenities ~0.75 mi
Loading nearby amenities…
Taxation est. · year 1
- Rental income
- $37,324
- − Mortgage interest
- −$13,444
- − Property taxes
- −$3,456
- − Insurance
- −$1,200
- − Repairs & maintenance
- −$2,986
- − Management
- −$2,986
- − Depreciation
- −$6,982
- Taxable income
- $6,271
- Est. tax owed @ 24.0%
- −$1,505
- After-tax cash flow
- $8,222/yr
For passive investors: Depreciation is non-cash, so a rental often shows a tax loss while cash-flowing — sheltering income. Rental losses are passive: they offset passive income freely, and up to $25,000/yr can offset ordinary (W-2) income if you actively participate and your MAGI is under $100k (phasing out to $0 by $150k); unused losses carry forward. On sale, claimed depreciation is recaptured at up to 25%, and gains may owe capital-gains tax (a 1031 exchange can defer both). Figures are a year-1 estimate at your 24.0% rate — not tax advice; consult a CPA.
Schools (NCES district)
- District
- Prince George'S County Public Schools
- NCES district ID
- 2400510
- Math proficiency
- 8% ▼ -11.00%
- Reading proficiency
- 24% ▼ -9.00%
- Median HH income
- $73,967
- Composite
- 16.82/100
- National rank
- #9151
- State rank
- #21 of 24 in MD
Livability — Coral Hills
- Score
- 66/100
- State rank
- #223
- US rank
- #11223
Category grades
Schools grade is shown separately in the Schools card above.
Census & demographics
- Census place
- Coral Hills, MD
- County
- Prince Georges County · 919,866 people
- Metro
- Washington-Arlington-Alexandria, DC-VA-MD-WV
- Population (ZIP)
- 41,093
- Household income
- $76,466
- Rent vs Own
- Severe rent burden
- 1418.0
Population outlook (Prince George's County) Hauer SSP2
- Today (2025)
- 1,005,426 people
- By 2030
- 1,048,416 · +4.3%
- By 2040
- 1,123,425 · +11.7%
- By 2050
- 1,183,220 · +17.7%
- By 2075
- 1,306,202 · +29.9%
- By 2100
- 1,408,179 · +40.1%
Race, ethnicity, and origin ACS 2023
- Neighborhood character
- Predominantly Black (78%)
- Race & ethnicity
- Black 78% Hispanic / Latino 16% Two or more races 4% White 3% Asian 1%
- Hispanic origin (detail)
- Mexican 2% Puerto Rican 2%
- Foreign-born
- 16% · Canada
- Languages at home
- 81% English-only · Spanish 13% French/Haitian/Cajun 1%
Political lean MEDSL · Prince George's
- 2024 margin
- Solid D (+75.2) · D 86.3% · R 11.2% · Other 2.5%
- 2008→2024 swing
- -3.3pp toward R · 2008: 78.5pp · 2024: 75.2pp
- All cycles
- 2024: D+75.2 2020: D+80.5 2016: D+81.0 2012: D+80.9 2008: D+78.5
Not yet ingested
- Civics
- —
Market trends
- HPI YoY
- ▼ -311.97%
- Current HPI
- 335.5152
- Rent YoY
- ▲ 5.90%
- Metro
- Washington-Arlington-Alexandria, DC-VA-MD-WV
- State GDP YoY
- ▲ 2.97%
- F500 in state
- 12
Industry mix (Fortune 500 HQ in MD)
| Industry | F500 HQs | Revenue |
|---|---|---|
| Aerospace / Defense | 1 | $71B |
|
||
| Utilities | 1 | $25B |
|
||
| Hotels | 1 | $24B |
|
||
| Consumer Goods | 1 | $7B |
|
||
| Real Estate | 1 | $6B |
|
||
| Chemicals | 1 | $2B |
|
||
Price history
+272.0% since first listed35 events — show timeline
- 2026-03-23 Price Changed $260,000 BRIGHT MLS
- 2026-02-12 Price Changed $275,000 BRIGHT MLS
- 2025-12-16 Listed $285,000 BRIGHT MLS
- 2010-06-01 Delisted — MRIS
- 2010-06-01 Listing Removed — BRIGHT MLS
- 2010-04-27 Sold (Public Records) $180,000 Public Records
- 2010-03-26 Price Changed — MRIS
- 2010-03-02 Price Changed — MRIS
- 2009-11-28 Listed — MRIS
- 2009-11-27 Listed $195,000 BRIGHT MLS
- 2009-03-20 Sold (MLS) $60,000 MRIS
- 2009-02-19 Delisted — MRIS
- 2009-01-29 Relisted — MRIS
- 2009-01-27 Delisted — MRIS
- 2009-01-26 Price Changed $69,900 MRIS
- 2009-01-17 Listed $79,900 MRIS
- 2009-01-16 Delisted — MRIS
- 2008-12-16 Price Changed — MRIS
- 2008-12-16 Price Changed — MRIS
- 2008-11-07 Price Changed — MRIS
- 2008-09-30 Price Changed — MRIS
- 2008-08-25 Price Changed — MRIS
- 2008-07-24 Listed — MRIS
- 2008-05-17 Delisted — MRIS
- 2008-05-01 Price Changed — MRIS
- 2008-04-18 Listed — MRIS
- 2006-10-11 Sold (Public Records) $279,999 Public Records
- 2006-08-28 Sold (Public Records) $162,500 Public Records
- 2005-08-02 Sold (Public Records) $240,000 Public Records
- 2002-02-26 Sold (Public Records) $150,000 Public Records
- 2000-10-25 Sold (Public Records) $110,000 Public Records
- 1999-11-19 Sold (Public Records) $62,000 Public Records
- 1999-10-29 Sold (MLS) $62,000 MRIS
- 1999-10-13 Delisted — MRIS
- 1999-03-07 Listed $69,900 MRIS
Property tax history
+2.6%/yrLatest (2025): $3,456 · +5.4% YoY. Source: county tax records.
Cash-flow waterfall
monthlySold comps — $/sqft
last 12 mo · ≤1 miLoading sold comps…