7960 US Highway 277 S · Abilene, TX
Flood risk 1/10 · Minimal
- FEMA flood zone
- X (unshaded)
- Chance of flooding over 30 yrs
- 0.0%
- Est. flood insurance / yr
- $507 – $1,088
Fire risk 8/10 · Major
- Est. fire insurance / yr
- $1,222 – $2,270
Heat risk 6/10 · Moderate
- Hot days now (above 105°F)
- 7 days/yr
- Hot days in 30 yrs
- 23 days/yr
Wind risk 4/10 · Minor
- Chance of severe wind over 30 yrs
- 18.0%
Air-quality risk 1/10 · Minimal
- Unhealthy air days now
- 0 days/yr
- Unhealthy air days in 30 yrs
- 0 days/yr
Risk factors via First Street. Map © Google.
Why this score? — see what drove the C grade
The composite is a weighted blend of 9 inputs, each scored 0–100. Each bar is that input's sub-score; the figure is the points it added to the 100-point composite (weight × sub-score).
- Cash flow +19.5/30.0
- ARV discount +7.5/15.0
- DSCR +6.2/10.0
- Schools +5.6/10.0
- 1% rule +5.2/10.0
- Rent growth +5.0/5.0
- Livability +3.8/5.0
- Condition / age +2.5/5.0
- Appreciation +0.0/10.0
$225,000
🖨 Deal sheet 📄 Offer letter ✓ Due diligence
Listing remarks
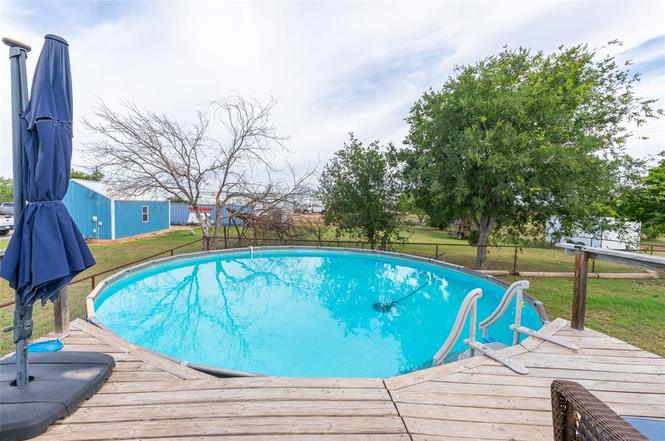
Looking for acreage close to town? This is the one! Affordable and minutes from Dyess, AI Facility and South Abilene, this home has the potential to be the country home and acreage you've been looking for. Split floor plan with two recently renovated and updated bathrooms make privacy a priority for everyone. The large kitchen and island make prep work and cooking a breeze while enjoying the view to back part of the property. Outside you will find a fun deck, pool and family friendly entertaining area set up and ready for weekends of family get togethers. If you have horses, chickens, a few cows or some goats this property will be ideal for them. Plenty of space to have your own garden and
Key facts
- Large kitchen
- Fun deck
- Pool
Tags
Property features AI
Finance
- Other: Multi-parcel property; Verify flood insurance and tax details (utility easement noted); Property listed as for sale with standard listing conditions
- Financial info: Accepting cash and VA loan offers; Loan payment type listed as principal & interest; No second mortgage indicated
- HOA & community: No homeowners association
Exterior
- Parking: Covered carport parking for 2 vehicles; Driveway
- Security: No known security features
- Utilities: Electricity available; Individual water meter; Septic system; Asphalt access
- Home design: Manufactured home (residential); One story; Not attached to another property; Year built 1999; Preowned
- Construction: Siding exterior; Composition roof; Pillar/post/pier foundation
- Exterior features: Deck; RV/boat parking; Fenced backyard; Storage structure on property; Acreage lot (approximately 4.94 acres); Easements for access, utilities, and other
Interior
- Kitchen: Dishwasher; Electric range
- Bedrooms: Primary bedroom on level 1; Total of 3 bedrooms
- Flooring: Carpet; Linoleum; Tile
- Bathrooms: 2 full bathrooms
- Heating & cooling: Central heating (electric); Central air; Ceiling fan(s)
- Interior features: Built-in features; Decorative lighting; One living area; One dining area; Room count reported as 2
- Laundry & utility: Utility room with full-size washer/dryer area
Neighborhood map
What this means for you Summary
Snapshot
- This is a 3-bed/2.0-bath manufactured listed at $225k.
Deal economics
- At list price, monthly cash flow is $255 ($3k/yr) — positive.
- The deal already cash-flows at list — no discount required.
- Meets the 1% rule at list price ($2k rent vs $225k).
Location & tenants
- Location reads 75/100 on livability (#142 in TX, #4,037 nationally) — a middle-class / working-renter tenant base. Strengths: cost of living A+, housing A+, health & safety A+; Watch: crime D, commute F.
- Wylie ISD (rural): math 63% / reading 62% proficiency, ranked #32 of 826 in TX (top 4%) — acceptable for families but not a draw, mixed tenant base, ~2y average lease; only 17% free/reduced lunch — higher-income household profile.
- Zoned schools: Wylie East El (math 58% / reading 58%, grade C+, #480 of 4,322 statewide, top 11%, 789 students, 30% FRL).
- Market conditions: Rents rising fast (+40.7%/yr); 288 active listings in the ZIP; solid renter incomes; 508 units permitted in Taylor County in 2024 (0 in 5+ unit buildings).
- This rent runs 35% of the median local income ($79k/yr) — at the standard rent-burdened threshold; future hikes will face affordability resistance.
Forward outlook
- Local home prices are declining (-3.0%/yr); year-one equity from $2k of loan paydown is wiped out by about $7k of value loss. Plan a longer hold.
- Taylor County population projected at +16% by 2050 — long-run rental-demand tailwind backs the buy-and-hold thesis.
- At projected returns (-3.0% appreciation + 8.0% rent growth), your $63k cash investment doubles in ~9 years — after that, you're playing with house money.
Negotiation context
- Only 4 days on market — expect competitive offers; lowballing is unlikely to land.
Risks & watch-outs
- Climate carrying-cost: severe wildfire risk; extreme-heat days projected 7→23/yr by 2055 (HVAC capex compounding) — expect insurance premiums to compound above CPI over the hold.
Questions for the listing agent
- Is there a deadline driving the sale (1031 exchange, divorce, estate, relocation)? That informs how much negotiation room exists.
- Schools are D-rated, which usually means shorter tenancies and higher turnover. Who's the typical renter profile here, and what's been the actual vacancy rate?
- Crime grade is D in this area — have there been break-ins, vandalism, or insurance claims at this property in the last 3 years? What carrier currently insures it and at what premium?
- What's the average days-on-market for RENTAL listings here right now (not sales)? A rising rental-DOM trend means longer vacancies and softer asking-rent achievability than the comps imply.
- What's the recent tenant-quality profile in this submarket — average credit score on applications, eviction rate, late-payment / NSF rate, and stable-employment percentage? A property-management company in the area should have these aggregated.
- How much new for-sale + rental construction is in the pipeline within 1–3 miles? Heavy new supply typically softens prices + rents 12–24 months out; constrained supply supports both.
Investment metrics
- 1% rule
- 1.02% ✓
- Cap rate
- 7.66%
- Cash-on-cash
- 4.87%
- DSCR
- 1.22
- GRM
- 8.2
CMA / ARV
No comps found within radius.
Projected returns pro-forma
-3.0% appreciation · 8.0% rent growth · sell at horizon
- IRR
- -3.2%
- Equity multiple
- 0.87×
- Total profit
- $-8,042
- Equity at exit
- $33,548
- IRR
- 11.4%
- Equity multiple
- 2.10×
- Total profit
- $69,212
- Equity at exit
- $19,454
Cash invested: $63,000 (down + closing). Projections, not guarantees.
Landlord ↔ Tenant lean methodology
- Overall (STATE)
- 87 Strongly Landlord-Friendly
- State Texas
- 87 Strongly Landlord-Friendly · R+5
- County
- — inherits STATE
- City
- — inherits STATE
ZIP-level market 79606
- Rents YoY
- 40.7%
- Active inventory
- 288
- Price-to-rent
- 8.2×
Monthly cashflow live
- Estimated rent
- $2,292 medium interval (Pro) →
- Mortgage (P&I)
- −$1,180
- Tax est. 1.5%
- −$281 /mo · $3,375/yr
- Insurance
- −$94
- HOA
- −$0
- Vacancy / Maint / Mgmt
- −$481
- Net cashflow
- $255
Break-even live
UW: 25.0% down · 7.5% · 30yr · 1.5% tax · 5.0% vac · 8.0% maint · 8.0% mgmt
Financing live
Cash to close
- Down payment
- $56,250
- Closing costs
- $6,750
- Reserves months
- —
- Total cash needed
- —
Loan-product check · same deal, 3 products live
Conventional
25% down · 7.5% · 30yr
- Down + closing
- —
- Monthly P&I
- —
- Monthly cashflow
- —
- DSCR
- —
- Eligible?
- —
Personal DTI + credit; lowest rate.
DSCR
20% down · 8.5% · 30yr
- Down + closing
- —
- Monthly P&I
- —
- Monthly cashflow
- —
- DSCR
- —
- Eligible?
- —
No personal income docs; deal must DSCR.
Hard money
10% down · 12.0% · 12mo
- Down + closing
- —
- Monthly P&I
- —
- Monthly cashflow
- —
- DSCR
- —
- Eligible?
- —
Short-term bridge; refi at stabilization.
Listing history 5 events
-
2026-06-15status $225,000 Pending 4 DOM
-
2026-06-15days on market $225,000 Active 4 DOM
-
2026-06-14days on market $225,000 Active 2 DOM
-
2026-06-13remarks 699-char remark
-
2026-06-13$225,000 Active 1 DOM
ⓘ Source: listings_history table (triggers on properties + properties_extension) + one-shot
backfill from property_details.listing_events for pre-trigger history.
Climate risk First Street
- Flood 1/10 Low FEMA zone X (unshaded) · 0% chance over 30 yrs
- Wildfire 8/10 Severe
- Heat 6/10 Major 7 d/yr ≥105°F today · 23 d/yr by 30 yrs out
- Wind 4/10 Moderate 18% chance of damaging wind over 30 yrs
- Air quality 1/10 Low 0 unhealthy d/yr today · 0 by 30 yrs out
Nearby sold comps map
Loading sold comps map…
Walkable amenities ~0.75 mi
Loading nearby amenities…
Taxation est. · year 1
- Rental income
- $27,500
- − Mortgage interest
- −$12,603
- − Property taxes
- −$3,375
- − Insurance
- −$1,125
- − Repairs & maintenance
- −$2,200
- − Management
- −$2,200
- − Depreciation
- −$6,545
- Taxable loss
- −$549
- Est. tax savings @ 24.0%
- +$132
- After-tax cash flow
- $3,198/yr
For passive investors: Depreciation is non-cash, so a rental often shows a tax loss while cash-flowing — sheltering income. Rental losses are passive: they offset passive income freely, and up to $25,000/yr can offset ordinary (W-2) income if you actively participate and your MAGI is under $100k (phasing out to $0 by $150k); unused losses carry forward. On sale, claimed depreciation is recaptured at up to 25%, and gains may owe capital-gains tax (a 1031 exchange can defer both). Figures are a year-1 estimate at your 24.0% rate — not tax advice; consult a CPA.
Schools (NCES district)
- District
- Wylie ISD
- NCES district ID
- 4846500
- Math proficiency
- 63% ▼ -12.00%
- Reading proficiency
- 62% ▼ -4.00%
- Median HH income
- $78,248
- Composite
- 55.86/100
- National rank
- #1206
- State rank
- #32 of 826 in TX
Livability — Abilene
- Score
- 75/100
- State rank
- #142
- US rank
- #4037
Category grades
Schools grade is shown separately in the Schools card above.
Census & demographics
- County
- Taylor County · 136,672 people
- City population
- 136,672
- Metro
- Abilene, TX
- Population (ZIP)
- 29,182
- Household income
- $79,196
- Rent vs Own
- Severe rent burden
- 1181.0
Population outlook (Taylor County) Hauer SSP2
- Today (2025)
- 145,270 people
- By 2030
- 150,050 · +3.3%
- By 2040
- 159,417 · +9.7%
- By 2050
- 168,883 · +16.3%
- By 2075
- 194,436 · +33.8%
- By 2100
- 203,163 · +39.9%
Race, ethnicity, and origin ACS 2023
- Neighborhood character
- Predominantly White (69%)
- Race & ethnicity
- White 69% Hispanic / Latino 19% Two or more races 11% Black 6% Asian 4%
- Hispanic origin (detail)
- Mexican 14%
- Common ancestry
- Italian 4% Slovak 2% Serbian 1%
- Foreign-born
- 7% · Canada, Vietnam
- Languages at home
- 86% English-only · Spanish 10% Tagalog/Filipino 1% Other Indo-European 1%
Political lean MEDSL · Taylor
- 2024 margin
- Solid R (+49.8) · D 24.6% · R 74.4% · Other 1.0%
- 2008→2024 swing
- -4.2pp toward R · 2008: -45.6pp · 2024: -49.8pp
- All cycles
- 2024: R+49.8 2020: R+45.3 2016: R+51.1 2012: R+53.6 2008: R+45.6
Not yet ingested
- Civics
- —
Market trends
- HPI YoY
- ▼ -167.33%
- Current HPI
- 179.2555
- Rent YoY
- ▲ 40.73%
- Metro
- Abilene, TX
- State GDP YoY
- ▲ 3.95%
- F500 in state
- 110
Industry mix (Fortune 500 HQ in TX)
| Industry | F500 HQs | Revenue |
|---|---|---|
| Energy | 16 | $1,198B |
|
||
| Technology | 5 | $198B |
|
||
| Engineering / Construction | 4 | $72B |
|
||
| Energy Services | 3 | $60B |
|
||
| Utilities | 3 | $41B |
|
||
| Healthcare | 2 | $330B |
|
||
Price history
3 events — show timeline
- 2026-06-11 Listed $225,000 NTREIS
- 2011-05-19 Sold (Public Records) — Public Records
- 2004-04-08 Sold (Public Records) — Public Records
Property tax history
+3.7%/yrLatest (2025): $371 · +20.3% YoY. Source: county tax records.
Cash-flow waterfall
monthlySold comps — $/sqft
last 12 mo · ≤1 miLoading sold comps…