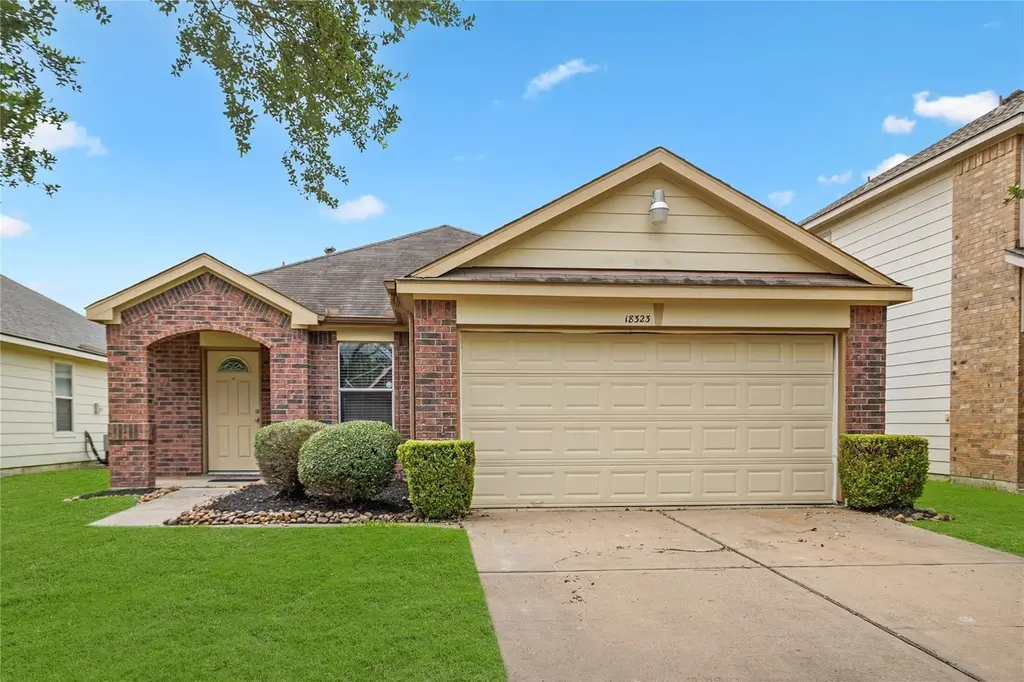
18323 Wild Orchid Dr · Houston, TX
Flood risk 1/10 · Minimal
- FEMA flood zone
- X (unshaded)
- Chance of flooding over 30 yrs
- 0.0%
- Est. flood insurance / yr
- $507 – $1,088
Fire risk 4/10 · Minor
- Est. fire insurance / yr
- $1,222 – $2,270
Heat risk 9/10 · Severe
- Hot days now (above 110°F)
- 7 days/yr
- Hot days in 30 yrs
- 23 days/yr
Wind risk 9/10 · Severe
- Chance of severe wind over 30 yrs
- 99.0%
Air-quality risk 2/10 · Minimal
- Unhealthy air days now
- 2 days/yr
- Unhealthy air days in 30 yrs
- 2 days/yr
Risk factors via First Street. Map © Google.
Why this score? — see what drove the D- grade
The composite is a weighted blend of 9 inputs, each scored 0–100. Each bar is that input's sub-score; the figure is the points it added to the 100-point composite (weight × sub-score).
- Cash flow +8.1/30.0
- Schools +5.7/10.0
- ARV discount +5.2/15.0
- Appreciation +4.3/10.0
- Livability +3.7/5.0
- 1% rule +3.0/10.0
- Condition / age +2.5/5.0
- DSCR +2.1/10.0
- Rent growth +1.8/5.0
$259,999
🖨 Deal sheet 📄 Offer letter ✓ Due diligence
Listing remarks MLS
Absolutely stunning 1 story 3 bedroom 2 bath home. Outstanding features in this home are the Hand Scraped Tanzanian Wenge Laminate floors in den & bedrooms, Corian Countertops w/ tile backsplash, 42 inch maple cabinets, black appliances, breakfast bar, separate shower/tub, tile in all wet areas, upgraded lighting/fans, faux blinds, designer accent paint & an awesome master closet custom made just for you. Lrg Pantry/Lrg utility. Nice size backyard w/ cov'd patio to enjoy those nice cool evenings
Key facts
- 5,209 sq ft lot
- 2 garage spots
- Built 2007
Neighborhood map
What this means for you Summary
Snapshot
- This is a 3-bed/2.0-bath single-family listed at $260k.
Deal economics
- At list price, monthly cash flow is $-254 ($-3k/yr) — negative.
- To cash-flow at today's rent, offer at most $215k (17.3% below list).
- To meet the 1% rule (rent ≥ 1% of price), the offer needs to be $208k (20.0% below list).
- Recommended offer: $208k (20.0% below list) — sets the bar for 1% rule.
- Cap rate 5.1% vs local median 3.2% in Houston — top-decile yield for the area; either an underpriced asset or a hidden risk that comps aren't pricing in. Stress-test before assuming the spread holds.
Location & tenants
- Location reads 74/100 on livability (#184 in TX, #4,771 nationally) — a middle-class / working-renter tenant base. Strengths: amenities A+, cost of living A+, housing A+; Watch: crime F.
- Katy ISD (suburban): math 61% / reading 63% proficiency, ranked #29 of 826 in TX (top 4%) — acceptable for families but not a draw, mixed tenant base, ~2y average lease.
- Zoned schools: Mayde Creek J H (math 41% / reading 48%, grade D, #491 of 1,662 statewide, top 31%, 1,273 students, 77% FRL); Mayde Creek H S (math 42% / reading 54%, grade D, #571 of 1,632 statewide, top 36%, 2,940 students, 78% FRL) — zoned schools average 78% FRL vs 27% district-wide (50 pts higher); higher-poverty schools than district average — tighter screening recommended.
- Zoned-school proficiency averages 46% at this address vs 62% district-wide (-16 pts) — the specific schools serving this property underperform the Katy ISD average; the district grade overstates school quality for this exact location.
- Market conditions: Rents soft (-2.9%/yr); 494 active listings in the ZIP; 18 comparable units currently listed for rent nearby; rentals leasing fast (median 10d on market — plan ~1-2 weeks tenant-placement turnaround); solid renter incomes; 29,883 units permitted in Harris County in 2024 (8,621 in 5+ unit buildings).
- This rent runs 31% of the median local income ($81k/yr) — at the standard rent-burdened threshold; future hikes will face affordability resistance.
Forward outlook
- Local home prices are declining (-1.4%/yr); year-one equity from $2k of loan paydown is wiped out by about $4k of value loss. Plan a longer hold.
- Harris County population projected at +47% by 2050 — long-run rental-demand tailwind backs the buy-and-hold thesis.
Negotiation context
- Only 14 days on market — expect competitive offers; lowballing is unlikely to land.
- 5 sale attempts since 13y ago; this cycle's ask is 12900% above the opening price — seller raised mid-cycle; expect resistance to lowballs.
Risks & watch-outs
- Climate carrying-cost: severe wind risk, 99% chance of damaging wind over 30y; extreme-heat days projected 7→23/yr by 2055 (HVAC capex compounding) — expect insurance premiums to compound above CPI over the hold.
Questions for the listing agent
- What do current leases actually rent for vs. the listed asking? Can we see a recent rent roll and the last 12 months of T-12 income?
- Is there a deadline driving the sale (1031 exchange, divorce, estate, relocation)? That informs how much negotiation room exists.
- Schools are D-rated, which usually means shorter tenancies and higher turnover. Who's the typical renter profile here, and what's been the actual vacancy rate?
- Crime grade is F in this area — have there been break-ins, vandalism, or insurance claims at this property in the last 3 years? What carrier currently insures it and at what premium?
- The area grade is low — what's the realistic commute time and amenity access for the typical tenant pool here? Any planned neighborhood developments (good or bad) we should know about?
- What's the average days-on-market for RENTAL listings here right now (not sales)? A rising rental-DOM trend means longer vacancies and softer asking-rent achievability than the comps imply.
- What's the recent tenant-quality profile in this submarket — average credit score on applications, eviction rate, late-payment / NSF rate, and stable-employment percentage? A property-management company in the area should have these aggregated.
- How much new for-sale + rental construction is in the pipeline within 1–3 miles? Heavy new supply typically softens prices + rents 12–24 months out; constrained supply supports both.
Investment metrics
- 1% rule
- 0.80% ✗
- Cap rate
- 5.12%
- Cash-on-cash
- -4.19%
- DSCR
- 0.81
- GRM
- 10.4
CMA / ARV
- ARV (on-the-fly)
- $247,187
- Comps found
- 12
Show comp detail 12 sales within ~0.75 mi
| Address | Dist | Beds/Ba | Sqft | Sold | Price | $/sf | Match |
|---|---|---|---|---|---|---|---|
| 3527 Zephyr Glen Way | 0.31mi | 3/2.0 | 1,752 (+7%) | 2mo | $249,000 | $142 | 72 |
| 18218 Wild Orchid Dr | 0.08mi | 4/2.0 (+1) | 1,764 (+8%) | 8mo | $259,900 | $147 | 72 |
| 18218 Olive Leaf Dr | 0.12mi | 3/2.0 | 1,862 (+14%) | 3mo | $259,500 | $139 | 69 |
| 3526 Cayo Hueso Ln | 0.42mi | 3/2.0 | 1,653 (+1%) | 12mo | $299,500 | $181 | 69 |
| 18214 Olive Leaf Dr | 0.13mi | 3/2.5 | 1,824 (+11%) | 6mo | $245,000 | $134 | 68 |
| 3030 Barkers Crossing Ave | 0.45mi | 3/2.0 | 1,706 (+4%) | 11mo | $270,000 | $158 | 63 |
| 18519 Espada St | 0.35mi | 3/2.0 | 1,434 (-12%) | 1mo | $285,000 | $199 | 62 |
| 3714 Siebinthaler Ln | 0.27mi | 3/2.0 | 1,847 (+13%) | 6mo | $279,000 | $151 | 61 |
| 3002 Barkers Crossing Ave | 0.50mi | 4/2.0 (+1) | 1,759 (+8%) | 0mo | $265,000 | $151 | 59 |
| 18523 Denise Dale Ln | 0.63mi | 3/2.0 | 1,457 (-11%) | 4mo | $180,000 | $124 | 50 |
| 18542 Glen Briar Ln | 0.71mi | 3/2.0 | 1,433 (-12%) | 8mo | $265,000 | $185 | 39 |
| 18723 Clover Gln | 0.69mi | 3/2.0 | 1,410 (-14%) | 9mo | $242,000 | $172 | 37 |
Match score weights: distance 35% · size 25% · config 20% · recency 20%. Top-matched comps best support the ARV.
Projected returns pro-forma
-1.4% appreciation · 0.0% rent growth · sell at horizon
- IRR
- -15.8%
- Equity multiple
- 0.36×
- Total profit
- $-46,392
- Equity at exit
- $57,850
- IRR
- -12.4%
- Equity multiple
- 0.07×
- Total profit
- $-67,919
- Equity at exit
- $56,655
Cash invested: $72,800 (down + closing). Projections, not guarantees.
Landlord ↔ Tenant lean methodology
- Overall (STATE)
- 87 Strongly Landlord-Friendly
- State Texas
- 87 Strongly Landlord-Friendly · R+5
- County
- — inherits STATE
- City
- — inherits STATE
ZIP-level market 77084
- Home prices YoY
- -0.6%
- Rents YoY
- -2.9%
- Active inventory
- 494
- Price-to-rent
- 10.4×
Monthly cashflow live
- Estimated rent
- $2,079 high interval (Pro) →
- Mortgage (P&I)
- −$1,363
- Tax from tax record
- −$425 /mo · $5,097/yr
- Insurance
- −$108
- HOA
- −$0
- Vacancy / Maint / Mgmt
- −$437
- Net cashflow
- $-254
Break-even live
UW: 25.0% down · 7.5% · 30yr · 1.5% tax · 5.0% vac · 8.0% maint · 8.0% mgmt
Financing live
Cash to close
- Down payment
- $65,000
- Closing costs
- $7,800
- Reserves months
- —
- Total cash needed
- —
Loan-product check · same deal, 3 products live
Conventional
25% down · 7.5% · 30yr
- Down + closing
- —
- Monthly P&I
- —
- Monthly cashflow
- —
- DSCR
- —
- Eligible?
- —
Personal DTI + credit; lowest rate.
DSCR
20% down · 8.5% · 30yr
- Down + closing
- —
- Monthly P&I
- —
- Monthly cashflow
- —
- DSCR
- —
- Eligible?
- —
No personal income docs; deal must DSCR.
Hard money
10% down · 12.0% · 12mo
- Down + closing
- —
- Monthly P&I
- —
- Monthly cashflow
- —
- DSCR
- —
- Eligible?
- —
Short-term bridge; refi at stabilization.
Rent comps 18 comps
| Address | Beds | Baths | Sqft | Rent | $/sqft | DOM | Units | Dist |
|---|---|---|---|---|---|---|---|---|
| 3435 Clipper Winds Way Houston, TX | 3.0 | 2.0 | 1754 | $1,799 | $1.03 | 12d | 1 | 0.17mi |
| 3331 Dale Ridge Trl Houston, TX | 4.0 | 2.5 | 2216 | $2,121 | $0.96 | 22d | 1 | 0.38mi |
| 18407 Early Green Trl Unit 1316402P Houston, TX | 3.0 | 2.0 | 1550 | $3,988 | $2.57 | 2d | 1 | 0.41mi |
| 3740 Barker Cypress Rd Houston, TX | 1.0–2.0 | 1.0–2.0 | 933 | $2,070 | $2.22 | 2d | 250 | 0.41mi |
| 2926 Barker Cypress Rd Unit 2165 Houston, TX | 2.0 | 2.0 | 1250 | $1,937 | $1.55 | 2d | 1 | 0.58mi |
| 2926 Barker Cypress Rd Unit 3165 Houston, TX | 3.0 | 2.0 | 1424 | $2,157 | $1.51 | 2d | 1 | 0.58mi |
| 2926 Barker Cypress Rd Unit 3047 Houston, TX | 3.0 | 2.0 | 1424 | $2,200 | $1.54 | 11d | 1 | 0.58mi |
| 2926 Barker Cypress Rd Unit 3174 Houston, TX | 3.0 | 2.0 | 1424 | $2,189 | $1.54 | 10d | 1 | 0.61mi |
| 2926 Barker Cypress Rd Unit 2174 Houston, TX | 2.0 | 2.0 | 1250 | $1,969 | $1.58 | 10d | 1 | 0.61mi |
| 2926 Barker Cypress Rd Unit 2959 Houston, TX | 3.0 | 2.0 | 1424 | $2,110 | $1.48 | 43d | 1 | 0.61mi |
| 2926 Barker Cypress Rd Unit 2963 Houston, TX | 2.0 | 2.0 | 1250 | $1,820 | $1.46 | 43d | 1 | 0.61mi |
| 2937 Barker Cypress Rd Houston, TX | 2.0 | 2.0 | 1138 | $1,456 | $1.28 | 43d | 1 | 0.67mi |
| 2926 Barker Cypress Rd Houston, TX | 2.0 | 2.0 | 1091 | $1,745 | $1.60 | 12d | 1 | 0.69mi |
| 2931 Barker Cypress Rd Houston, TX | 1.0–3.0 | 1.0–2.0 | 1065 | $1,796 | $1.69 | 2d | 20 | 0.75mi |
| 18747 Denise Dale Ln Houston, TX | 3.0 | 2.0 | 1136 | $1,695 | $1.49 | 5d | 1 | 0.79mi |
| 19138 Morton Rd Unit TOBC2 Houston, TX | 2.0 | 2.0 | 1091 | $1,745 | $1.60 | 2d | 1 | 0.91mi |
| 3338 Marks Rd Houston, TX | 3.0 | 2.0 | 1492 | $1,800 | $1.21 | 5d | 1 | 1.04mi |
| 19403 Misty Cove Dr Katy, TX | 4.0 | 2.0 | 1714 | $1,999 | $1.17 | 5d | 1 | 1.40mi |
Listing history 29 events
-
2026-06-18days on market $259,999 Active 14 DOM
-
2026-06-17days on market $259,999 Active 13 DOM
-
2026-06-16days on market $259,999 Active 12 DOM
-
2026-06-15days on market $259,999 Active 11 DOM
-
2026-06-13days on market $259,999 Active 9 DOM
-
2026-06-09days on market $259,999 Active 5 DOM
-
2026-06-08days on market $259,999 Active 4 DOM
-
2026-06-07statusdays on market $259,999 Active 3 DOM
-
2026-06-04days on market $259,999 Coming Soon 19 DOM
-
2026-06-03days on market $259,999 Coming Soon 18 DOM
-
2026-06-02days on market $259,999 Coming Soon 17 DOM
-
2026-06-01days on market $259,999 Coming Soon 16 DOM
-
2026-05-31days on market $259,999 Coming Soon 15 DOM
-
2026-05-16historical $259,999
-
2025-05-20historical $2,000
-
2025-05-14$2,000
-
2025-05-09historical $2,000
-
2025-04-29price $2,000
-
2025-04-12$2,200
-
2025-04-11$2,200 Active
-
2025-04-11historical
-
2024-06-20historical $1,950
-
2024-06-14price $1,950
-
2024-05-29$2,200
-
2014-01-22soldstatus
-
2014-01-21soldstatus Sold 512-char remark
Show marketing remark (512 chars)
Absolutely stunning 1 story 3 bedroom 2 bath home. Outstanding features in this home are the Hand Scraped Tanzanian Wenge Laminate floors in den & bedrooms, Corian Countertops w/ tile backsplash, 42 inch maple cabinets, black appliances, breakfast bar, separate shower/tub, tile in all wet areas, upgraded lighting/fans, faux blinds, designer accent paint & an awesome master closet custom made just for you. Lrg Pantry/Lrg utility. Nice size backyard w/ cov'd patio to enjoy those nice cool evenings
-
2014-01-03status Pending, Continue to Show 512-char remark
Show marketing remark (512 chars)
Absolutely stunning 1 story 3 bedroom 2 bath home. Outstanding features in this home are the Hand Scraped Tanzanian Wenge Laminate floors in den & bedrooms, Corian Countertops w/ tile backsplash, 42 inch maple cabinets, black appliances, breakfast bar, separate shower/tub, tile in all wet areas, upgraded lighting/fans, faux blinds, designer accent paint & an awesome master closet custom made just for you. Lrg Pantry/Lrg utility. Nice size backyard w/ cov'd patio to enjoy those nice cool evenings
-
2013-12-30status Option Pending 512-char remark
Show marketing remark (512 chars)
Absolutely stunning 1 story 3 bedroom 2 bath home. Outstanding features in this home are the Hand Scraped Tanzanian Wenge Laminate floors in den & bedrooms, Corian Countertops w/ tile backsplash, 42 inch maple cabinets, black appliances, breakfast bar, separate shower/tub, tile in all wet areas, upgraded lighting/fans, faux blinds, designer accent paint & an awesome master closet custom made just for you. Lrg Pantry/Lrg utility. Nice size backyard w/ cov'd patio to enjoy those nice cool evenings
-
2013-12-03$141,750 Active 512-char remark
Show marketing remark (512 chars)
Absolutely stunning 1 story 3 bedroom 2 bath home. Outstanding features in this home are the Hand Scraped Tanzanian Wenge Laminate floors in den & bedrooms, Corian Countertops w/ tile backsplash, 42 inch maple cabinets, black appliances, breakfast bar, separate shower/tub, tile in all wet areas, upgraded lighting/fans, faux blinds, designer accent paint & an awesome master closet custom made just for you. Lrg Pantry/Lrg utility. Nice size backyard w/ cov'd patio to enjoy those nice cool evenings
ⓘ Source: listings_history table (triggers on properties + properties_extension) + one-shot
backfill from property_details.listing_events for pre-trigger history.
Tax reassessment forecast TX · Resets to sale price
- Current annual tax
- $5,097 · $425/mo
- Projected year-2 tax
- $5,097 · $425/mo
- Expected delta
- $0/yr ($0/mo · 0.0%)
ⓘ Screening estimate from a state-policy table — verify with the county assessor before closing.
Climate risk First Street
- Flood 1/10 Low FEMA zone X (unshaded) · 0% chance over 30 yrs
- Wildfire 4/10 Moderate
- Heat 9/10 Extreme 7 d/yr ≥110°F today · 23 d/yr by 30 yrs out
- Wind 9/10 Extreme 99% chance of damaging wind over 30 yrs
- Air quality 2/10 Low 2 unhealthy d/yr today · 2 by 30 yrs out
Nearby sold comps map
Loading sold comps map…
Walkable amenities ~0.75 mi
Loading nearby amenities…
Taxation est. · year 1
- Rental income
- $24,945
- − Mortgage interest
- −$14,564
- − Property taxes
- −$5,097
- − Insurance
- −$1,300
- − Repairs & maintenance
- −$1,996
- − Management
- −$1,996
- − Depreciation
- −$7,564
- Taxable loss
- −$7,571
- Est. tax savings @ 24.0%
- +$1,817
- After-tax cash flow
- $-1,235/yr
For passive investors: Depreciation is non-cash, so a rental often shows a tax loss while cash-flowing — sheltering income. Rental losses are passive: they offset passive income freely, and up to $25,000/yr can offset ordinary (W-2) income if you actively participate and your MAGI is under $100k (phasing out to $0 by $150k); unused losses carry forward. On sale, claimed depreciation is recaptured at up to 25%, and gains may owe capital-gains tax (a 1031 exchange can defer both). Figures are a year-1 estimate at your 24.0% rate — not tax advice; consult a CPA.
Schools (NCES district)
- District
- Katy ISD
- NCES district ID
- 4825170
- Math proficiency
- 61% ▼ -7.00%
- Reading proficiency
- 63% ▼ -3.00%
- Median HH income
- $90,312
- Composite
- 56.59/100
- National rank
- #1146
- State rank
- #29 of 826 in TX
Livability — Houston
- Score
- 74/100
- State rank
- #184
- US rank
- #4771
Category grades
Schools grade is shown separately in the Schools card above.
Census & demographics
- County
- Harris County · 4,702,590 people
- City population
- 3,226,434
- Metro
- Houston-The Woodlands-Sugar Land, TX
- Population (ZIP)
- 110,217
- Household income
- $80,575
- Rent vs Own
- Severe rent burden
- 3257.0
Population outlook (Harris County) Hauer SSP2
- Today (2025)
- 5,571,493 people
- By 2030
- 6,089,821 · +9.3%
- By 2040
- 7,142,806 · +28.2%
- By 2050
- 8,185,864 · +46.9%
- By 2075
- 10,574,329 · +89.8%
- By 2100
- 12,109,958 · +117.4%
Race, ethnicity, and origin ACS 2023
- Neighborhood character
- Diverse neighborhood (Simpson 0.69)
- Race & ethnicity
- Hispanic / Latino 48% Two or more races 22% White 22% Black 16% Asian 11% Native American 2%
- Hispanic origin (detail)
- Mexican 27% Cuban 2%
- Common ancestry
- Lithuanian 1% Romanian 1% Slovak 1%
- Foreign-born
- 32% · Canada, Vietnam, Jamaica
- Languages at home
- 48% English-only · Spanish 38% Other Indo-European 5% Vietnamese 3%
Political lean MEDSL · Harris
- 2024 margin
- Lean D (+5.5) · D 52.0% · R 46.4% · Other 1.6%
- 2008→2024 swing
- +3.9pp toward D · 2008: 1.6pp · 2024: 5.5pp
- All cycles
- 2024: D+5.5 2020: D+13.3 2016: D+12.4 2012: D+0.1 2008: D+1.6
Not yet ingested
- Civics
- —
Market trends
- HPI YoY
- ▼ -1.40%
- Current HPI
- 251.8474
- Rent YoY
- ▼ -2.89%
- Metro
- Houston-The Woodlands-Sugar Land, TX
- State GDP YoY
- ▲ 3.95%
- F500 in state
- 110
Industry mix (Fortune 500 HQ in TX)
| Industry | F500 HQs | Revenue |
|---|---|---|
| Energy | 16 | $1,198B |
|
||
| Technology | 5 | $198B |
|
||
| Engineering / Construction | 4 | $72B |
|
||
| Energy Services | 3 | $60B |
|
||
| Utilities | 3 | $41B |
|
||
| Healthcare | 2 | $330B |
|
||
Price history
+83.4% since first listed16 events — show timeline
- 2026-05-16 Coming Soon $259,999 HARMLS
- 2025-05-20 Rental Removed $2,000 HARMLS
- 2025-05-14 Listed for Rent $2,000 HARMLS
- 2025-05-09 Rental Removed $2,000 HARMLS
- 2025-04-29 Price Changed $2,000 HARMLS
- 2025-04-12 Listed for Rent $2,200 HARMLS
- 2025-04-11 Listing Removed — HARMLS
- 2025-04-11 Listed $2,200 HARMLS
- 2024-06-20 Rental Removed $1,950 HARMLS
- 2024-06-14 Price Changed $1,950 HARMLS
- 2024-05-29 Listed for Rent $2,200 HARMLS
- 2014-01-22 Sold (Public Records) — Public Records
- 2014-01-21 Sold (MLS) — HARMLS
- 2014-01-03 Pending — HARMLS
- 2013-12-30 Pending — HARMLS
- 2013-12-03 Listed $141,750 HARMLS
Property tax history
+3.5%/yrLatest (2025): $5,097 · -6.5% YoY. Source: county tax records.
Cash-flow waterfall
monthlySold comps — $/sqft
last 12 mo · ≤1 miLoading sold comps…