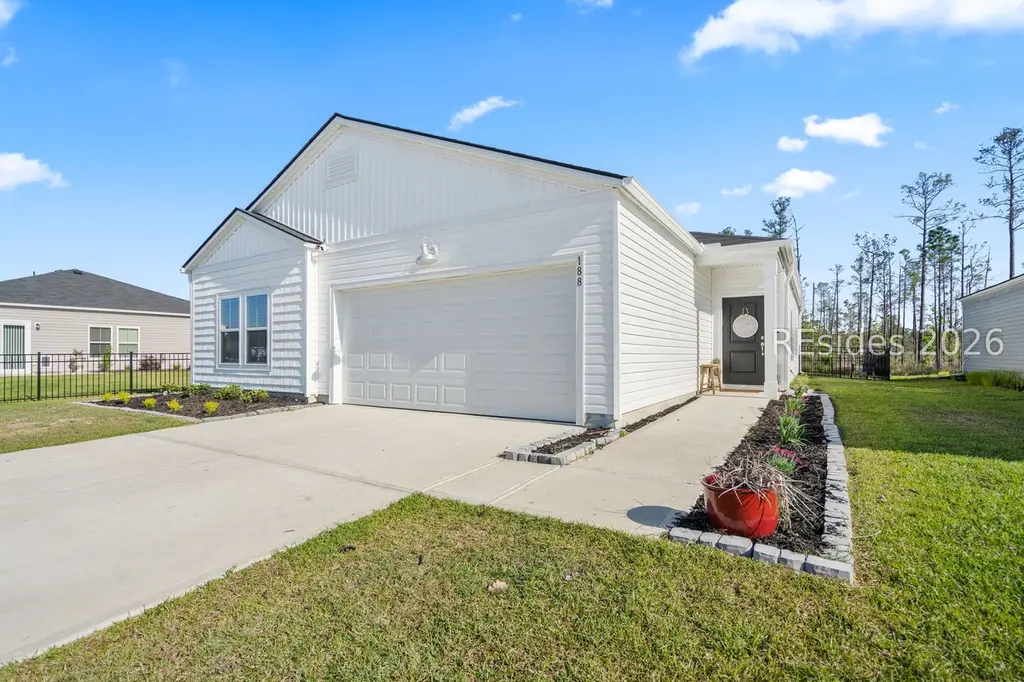
188 Red Dogwood Ln · Hardeeville, SC
Flood risk 1/10 · Minimal
- FEMA flood zone
- X (shaded)
- Chance of flooding over 30 yrs
- 0.0%
- Est. flood insurance / yr
- $507 – $1,088
Fire risk 4/10 · Minor
- Est. fire insurance / yr
- $783 – $1,453
Heat risk 9/10 · Severe
- Hot days now (above 109°F)
- 7 days/yr
- Hot days in 30 yrs
- 17 days/yr
Wind risk 8/10 · Major
- Chance of severe wind over 30 yrs
- 98.0%
Air-quality risk 2/10 · Minimal
- Unhealthy air days now
- 2 days/yr
- Unhealthy air days in 30 yrs
- 2 days/yr
Risk factors via First Street. Map © Google.
Why this score? — see what drove the F grade
The composite is a weighted blend of 9 inputs, each scored 0–100. Each bar is that input's sub-score; the figure is the points it added to the 100-point composite (weight × sub-score).
- Appreciation +10.0/10.0
- Cash flow +7.0/30.0
- ARV discount +4.2/15.0
- Livability +3.2/5.0
- 1% rule +2.7/10.0
- Condition / age +2.5/5.0
- Rent growth +2.1/5.0
- Schools +1.4/10.0
- DSCR +1.2/10.0
$365,000
🖨 Deal sheet 📄 Offer letter ✓ Due diligence
Listing remarks
Welcome tο 188 Red Dοgwoοd Ꮮane in Ηаrdeeville, SC, where easу, ѕingle-story living meets comfort and style. This thoughtfully designed home offers a functional and inviting layout, perfect for both everyday living and effortless entertaining. Step inside to an open-concept living space filled with natural light, seamlessly connecting the living room, dining area, and kitchen. The kitchen serves as the heart of the home, featuring a spacious island, ample cabinetry, and plenty of counter space, ideal for hosting or enjoying quiet nights in. The private owner's suite offers a relaxing retreat with a well-appointed ensuite bath and generous closet space. Additional
Key facts
- Spacious island
- Ample cabinetry
- Backyard space
Tags
Property features AI
Finance
- Other: Energy Star Certified Homes
- HOA & community: Community clubhouse; Community fitness center; Community playground; Community pool; Community tennis courts
Exterior
- Parking: 2-car garage; Garage
- Utilities: Public water (community/co-op); Water available
- Home design: Single-story home; Vinyl siding; Asphalt roof
- Construction: Vinyl siding construction; Asphalt roof
- Exterior features: Yard fenced; Fence; Community pool; Has view
Interior
- Kitchen: Dishwasher; Microwave; Oven; Range; Refrigerator; Pantry; Eat-in kitchen
- Flooring: Luxury vinyl plank flooring
- Bathrooms: 2 full bathrooms
- Heating & cooling: Central electric heating; Central electric cooling (central air)
- Interior features: Pull-down attic stairs; Separate shower; Eat-in kitchen; Pantry; Unfurnished
Neighborhood map
What this means for you Summary
Snapshot
- This is a 4-bed/2.0-bath single-family listed at $365k.
Deal economics
- At list price, monthly cash flow is $-540 ($-6k/yr) — negative.
- To cash-flow at today's rent, offer at most $270k (26.1% below list).
- To meet the 1% rule (rent ≥ 1% of price), the offer needs to be $281k (23.0% below list).
- Recommended offer: $270k (26.1% below list) — sets the bar for cash-flow.
- Cap rate 4.5% vs local median 3.6% in Hardeeville — meaningfully above typical; check what's discounted (condition, days-on-market, listing class) to confirm the premium yield is real.
Location & tenants
- Location reads 65/100 on livability (#136 in SC) — a middle-class / working-renter tenant base. Strengths: health & safety A+, crime B+, housing B+; Watch: schools F, amenities F, commute F.
- Jasper 01 (rural): math 12% / reading 22% proficiency, ranked #77 of 80 in SC (top 96%) — low school quality limits family demand, transient renter base, plan for 1-2y turnover; 78% free/reduced lunch — lower-income household profile, screen leases tightly.
- Market conditions: Rents soft (-1.7%/yr); 503 active listings in the ZIP; 2 comparable units currently listed for rent nearby; 1,385 units permitted in Jasper County in 2024 (0 in 5+ unit buildings).
- At $2,811/mo this rent would consume 46% of the median local household income ($73k/yr) (locally 337% of renters already pay >50% of income on rent) — very limited rent-growth headroom before tenants either downsize or default.
Forward outlook
- In year one you build about $39k of equity ($3k loan paydown + $36k appreciation (10.0% local appreciation)).
- Jasper County population projected at +46% by 2050 — long-run rental-demand tailwind backs the buy-and-hold thesis.
- By year 2, paydown + projected appreciation supports a ~$63k cash-out refi (75% LTV) — recoverable capital for the next deal without selling this one.
Negotiation context
- It's been on market 62 days — a 6% lower offer ($343k) is reasonable based on typical stale-listing flexibility.
Risks & watch-outs
- Climate carrying-cost: severe wind risk, 98% chance of damaging wind over 30y; extreme-heat days projected 7→17/yr by 2055 (HVAC capex compounding) — expect insurance premiums to compound above CPI over the hold.
Questions for the listing agent
- What do current leases actually rent for vs. the listed asking? Can we see a recent rent roll and the last 12 months of T-12 income?
- It's been on market 62 days. Have you received any prior offers? Is the seller open to a 26% concession, seller financing, or rate buy-down credit?
- Why hasn't it sold? Are there any deal-killer items the seller is aware of (foundation, flood, title, zoning, code violations)?
- Is there a deadline driving the sale (1031 exchange, divorce, estate, relocation)? That informs how much negotiation room exists.
- Schools are F-rated, which usually means shorter tenancies and higher turnover. Who's the typical renter profile here, and what's been the actual vacancy rate?
- The area grade is low — what's the realistic commute time and amenity access for the typical tenant pool here? Any planned neighborhood developments (good or bad) we should know about?
- What's the average days-on-market for RENTAL listings here right now (not sales)? A rising rental-DOM trend means longer vacancies and softer asking-rent achievability than the comps imply.
- What's the recent tenant-quality profile in this submarket — average credit score on applications, eviction rate, late-payment / NSF rate, and stable-employment percentage? A property-management company in the area should have these aggregated.
- How much new for-sale + rental construction is in the pipeline within 1–3 miles? Heavy new supply typically softens prices + rents 12–24 months out; constrained supply supports both.
Investment metrics
- 1% rule
- 0.77% ✗
- Cap rate
- 4.52%
- Cash-on-cash
- -6.33%
- DSCR
- 0.72
- GRM
- 10.8
CMA / ARV
- ARV (on-the-fly)
- $339,789
- Comps found
- 12
Show comp detail 12 sales within ~0.75 mi
| Address | Dist | Beds/Ba | Sqft | Sold | Price | $/sf | Match |
|---|---|---|---|---|---|---|---|
| 52 Red Dogwood Ln | 0.07mi | 4/2.0 | 1,779 (0%) | 1mo | $339,000 | $191 | 96 |
| 853 Sweetbay Dr | 0.23mi | 4/2.0 | 1,885 (+6%) | 0mo | $330,000 | $175 | 79 |
| 933 Sweetbay Dr | 0.22mi | 4/2.0 | 1,885 (+6%) | 1mo | $355,509 | $189 | 79 |
| 811 Sweetbay Dr | 0.23mi | 4/2.0 | 1,885 (+6%) | 2mo | $362,280 | $192 | 78 |
| 766 Crimson Pointe Dr | 0.28mi | 4/2.5 | 1,869 (+5%) | 1mo | $336,610 | $180 | 76 |
| 734 Crimson Pointe Dr | 0.27mi | 4/2.5 | 1,869 (+5%) | 2mo | $326,163 | $175 | 75 |
| 747 Crimson Pointe Dr | 0.29mi | 4/2.5 | 1,853 (+4%) | 3mo | $333,342 | $180 | 75 |
| 213 Clearwater Walk | 0.48mi | 3/2.0 (-1) | 1,750 (-2%) | 2mo | $460,000 | $263 | 68 |
| 409 Dreher Dr | 0.32mi | 4/2.5 | 1,958 (+10%) | 2mo | $360,000 | $184 | 65 |
| 438 Givhans Loop | 0.39mi | 3/2.0 (-1) | 1,622 (-9%) | 0mo | $341,284 | $210 | 62 |
| 873 Sweetbay Dr | 0.23mi | 3/2.0 (-1) | 1,520 (-15%) | 1mo | $334,944 | $220 | 59 |
| 723 Sweetbay Dr | 0.25mi | 3/2.0 (-1) | 1,520 (-15%) | 1mo | $331,952 | $218 | 58 |
Match score weights: distance 35% · size 25% · config 20% · recency 20%. Top-matched comps best support the ARV.
Projected returns pro-forma
10.0% appreciation · 0.0% rent growth · sell at horizon
- IRR
- 18.9%
- Equity multiple
- 2.53×
- Total profit
- $156,377
- Equity at exit
- $328,821
- IRR
- 16.9%
- Equity multiple
- 5.63×
- Total profit
- $473,148
- Equity at exit
- $709,115
Cash invested: $102,200 (down + closing). Projections, not guarantees.
Landlord ↔ Tenant lean methodology
- Overall (STATE)
- 90 Strongly Landlord-Friendly
- State South Carolina
- 90 Strongly Landlord-Friendly · R+6
- County
- — inherits STATE
- City
- — inherits STATE
ZIP-level market 29927
- Home prices YoY
- 18.8%
- Rents YoY
- -1.7%
- Active inventory
- 503
- Price-to-rent
- 10.8×
Monthly cashflow live
- Estimated rent
- $2,811 medium interval (Pro) →
- Mortgage (P&I)
- −$1,914
- Tax from tax record
- −$694 /mo · $8,332/yr
- Insurance
- −$152
- HOA
- −$0
- Vacancy / Maint / Mgmt
- −$590
- Net cashflow
- $-540
Break-even live
UW: 25.0% down · 7.5% · 30yr · 1.5% tax · 5.0% vac · 8.0% maint · 8.0% mgmt
Financing live
Cash to close
- Down payment
- $91,250
- Closing costs
- $10,950
- Reserves months
- —
- Total cash needed
- —
Loan-product check · same deal, 3 products live
Conventional
25% down · 7.5% · 30yr
- Down + closing
- —
- Monthly P&I
- —
- Monthly cashflow
- —
- DSCR
- —
- Eligible?
- —
Personal DTI + credit; lowest rate.
DSCR
20% down · 8.5% · 30yr
- Down + closing
- —
- Monthly P&I
- —
- Monthly cashflow
- —
- DSCR
- —
- Eligible?
- —
No personal income docs; deal must DSCR.
Hard money
10% down · 12.0% · 12mo
- Down + closing
- —
- Monthly P&I
- —
- Monthly cashflow
- —
- DSCR
- —
- Eligible?
- —
Short-term bridge; refi at stabilization.
Rent comps 2 comps
| Address | Beds | Baths | Sqft | Rent | $/sqft | DOM | Units | Dist |
|---|---|---|---|---|---|---|---|---|
| 183 Black Diamond Ln Hardeeville, SC | 4.0 | 2.5 | 2524 | $3,000 | $1.19 | 13d | 1 | 0.04mi |
| 198 Dreher Dr Hardeeville, SC | 4.0 | 3.0 | 2500 | $2,900 | $1.16 | 21d | 1 | 0.30mi |
Listing history 16 events
-
2026-06-18days on market $365,000 Active 62 DOM
-
2026-06-17days on market $365,000 Active 61 DOM
-
2026-06-16days on market $365,000 Active 60 DOM
-
2026-06-15days on market $365,000 Active 59 DOM
-
2026-06-14days on market $365,000 Active 57 DOM
-
2026-06-13days on market $365,000 Active 56 DOM
-
2026-06-10days on market $365,000 Active 54 DOM
-
2026-06-09days on market $365,000 Active 53 DOM
-
2026-06-08days on market $365,000 Active 52 DOM
-
2026-06-07days on market $365,000 Active 51 DOM
-
2026-06-03days on market $365,000 Active 47 DOM
-
2026-06-02days on market $365,000 Active 46 DOM
-
2026-06-01days on market $365,000 Active 45 DOM
-
2026-05-31days on market $365,000 Active 44 DOM
-
2026-05-30days on market $365,000 Active 43 DOM
-
2026-04-17$365,000 Active
ⓘ Source: listings_history table (triggers on properties + properties_extension) + one-shot
backfill from property_details.listing_events for pre-trigger history.
Tax reassessment forecast SC · Resets to sale price
- Current annual tax
- $8,332 · $694/mo
- Projected year-2 tax
- $8,332 · $694/mo
- Expected delta
- $0/yr ($0/mo · 0.0%)
ⓘ Screening estimate from a state-policy table — verify with the county assessor before closing.
Climate risk First Street
- Flood 1/10 Low FEMA zone X (shaded) · 0% chance over 30 yrs
- Wildfire 4/10 Moderate
- Heat 9/10 Extreme 7 d/yr ≥109°F today · 17 d/yr by 30 yrs out
- Wind 8/10 Severe 98% chance of damaging wind over 30 yrs
- Air quality 2/10 Low 2 unhealthy d/yr today · 2 by 30 yrs out
Nearby sold comps map
Loading sold comps map…
Walkable amenities ~0.75 mi
Loading nearby amenities…
Taxation est. · year 1
- Rental income
- $33,738
- − Mortgage interest
- −$20,446
- − Property taxes
- −$8,332
- − Insurance
- −$1,825
- − Repairs & maintenance
- −$2,699
- − Management
- −$2,699
- − Depreciation
- −$10,618
- Taxable loss
- −$12,882
- Est. tax savings @ 24.0%
- +$3,092
- After-tax cash flow
- $-3,382/yr
For passive investors: Depreciation is non-cash, so a rental often shows a tax loss while cash-flowing — sheltering income. Rental losses are passive: they offset passive income freely, and up to $25,000/yr can offset ordinary (W-2) income if you actively participate and your MAGI is under $100k (phasing out to $0 by $150k); unused losses carry forward. On sale, claimed depreciation is recaptured at up to 25%, and gains may owe capital-gains tax (a 1031 exchange can defer both). Figures are a year-1 estimate at your 24.0% rate — not tax advice; consult a CPA.
Schools (NCES district)
- District
- Jasper 01
- NCES district ID
- 4502520
- Math proficiency
- 12% ▼ -11.00%
- Reading proficiency
- 22% ▼ -5.00%
- Median HH income
- $37,878
- Composite
- 14.23/100
- National rank
- #9450
- State rank
- #77 of 80 in SC
Livability — Hardeeville
- Score
- 65/100
- State rank
- #136
- US rank
- #13105
Category grades
Schools grade is shown separately in the Schools card above.
Census & demographics
- Census place
- Hardeeville, SC
- County
- Jasper County · 26,362 people
- City population
- 11,373
- Metro
- Hilton Head Island-Bluffton, SC
- Population (ZIP)
- 11,373
- Household income
- $72,821
- Rent vs Own
- Severe rent burden
- 337.0
Population outlook (Jasper County) Hauer SSP2
- Today (2025)
- 34,428 people
- By 2030
- 37,718 · +9.6%
- By 2040
- 44,061 · +28.0%
- By 2050
- 50,302 · +46.1%
- By 2075
- 66,869 · +94.2%
- By 2100
- 110,455 · +220.8%
Race, ethnicity, and origin ACS 2023
- Neighborhood character
- Diverse neighborhood (Simpson 0.68)
- Race & ethnicity
- White 41% Hispanic / Latino 29% Black 27% Two or more races 14%
- Hispanic origin (detail)
- Mexican 14% Puerto Rican 3%
- Common ancestry
- Iranian 2% Slovak 2% Romanian 1%
- Foreign-born
- 16% · Canada, Jamaica
- Languages at home
- 71% English-only · Spanish 26% Russian/Polish/Slavic 1%
Political lean MEDSL · Jasper
- 2024 margin
- Lean R (+9.6) · D 44.7% · R 54.3% · Other 1.0%
- 2008→2024 swing
- -32.5pp toward R · 2008: 22.9pp · 2024: -9.6pp
- All cycles
- 2024: R+9.6 2020: D+0.8 2016: D+11.9 2012: D+15.6 2008: D+22.9
Not yet ingested
- Civics
- —
Market trends
- HPI YoY
- ▲ 60.81%
- Current HPI
- 384.6071
- Rent YoY
- ▼ -1.68%
- Metro
- Hilton Head Island-Bluffton, SC
- State GDP YoY
- ▲ 4.51%
- F500 in state
- 2
Industry mix (Fortune 500 HQ in SC)
| Industry | F500 HQs | Revenue |
|---|---|---|
| Packaging | 1 | $7B |
|
||
Price history
1 event — show timeline
- 2026-04-17 Listed $365,000 RSMLS
Property tax history
+2969.5%/yrLatest (2025): $8,332 · +2969.5% YoY. Source: county tax records.
Cash-flow waterfall
monthlySold comps — $/sqft
last 12 mo · ≤1 miLoading sold comps…