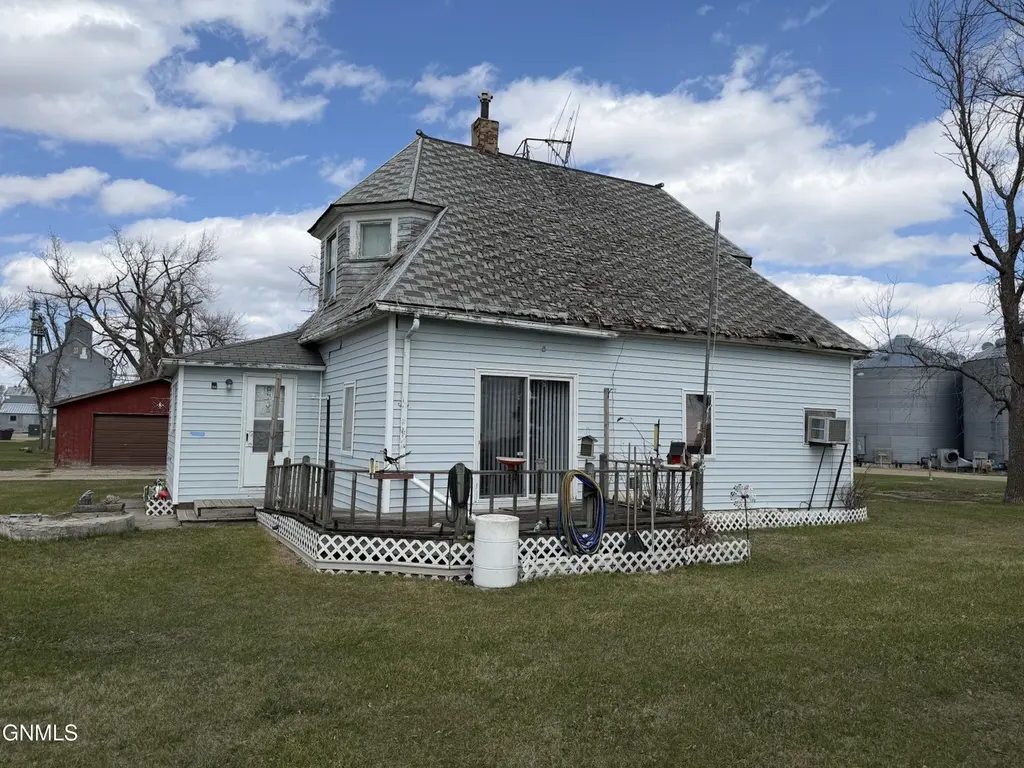
505 3rd Ave · Leal, ND
Flood risk No data
- FEMA flood zone
- —
- Chance of flooding over 30 yrs
- —
- Est. flood insurance / yr
- —
Fire risk No data
- Est. fire insurance / yr
- —
Heat risk No data
- Hot days now (above threshold)
- —
- Hot days in 30 yrs
- —
Wind risk No data
- Chance of severe wind over 30 yrs
- —
Air-quality risk No data
- Unhealthy air days now
- —
- Unhealthy air days in 30 yrs
- —
Risk factors via First Street. Map © Google.
Why this score? — see what drove the C- grade
The composite is a weighted blend of 9 inputs, each scored 0–100. Each bar is that input's sub-score; the figure is the points it added to the 100-point composite (weight × sub-score).
- Cash flow +15.0/30.0
- ARV discount +7.5/15.0
- 1% rule +5.0/10.0
- DSCR +5.0/10.0
- Appreciation +5.0/10.0
- Schools +4.8/10.0
- Livability +2.8/5.0
- Rent growth +2.5/5.0
- Condition / age +2.5/5.0
$23,000
🖨 Deal sheet 📄 Offer letter ✓ Due diligence
Key facts
- 9,843 sq ft lot
- Built 1900
- Listed 50 days
Property features AI
Exterior
- Parking: Outside parking; no garage
- Utilities: Private well water; Private sewer / septic tank; Propane available for utilities/heating
- Home design: Single family residence; Residential property
- Construction: Concrete and vinyl siding construction
- Exterior features: Irregular-shaped lot; Lot dimensions approximately 97.4 x 37.16 x 152 x 140; Lot size about 0.23 acres
Interior
- Kitchen: Range; Refrigerator; Dishwasher not listed
- Bathrooms: 1 full bathroom
- Heating & cooling: Propane heating; Ceiling fans and wall/window air conditioning
- Interior features: Dryer, Washer, Range, Refrigerator; Basement with concrete floor
- Laundry & utility: Washer and Dryer included
Neighborhood map
What this means for you Summary
Snapshot
- This is a 3-bed/1.0-bath single-family listed at $23k.
Deal economics
- At list price, monthly cash flow is $744 ($9k/yr) — positive.
- The deal already cash-flows at list — no discount required.
- Meets the 1% rule at list price ($1k rent vs $23k).
- Recommended offer: $22k (3.0% below list) — sets the bar for market timing.
Location & tenants
- Location reads 56/100 on livability (#317 in ND) — a working-class tenant base; expect higher turnover. Strengths: cost of living A+, crime A; Watch: health & safety D+, amenities F, commute F.
- Barnes County North 7 (rural): math 55% / reading 50% proficiency, ranked #29 of 169 in ND (top 17%) — acceptable for families but not a draw, mixed tenant base, ~2y average lease.
- Market conditions: 3 active listings in the ZIP; 9 units permitted in Barnes County in 2024 (0 in 5+ unit buildings).
Forward outlook
- In year one you build about $849 of equity ($159 loan paydown + $690 appreciation (3.0% local appreciation)).
- Barnes County population projected at +5% by 2050 — modest demand growth; plan on rents tracking national, not racing it.
- At projected returns (3.0% appreciation + 3.0% rent growth), your $6k cash investment doubles in ~1 year — after that, you're playing with house money.
Negotiation context
- It's been on market 51 days — a 3% lower offer ($22k) is reasonable based on typical stale-listing flexibility.
Risks & watch-outs
- Watch-outs: built in 1900 — expect roof / HVAC / electrical / plumbing capex.
Questions for the listing agent
- It's been on market 51 days. Have you received any prior offers? Is the seller open to a 3% concession, seller financing, or rate buy-down credit?
- Built in 1900 — when were the roof, HVAC, electrical panel, plumbing, and water heater last replaced?
- Is there a deadline driving the sale (1031 exchange, divorce, estate, relocation)? That informs how much negotiation room exists.
- What's the average days-on-market for RENTAL listings here right now (not sales)? A rising rental-DOM trend means longer vacancies and softer asking-rent achievability than the comps imply.
- What's the recent tenant-quality profile in this submarket — average credit score on applications, eviction rate, late-payment / NSF rate, and stable-employment percentage? A property-management company in the area should have these aggregated.
- How much new for-sale + rental construction is in the pipeline within 1–3 miles? Heavy new supply typically softens prices + rents 12–24 months out; constrained supply supports both.
Investment metrics
- 1% rule
- 4.97% ✓
- Cap rate
- 45.11%
- Cash-on-cash
- 138.63%
- DSCR
- 7.17
- GRM
- 1.7
CMA / ARV
No comps found within radius.
Projected returns pro-forma
3.0% appreciation · 3.0% rent growth · sell at horizon
- IRR
- —
- Equity multiple
- 8.79×
- Total profit
- $50,172
- Equity at exit
- $10,342
- IRR
- —
- Equity multiple
- 18.43×
- Total profit
- $112,228
- Equity at exit
- $15,938
Cash invested: $6,440 (down + closing). Projections, not guarantees.
Landlord ↔ Tenant lean methodology
- Overall (STATE)
- 82 Strongly Landlord-Friendly
- State North Dakota
- 82 Strongly Landlord-Friendly · R+20
- County
- — inherits STATE
- City
- — inherits STATE
ZIP-level market 58479
- Active inventory
- 3
- Price-to-rent
- 1.7×
Monthly cashflow live
- Estimated rent
- $1,143 medium interval (Pro) →
- Mortgage (P&I)
- −$121
- Tax est. 1.5%
- −$29 /mo · $345/yr
- Insurance
- −$10
- HOA
- −$0
- Vacancy / Maint / Mgmt
- −$240
- Net cashflow
- $744
Break-even live
UW: 25.0% down · 7.5% · 30yr · 1.5% tax · 5.0% vac · 8.0% maint · 8.0% mgmt
Financing live
Cash to close
- Down payment
- $5,750
- Closing costs
- $690
- Reserves months
- —
- Total cash needed
- —
Loan-product check · same deal, 3 products live
Conventional
25% down · 7.5% · 30yr
- Down + closing
- —
- Monthly P&I
- —
- Monthly cashflow
- —
- DSCR
- —
- Eligible?
- —
Personal DTI + credit; lowest rate.
DSCR
20% down · 8.5% · 30yr
- Down + closing
- —
- Monthly P&I
- —
- Monthly cashflow
- —
- DSCR
- —
- Eligible?
- —
No personal income docs; deal must DSCR.
Hard money
10% down · 12.0% · 12mo
- Down + closing
- —
- Monthly P&I
- —
- Monthly cashflow
- —
- DSCR
- —
- Eligible?
- —
Short-term bridge; refi at stabilization.
Listing history 17 events
-
2026-06-19days on market $23,000 Active 51 DOM
-
2026-06-18days on market $23,000 Active 50 DOM
-
2026-06-17days on market $23,000 Active 49 DOM
-
2026-06-16days on market $23,000 Active 48 DOM
-
2026-06-15days on market $23,000 Active 47 DOM
-
2026-06-14days on market $23,000 Active 45 DOM
-
2026-06-12days on market $23,000 Active 44 DOM
-
2026-06-09days on market $23,000 Active 41 DOM
-
2026-06-08days on market $23,000 Active 40 DOM
-
2026-06-07days on market $23,000 Active 39 DOM
-
2026-06-05days on market $23,000 Active 37 DOM
-
2026-06-04days on market $23,000 Active 35 DOM
-
2026-06-02days on market $23,000 Active 34 DOM
-
2026-06-01days on market $23,000 Active 33 DOM
-
2026-05-31days on market $23,000 Active 32 DOM
-
2026-05-31days on market $23,000 Active 31 DOM
-
2026-04-28$23,000 Active
ⓘ Source: listings_history table (triggers on properties + properties_extension) + one-shot
backfill from property_details.listing_events for pre-trigger history.
Nearby sold comps map
Loading sold comps map…
Walkable amenities ~0.75 mi
Loading nearby amenities…
Taxation est. · year 1
- Rental income
- $13,715
- − Mortgage interest
- −$1,288
- − Property taxes
- −$345
- − Insurance
- −$115
- − Repairs & maintenance
- −$1,097
- − Management
- −$1,097
- − Depreciation
- −$669
- Taxable income
- $9,103
- Est. tax owed @ 24.0%
- −$2,185
- After-tax cash flow
- $6,743/yr
For passive investors: Depreciation is non-cash, so a rental often shows a tax loss while cash-flowing — sheltering income. Rental losses are passive: they offset passive income freely, and up to $25,000/yr can offset ordinary (W-2) income if you actively participate and your MAGI is under $100k (phasing out to $0 by $150k); unused losses carry forward. On sale, claimed depreciation is recaptured at up to 25%, and gains may owe capital-gains tax (a 1031 exchange can defer both). Figures are a year-1 estimate at your 24.0% rate — not tax advice; consult a CPA.
Schools (NCES district)
- District
- Barnes County North 7
- NCES district ID
- 3800060
- Math proficiency
- 55% ▬ 0.00%
- Reading proficiency
- 50% ▲ 5.00%
- Median HH income
- $57,667
- Composite
- 47.52/100
- National rank
- #4976
- State rank
- #29 of 169 in ND
Livability — Leal
- Score
- 56/100
- State rank
- #317
- US rank
- #22503
Category grades
Schools grade is shown separately in the Schools card above.
Census & demographics
- Census place
- Leal, ND
- Population (ZIP)
- 160
Population outlook (Barnes County) Hauer SSP2
- Today (2025)
- 11,119 people
- By 2030
- 11,184 · +0.6%
- By 2040
- 11,336 · +2.0%
- By 2050
- 11,647 · +4.7%
- By 2075
- 14,006 · +26.0%
- By 2100
- 17,179 · +54.5%
Race, ethnicity, and origin ACS 2023
- Neighborhood character
- Predominantly White (99%)
- Race & ethnicity
- White 99%
- Common ancestry
- Portuguese 28% Lithuanian 4% Scotch-Irish 1%
- Languages at home
- 99% English-only · Spanish 1%
Political lean MEDSL · Barnes
- 2024 margin
- Solid R (+35.3) · D 31.4% · R 66.7% · Other 1.9%
- 2008→2024 swing
- -33.8pp toward R · 2008: -1.5pp · 2024: -35.3pp
- All cycles
- 2024: R+35.3 2020: R+31.4 2016: R+29.7 2012: R+10.3 2008: R+1.5
Not yet ingested
- Civics
- —
Market trends
- HPI YoY
- —
- Current HPI
- —
- Rent YoY
- —
- Metro
- —
- State GDP YoY
- ▲ 2.09%
- F500 in state
- 2
Industry mix (Fortune 500 HQ in ND)
| Industry | F500 HQs | Revenue |
|---|---|---|
| Utilities / Construction | 1 | $6B |
|
||
Price history
1 event — show timeline
- 2026-04-28 Listed $23,000 GNMLS
Cash-flow waterfall
monthlySold comps — $/sqft
last 12 mo · ≤1 miLoading sold comps…